Download to read offline

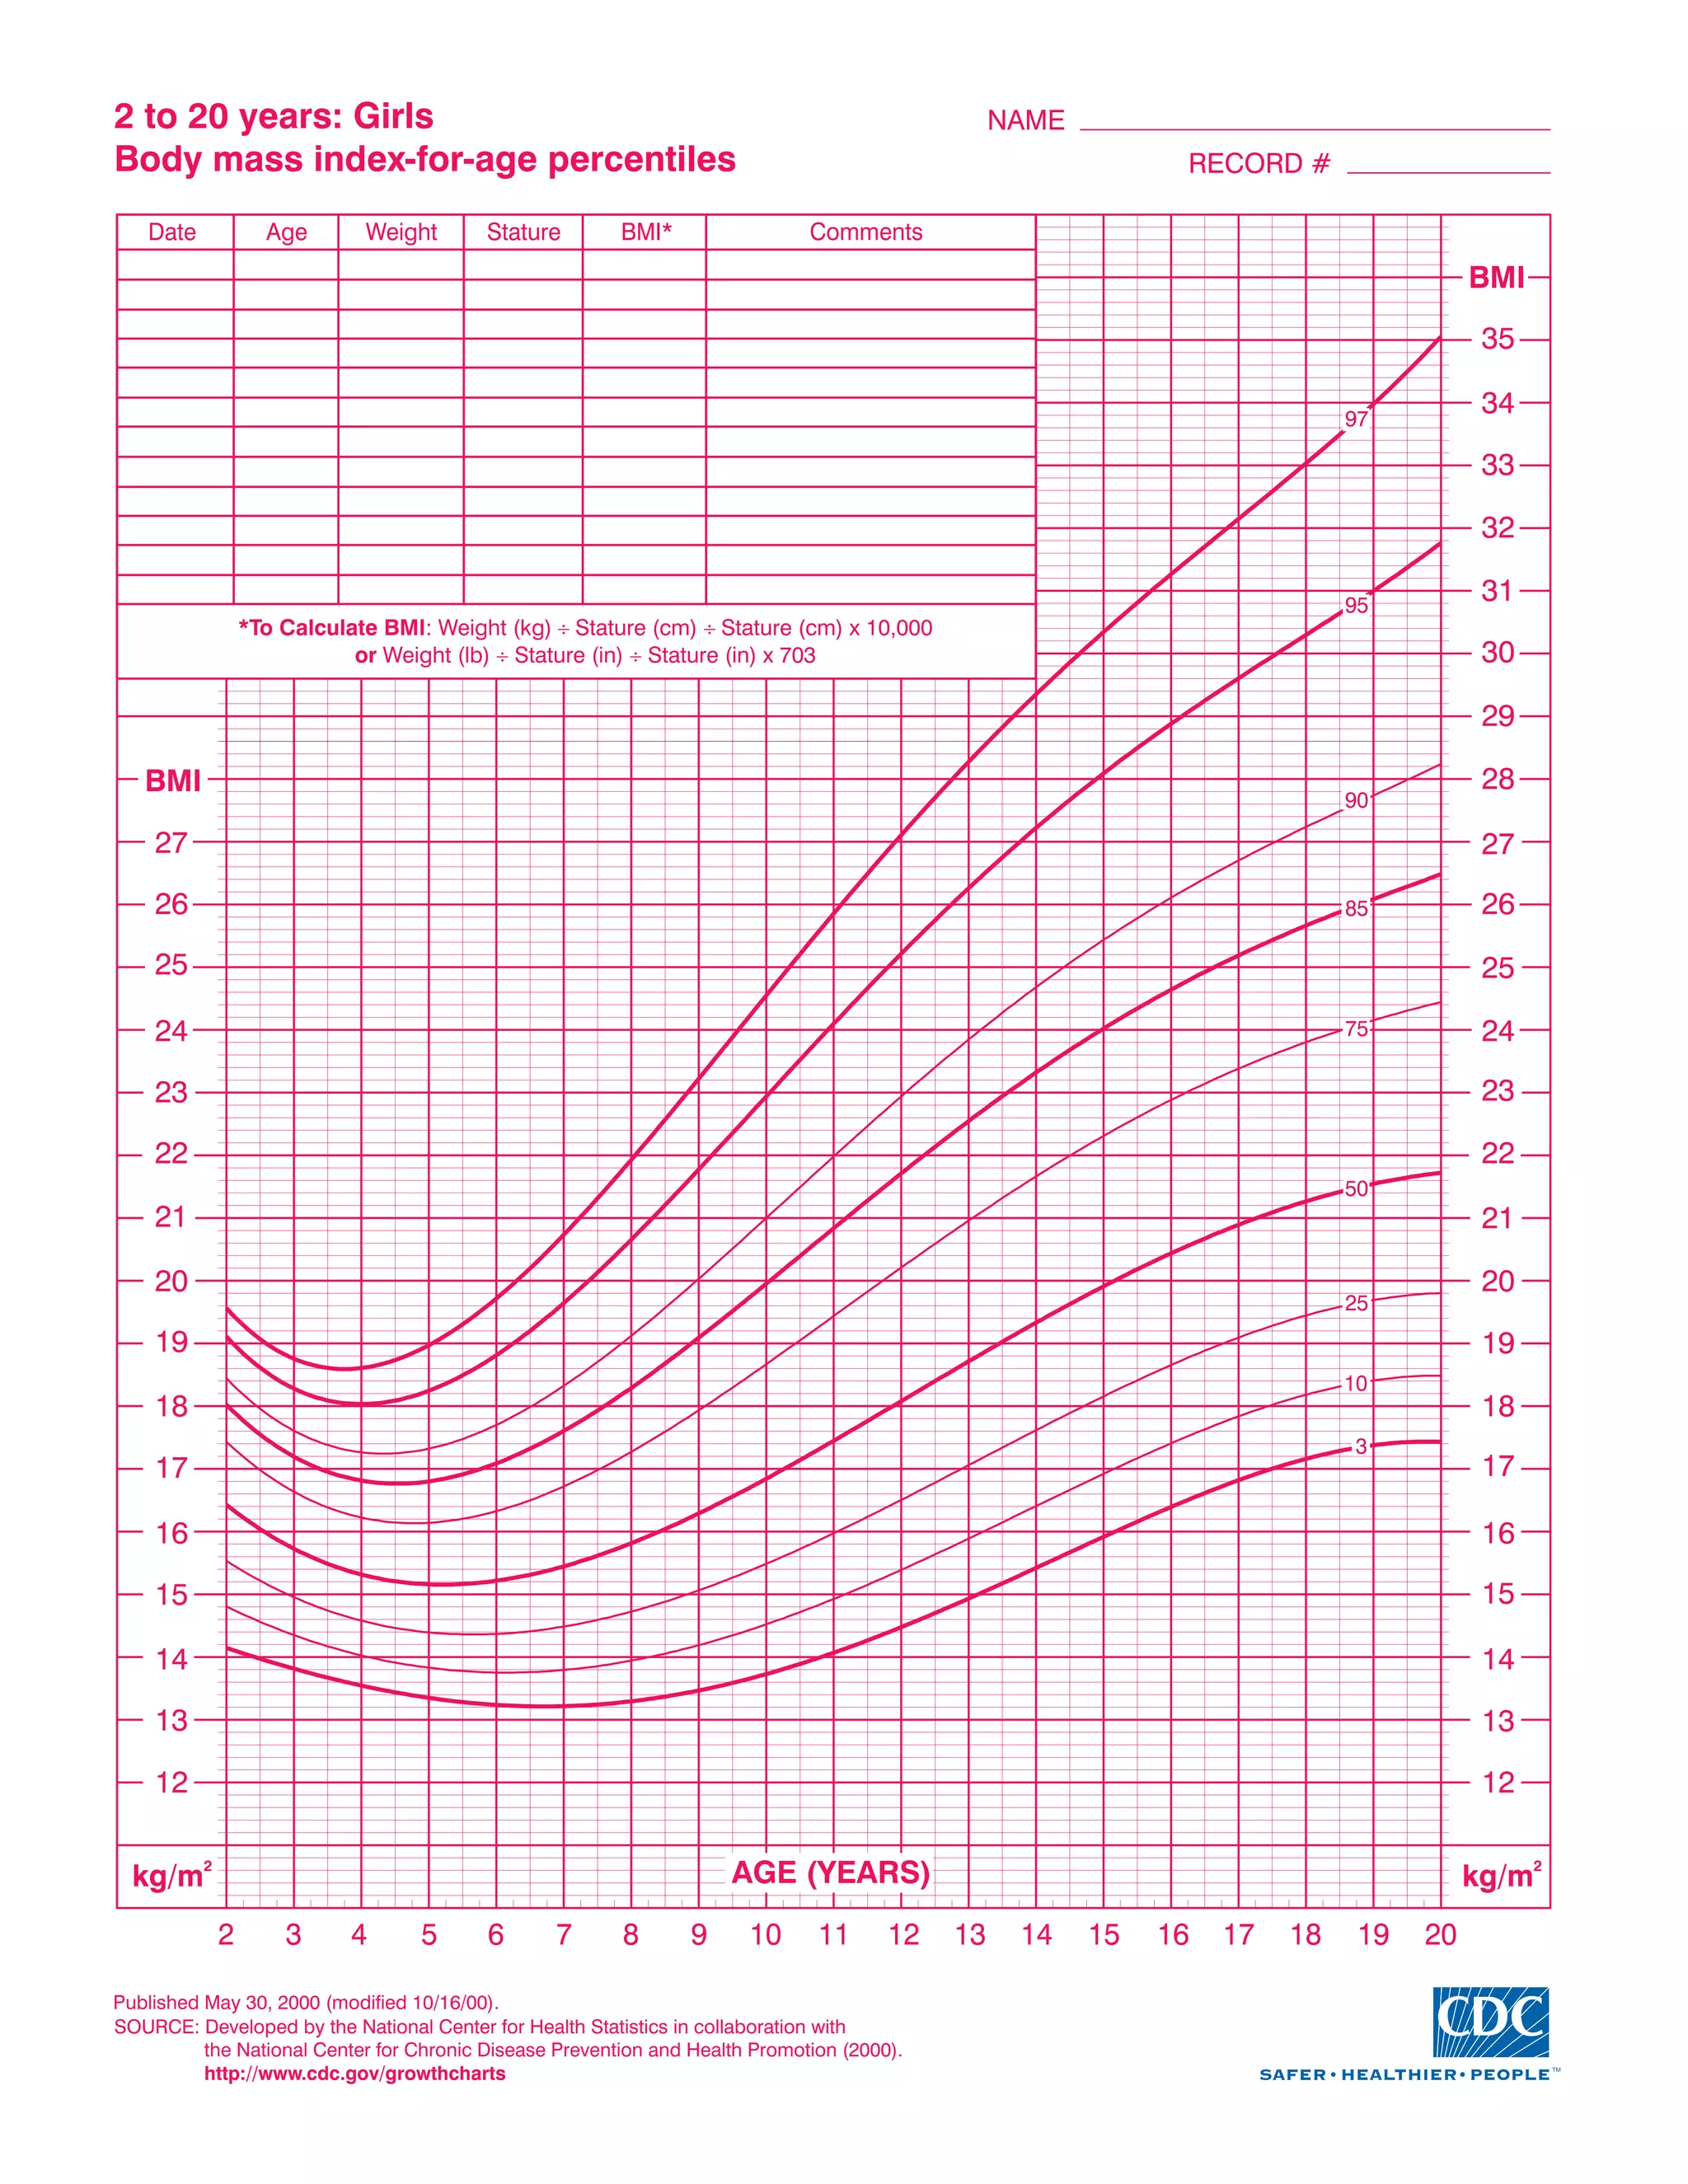

This document contains a BMI chart for girls ages 2 to 20. The chart lists BMI percentiles ranging from 3 to 97 on the left y-axis and age in years on the bottom x-axis. Curves on the chart indicate BMI levels from 13 to 35 kg/m^2 corresponding to different percentiles for a girl's age. Additional information includes the patient's name, record number, dates, and fields to record weight, stature, BMI, and comments.


