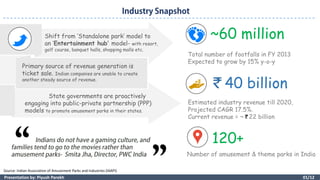
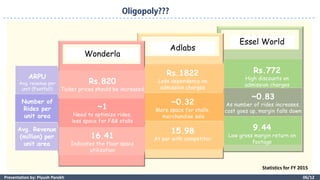
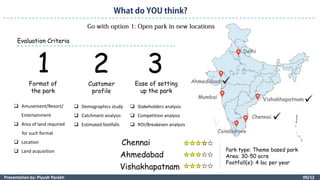
Indian Amusement Park Industry
What does the future look like?
Sky wheel at Twilight Wonderla Bangalore
12th February 2017
120+
Number of amusement & theme parks in India
40 billion
Estimated industry revenue till 2020,
Projected CAGR 17.5%.
Current revenue = ~ 22 billion
Source: Indian Association of Amusement Parks and Industries (IAAPI)
~60 million
Total number of footfalls in FY 2013
Expected to grow by 15% y-o-y
Shift from ‘Standalone park’ model to
an ‘Entertainment hub’ model- with resort,
golf course, banquet halls, shopping malls etc.
01/12Presentation by: Piyush Parekh
Primary source of revenue generation is
ticket sale. Indian companies are unable to create
another steady source of revenue.
State governments are proactively
engaging into public-private partnership (PPP)
models to promote amusement parks in their states.
02/12Presentation by: Piyush Parekh
Organic
Growth
12
3 4
Innovation Brand
Creation
Word-of-Mouth
Publicity
 Invest in creating a brand
 Differentiate yourself from
competitors
 Innovation at core of business
 Trade-off in radical, rational &
robust growth strategies
 Maintain healthy profit
margins
 Build a strong relationship
with stakeholders
 Provide “value for money”
experience
 Optimize marketing efforts
Identifying strengths is the first step to strategize sustainable growth.
03/12Presentation by: Piyush Parekh
HighLow
Low High
Riskinvolved
Return gained
Incurred Cost
Associated Benefit
Overall
Score
Intangible Risks/Deterrent
Rationale:
Land
Acquisition
Cost of
Employee
Development Operating
Cost
Revenue
Growth
Brand
Expansion
Number of
footfalls
Customer
Awareness
 Delay in government approvals
 Collaborating with unfamiliar local
vendor
 Susceptible to local taxation
 Acquisition of desired land & location
 Diversity adaptation
1.1
1
Investing in new territory ensures rapid expansion of
customer base. Venturing into new geography imposes high
risk.
Major Minor
Major Minor
04/12Presentation by: Piyush Parekh
HighLow
Low High
Riskinvolved
Return gained
Incurred Cost
Associated Benefit
Overall
Score
Rationale:
Intangible Risks/Deterrent
 Legal dispute over land
 Inexperience in hospitality
 Brand is associated closely with
“park” in consumer’s mind.
 Low occupancy rate at resort
Innovation
Cost
Land
Acquisition
Development Customer
Acquisition
Economy
of scale
Revenue
Growth
Number of
footfalls
0.2
1
2
In long run, expanding product portfolio minimizes risk and
create a differentiation. New brand associations are
required to be carefully designed.
Major Minor
Major Minor
05/12Presentation by: Piyush Parekh
HighLow
Low High
Riskinvolved
Return gained
Incurred Cost
Associated Benefit
Overall
Score
Rationale:
Intangible Risks/Deterrent
 Brand positioning conflict
 Additional safety norms for kids
 Customer attrition
Customer
Acquisition
Customer
Retention
Innovation
Cost
Economy
of scale
Revenue
Growth
-1.3
1
2
3
Expanding customer base, here, essentially is moving away
from target customer segment. The brand positioning
conflict may result into driving primary target segment away.
Major Minor
Major Minor
06/12Presentation by: Piyush Parekh
Wonderla
Adlabs
Essel World
ARPU
Avg. revenue per
unit (Footfall)
Rs.820
Ticket prices should be increased
Rs.1822
Less dependency on
admission charges
Rs.772
High discounts on
admission charges
Number of
Rides per
unit area
~1
Need to optimize rides,
less space for F&B stalls
~0.32
More space for stalls,
merchandise sale
~0.83
As number of rides increases,
cost goes up, margin falls down
Avg. Revenue
(million) per
unit area
16.41
Indicates the floor space
utilization
15.98
At par with competitor
9.44
Low gross margin return on
footage
Statistics for FY 2015
07/12Presentation by: Piyush Parekh
Word Cloud
Wonderla Adlabs Imagica
 Source: Facebook official page
 Vintage: 2 months (Dec’16 & Jan’17)
 Tool used: R (Text mining)
Avg. likes per post
Avg. comments per post
Avg. shares per post
Avg. posts
per month~50
Wonderla
Imagica
Imagica
Imagica
Wonderla
Wonderla
08/12Presentation by: Piyush Parekh
Revenue = Number of footfall X Average spend per customer
Priority 1 : Increase number of footfall Priority 2 : Increase avg. spend per customer
Parks in new
location
Open resorts in
other two parks
Option 1 Option 2
Expand
customer base
Option 1 Option 2
Increase non-product
based revenue
09/12Presentation by: Piyush Parekh
1 2 3
Evaluation Criteria
Chennai
Ahmedabad
Vishakhapatnam
Format of
the park
Customer
profile
Ease of setting
up the park
 Amusement/Resort/
Entertainment
 Area of land required
for such format
 Location
 Land acquisition
 Demographics study
 Catchment analysis
 Estimated footfalls
 Stakeholders analysis
 Competition analysis
 ROI/Breakeven analysis
Delhi
Chennai
Vishakhapatnam
Coimbatore
Mumbai
Ahmedabad
Park type: Theme based park
Area: 30-50 acre
Footfall(e): 4 lac per year



10/12Presentation by: Piyush Parekh
Timeline
Costofimplementation
Phase 1 Phase 2 Phase 3
Increase in
ticket price
Product portfolio
optimization
Market basket analysis
Mergers & Acquisition/
Franchise
Raising capital
for investment
Floor space
optimization
Direct impact on profit Indirect impact on profit* Bubble size indicates possible increase in profit (monetary value) ** Not to scale
Wonderla has significantly low
avg. revenue per customer
Make use of leverage. Capital
investment should be funded by
debt & not retained earnings.
Reorganize the
floor plan.
Optimize number of rides
so as to maximize revenue.
Introduce gaming arena,
virtual reality games & shows
Identify the most profitable rides.
The industry is in growth phase.
As it matures, 3-4 major
players will dominate the
entertainment park industry.
It is advisable to plan & expand
customer base and geographic
footprints.
11/12Presentation by: Piyush Parekh
Proposed floor plan layout
1) Instead of having all the kiosks & food stalls
clustered together at one place, have them
spread intermittently all over the park.
2) Place differentiated products near entry.
3) Quality control. Maximize GMROF
4) Availability of multiple cuisine
Destination rides- differentiated offerings which justify the premium charges.
Routine rides- typical rides characterizes value for money for customers.
Presentation by: Piyush Parekh
Thank You !!!

Indian Amusement Park Industry

  • 1.
    Indian Amusement ParkIndustry What does the future look like? Sky wheel at Twilight Wonderla Bangalore 12th February 2017
  • 2.
    120+ Number of amusement& theme parks in India 40 billion Estimated industry revenue till 2020, Projected CAGR 17.5%. Current revenue = ~ 22 billion Source: Indian Association of Amusement Parks and Industries (IAAPI) ~60 million Total number of footfalls in FY 2013 Expected to grow by 15% y-o-y Shift from ‘Standalone park’ model to an ‘Entertainment hub’ model- with resort, golf course, banquet halls, shopping malls etc. 01/12Presentation by: Piyush Parekh Primary source of revenue generation is ticket sale. Indian companies are unable to create another steady source of revenue. State governments are proactively engaging into public-private partnership (PPP) models to promote amusement parks in their states.
  • 3.
    02/12Presentation by: PiyushParekh Organic Growth 12 3 4 Innovation Brand Creation Word-of-Mouth Publicity  Invest in creating a brand  Differentiate yourself from competitors  Innovation at core of business  Trade-off in radical, rational & robust growth strategies  Maintain healthy profit margins  Build a strong relationship with stakeholders  Provide “value for money” experience  Optimize marketing efforts Identifying strengths is the first step to strategize sustainable growth.
  • 4.
    03/12Presentation by: PiyushParekh HighLow Low High Riskinvolved Return gained Incurred Cost Associated Benefit Overall Score Intangible Risks/Deterrent Rationale: Land Acquisition Cost of Employee Development Operating Cost Revenue Growth Brand Expansion Number of footfalls Customer Awareness  Delay in government approvals  Collaborating with unfamiliar local vendor  Susceptible to local taxation  Acquisition of desired land & location  Diversity adaptation 1.1 1 Investing in new territory ensures rapid expansion of customer base. Venturing into new geography imposes high risk. Major Minor Major Minor
  • 5.
    04/12Presentation by: PiyushParekh HighLow Low High Riskinvolved Return gained Incurred Cost Associated Benefit Overall Score Rationale: Intangible Risks/Deterrent  Legal dispute over land  Inexperience in hospitality  Brand is associated closely with “park” in consumer’s mind.  Low occupancy rate at resort Innovation Cost Land Acquisition Development Customer Acquisition Economy of scale Revenue Growth Number of footfalls 0.2 1 2 In long run, expanding product portfolio minimizes risk and create a differentiation. New brand associations are required to be carefully designed. Major Minor Major Minor
  • 6.
    05/12Presentation by: PiyushParekh HighLow Low High Riskinvolved Return gained Incurred Cost Associated Benefit Overall Score Rationale: Intangible Risks/Deterrent  Brand positioning conflict  Additional safety norms for kids  Customer attrition Customer Acquisition Customer Retention Innovation Cost Economy of scale Revenue Growth -1.3 1 2 3 Expanding customer base, here, essentially is moving away from target customer segment. The brand positioning conflict may result into driving primary target segment away. Major Minor Major Minor
  • 7.
    06/12Presentation by: PiyushParekh Wonderla Adlabs Essel World ARPU Avg. revenue per unit (Footfall) Rs.820 Ticket prices should be increased Rs.1822 Less dependency on admission charges Rs.772 High discounts on admission charges Number of Rides per unit area ~1 Need to optimize rides, less space for F&B stalls ~0.32 More space for stalls, merchandise sale ~0.83 As number of rides increases, cost goes up, margin falls down Avg. Revenue (million) per unit area 16.41 Indicates the floor space utilization 15.98 At par with competitor 9.44 Low gross margin return on footage Statistics for FY 2015
  • 8.
    07/12Presentation by: PiyushParekh Word Cloud Wonderla Adlabs Imagica  Source: Facebook official page  Vintage: 2 months (Dec’16 & Jan’17)  Tool used: R (Text mining) Avg. likes per post Avg. comments per post Avg. shares per post Avg. posts per month~50 Wonderla Imagica Imagica Imagica Wonderla Wonderla
  • 9.
    08/12Presentation by: PiyushParekh Revenue = Number of footfall X Average spend per customer Priority 1 : Increase number of footfall Priority 2 : Increase avg. spend per customer Parks in new location Open resorts in other two parks Option 1 Option 2 Expand customer base Option 1 Option 2 Increase non-product based revenue
  • 10.
    09/12Presentation by: PiyushParekh 1 2 3 Evaluation Criteria Chennai Ahmedabad Vishakhapatnam Format of the park Customer profile Ease of setting up the park  Amusement/Resort/ Entertainment  Area of land required for such format  Location  Land acquisition  Demographics study  Catchment analysis  Estimated footfalls  Stakeholders analysis  Competition analysis  ROI/Breakeven analysis Delhi Chennai Vishakhapatnam Coimbatore Mumbai Ahmedabad Park type: Theme based park Area: 30-50 acre Footfall(e): 4 lac per year   
  • 11.
    10/12Presentation by: PiyushParekh Timeline Costofimplementation Phase 1 Phase 2 Phase 3 Increase in ticket price Product portfolio optimization Market basket analysis Mergers & Acquisition/ Franchise Raising capital for investment Floor space optimization Direct impact on profit Indirect impact on profit* Bubble size indicates possible increase in profit (monetary value) ** Not to scale Wonderla has significantly low avg. revenue per customer Make use of leverage. Capital investment should be funded by debt & not retained earnings. Reorganize the floor plan. Optimize number of rides so as to maximize revenue. Introduce gaming arena, virtual reality games & shows Identify the most profitable rides. The industry is in growth phase. As it matures, 3-4 major players will dominate the entertainment park industry. It is advisable to plan & expand customer base and geographic footprints.
  • 12.
    11/12Presentation by: PiyushParekh Proposed floor plan layout 1) Instead of having all the kiosks & food stalls clustered together at one place, have them spread intermittently all over the park. 2) Place differentiated products near entry. 3) Quality control. Maximize GMROF 4) Availability of multiple cuisine Destination rides- differentiated offerings which justify the premium charges. Routine rides- typical rides characterizes value for money for customers.
  • 13.
    Presentation by: PiyushParekh Thank You !!!