This document provides an overview and summary of the India State-Level Disease Burden Initiative report. It acknowledges contributions from advisory boards and expert groups in health areas such as cancer, cardiovascular disease, and injuries. The initiative was a collaboration between the Indian Council of Medical Research, Public Health Foundation of India, and Institute for Health Metrics and Evaluation to analyze disease burden trends in India from 1990 to 2016 at the state level. The report findings inform health policy and planning to reduce disease burden through strategies like addressing risk factors, improving health systems and financing, and strengthening health data collection.


![30 India: Health of the Nation’s States
1990
2016
Ratio
Less
than
0.31
0.31
−
0.40
0.41
−
0.55
0.56
−
0.75
0.76
−
1.00
1.01
−
1.30
1.31
−
1.70
More
than
1.70
0.31
−
0.40
0.41
−
0.55
0.56
−
0.75
0.76
−
1.00
1.01
−
1.30
1.31
−
1.70
More
than
1.70
Ratio
Less
than
0.31
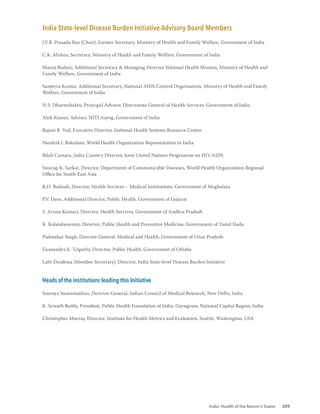
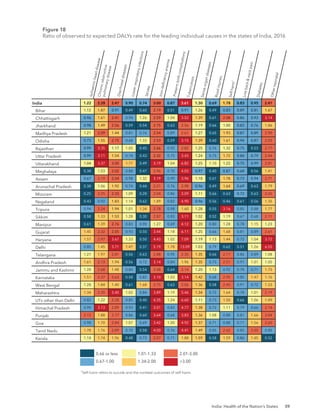
The
states
of
Chhattisgarh,
Jharkhand,
Telangana,
and
Uttarakhand
did
not
exist
in
1990,
as
they
were
created
from
existing
larger
states
in
2000
or
later.
They
are
shown
in
the
1990
map
for
comparison
with
2016.
Delhi
[1.16]
Haryana
[1.34]
Himachal
Pradesh
[1.14]
Jammu
and
Kashmir
[1.14]
Punjab
[1.05]
Rajasthan
[2.05]
Uttarakhand
[1.4]
Arunachal
Pradesh
[1.96]
Assam
[1.66]
Bihar
[2.06]
Chhattisgarh
[1.97]
Jharkhand
[2.04]
Madhya
Pradesh
[2.05]
Manipur
[1.37]
Meghalaya
[1.98]
Mizoram
[1.18]
Nagaland
[1.52]
Odisha
[2.00]
Sikkim
[1.44]
Tripura
[1.38]
Uttar
Pradesh
[2.08]
West
Bengal
[1.34]
Andhra
Pradesh
[1.5]
Goa
[0.84]
Gujarat
[1.47]
Karnataka
[1.16]
Kerala
[0.49]
Maharashtra
[1.1]
Tamil
Nadu
[1.02]
Telangana
[1.33]
Delhi
[0.38]
Haryana
[0.4]
Himachal
Pradesh
[0.3]
Jammu
and
Kashmir
[0.34]
Punjab
[0.29]
Rajasthan
[0.66]
Uttarakhand
[0.46]
Arunachal
Pradesh
[0.55]
Assam
[0.62]
Bihar
[0.74]
Chhattisgarh
[0.6]
Jharkhand
[0.69]
Madhya
Pradesh
[0.6]
Manipur
[0.42]
Mizoram
[0.53]
Nagaland
[0.47]
Odisha
[0.58]
Sikkim
[0.45]
Tripura
[0.45]
Uttar
Pradesh
[0.68]
Andhra
Pradesh
[0.37]
Goa
[0.21]
Gujarat
[0.46]
Karnataka
[0.34]
Kerala
[0.16]
Maharashtra
[0.33]
Tamil
Nadu
[0.26]
Telangana
[0.38]
Meghalaya
[0.64]
West
Bengal
[0.33]
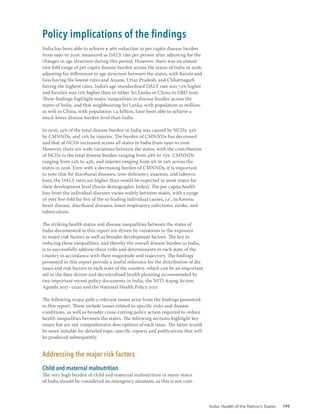
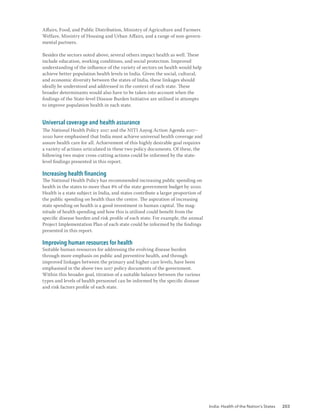
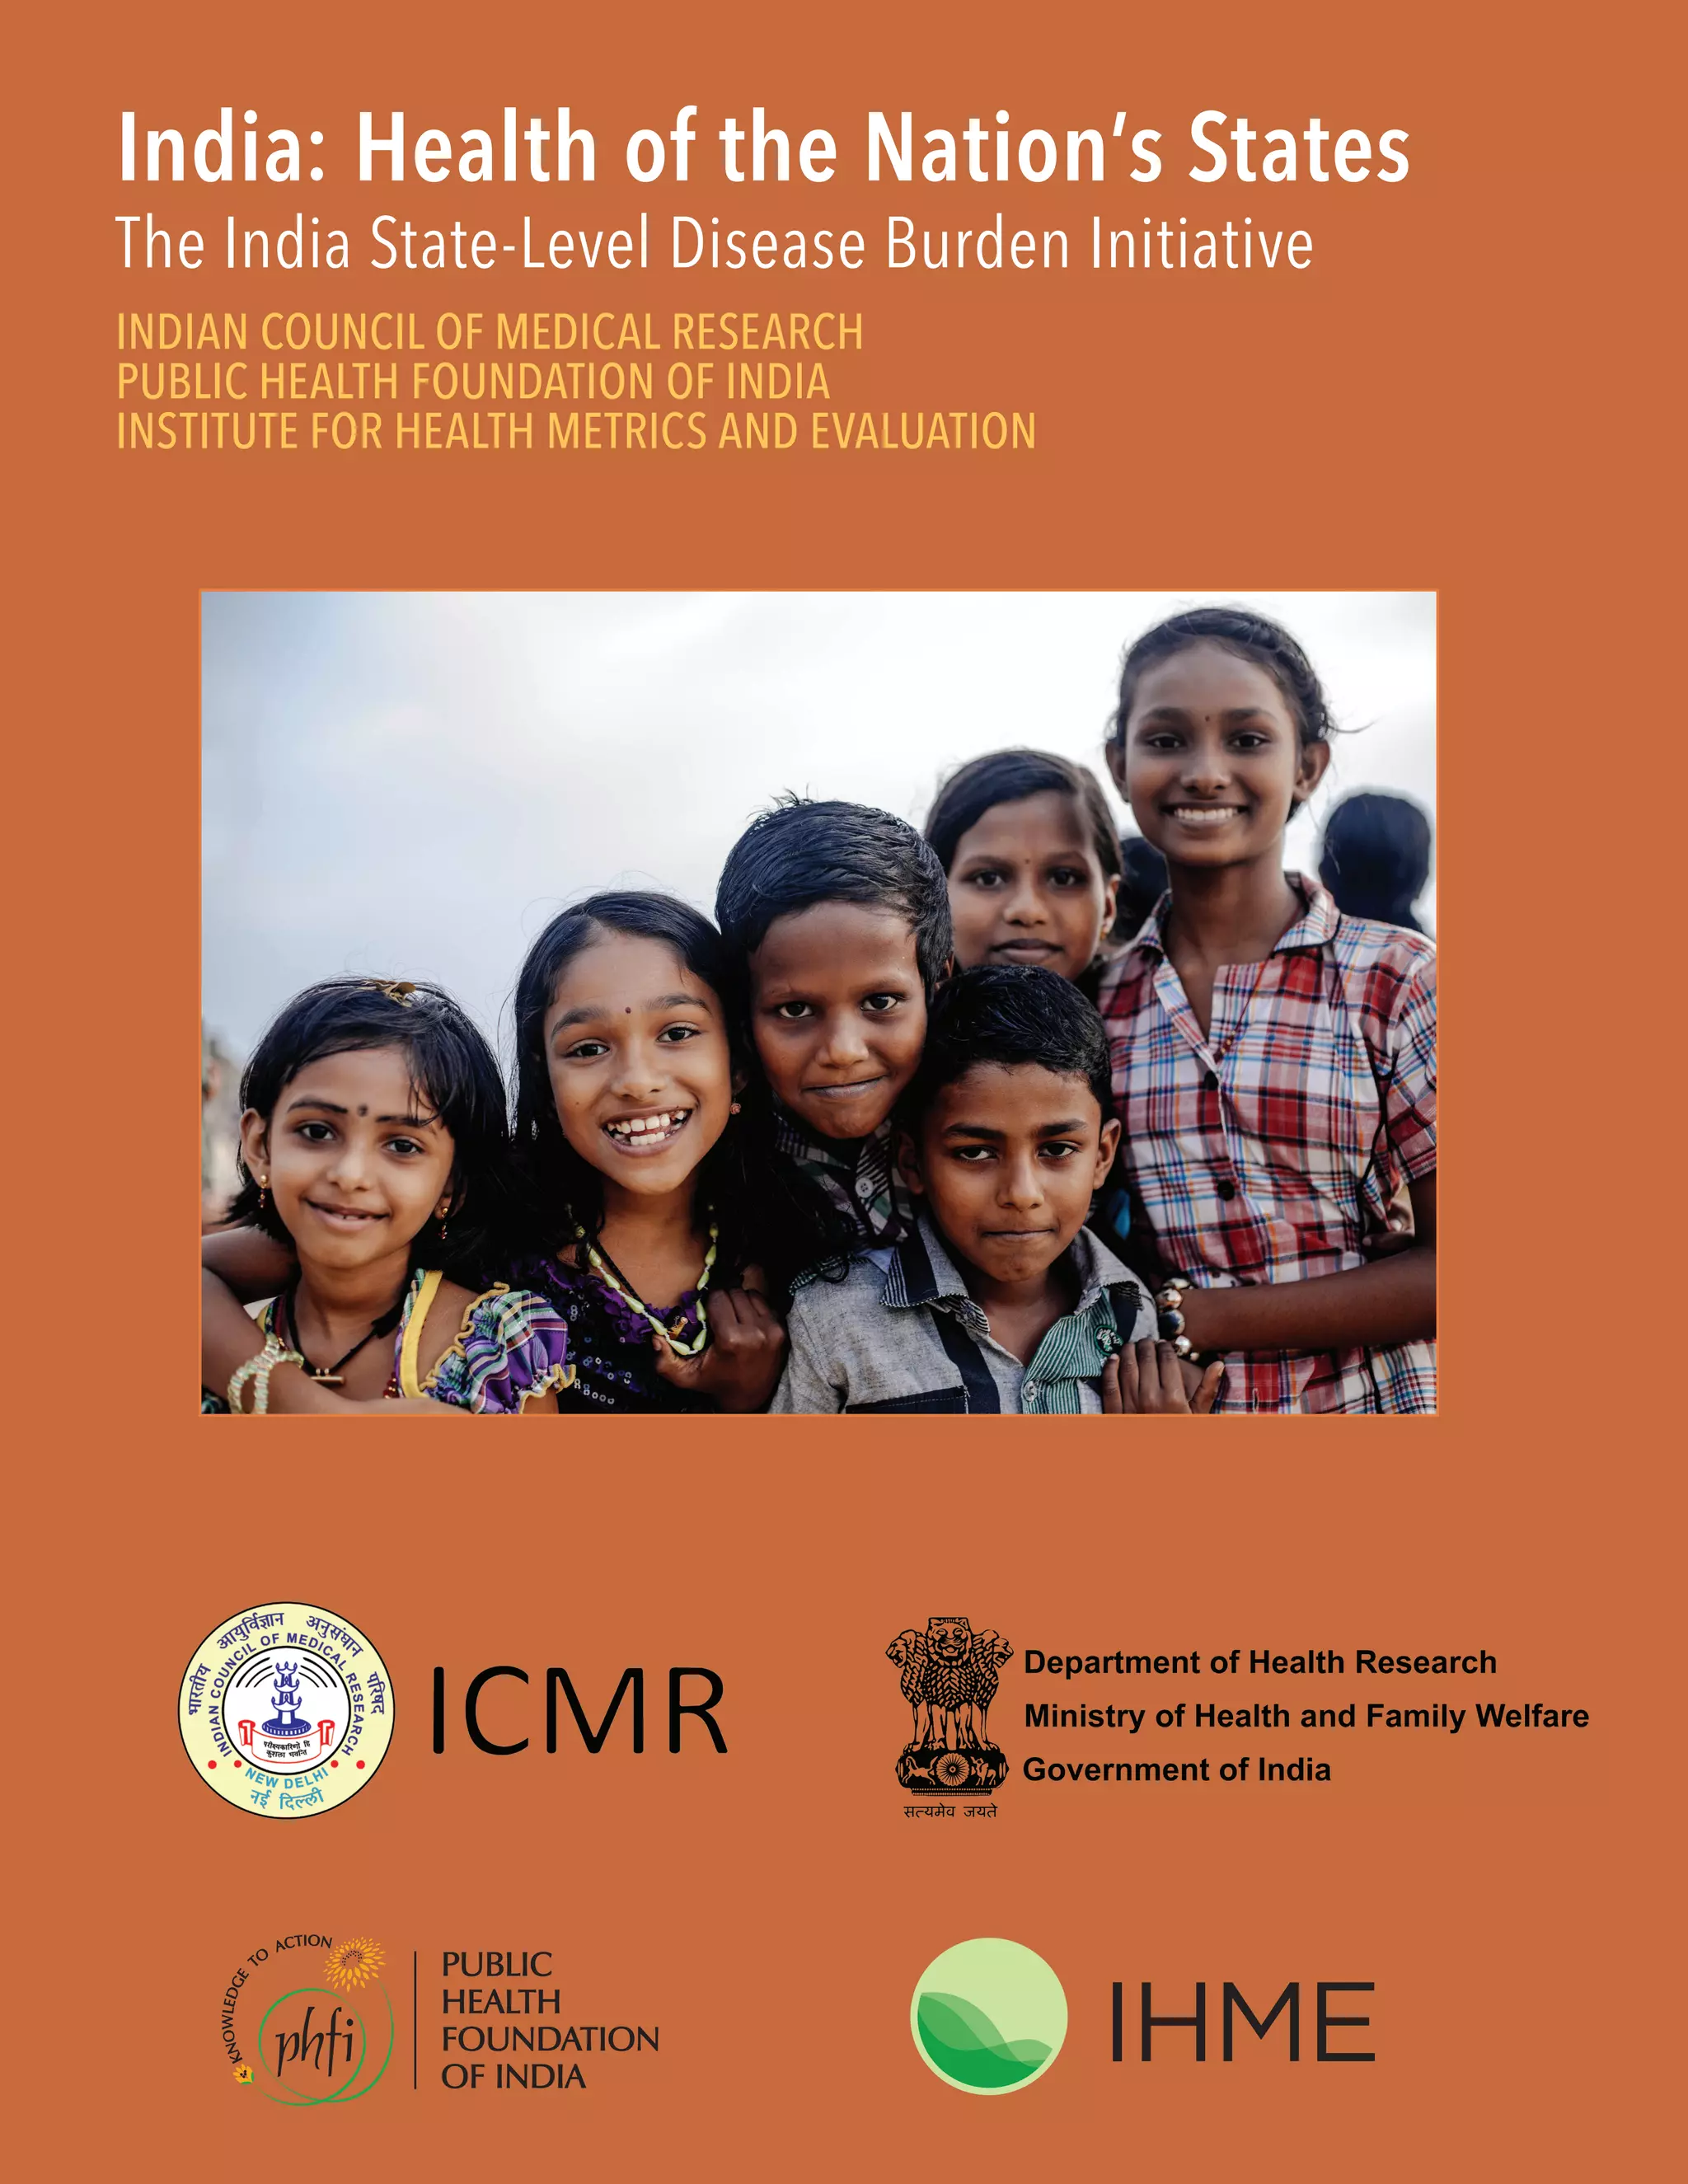
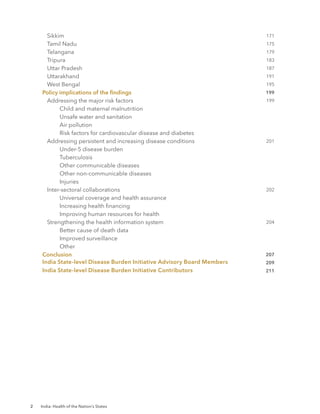
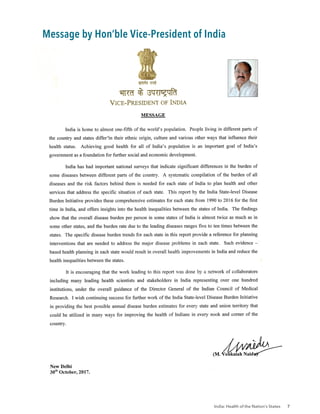
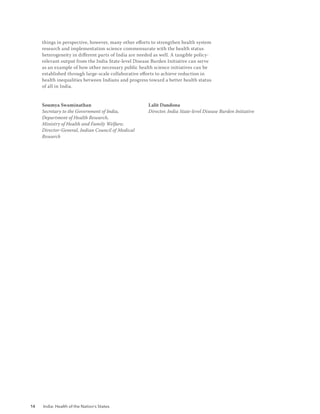
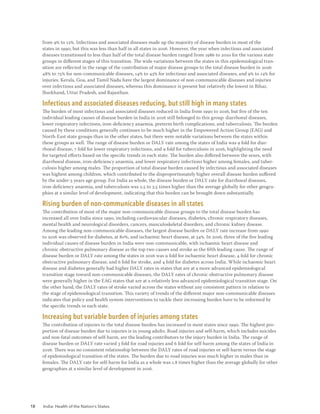
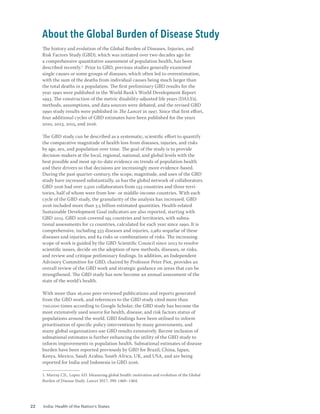
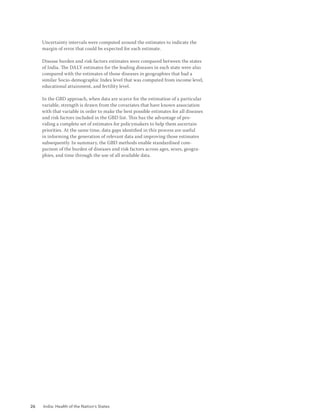
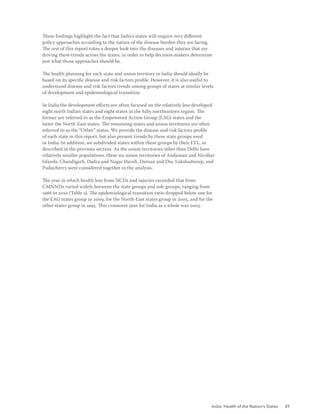
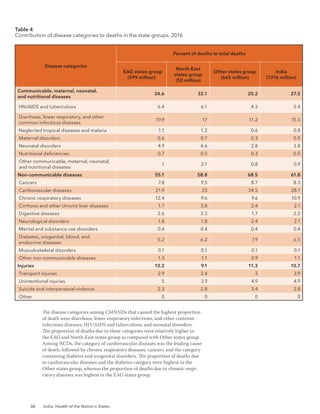
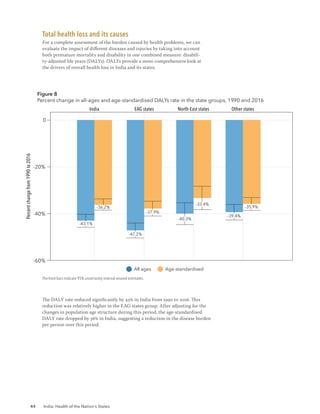
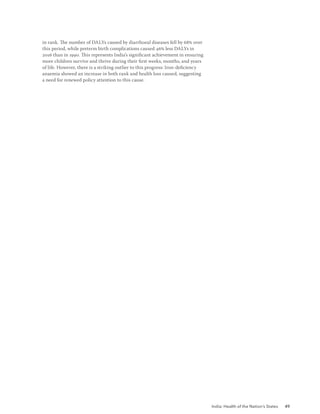
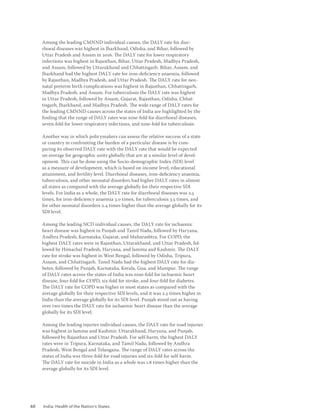
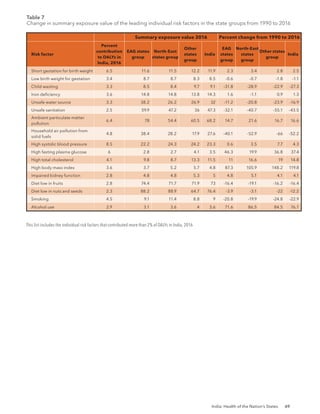
Figure 3
Epidemiological transition ratios of the states of India, 1990 and 2016
The
states
of
Chhattisgarh,
Jharkhand,
Telangana,
and
Uttarakhand
did
not
exist
in
1990,
as
they
were
created
from
existing
larger
states
in
2000
or
later.
Data
for
these
four
new
states
were
disaggregated
from
their
parent
states
based
on
their
current
district
composition.
These
states
are
shown
in
the
1990
map
for
comparison
with
2016.](https://image.slidesharecdn.com/indiahealthofthenationsstatesreport2017-230818115250-fe055a08/85/India_Health_of_the_Nation-s_States_Report_2017-pdf-34-320.jpg)
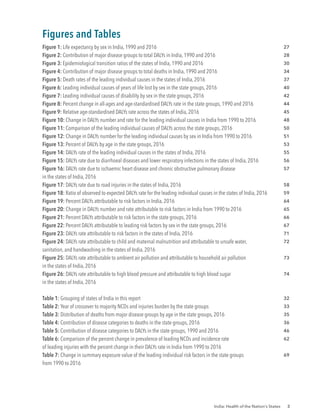
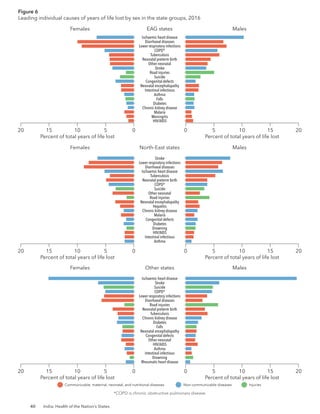
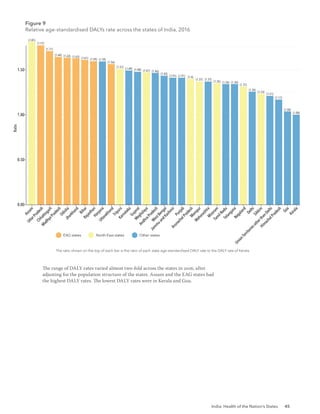
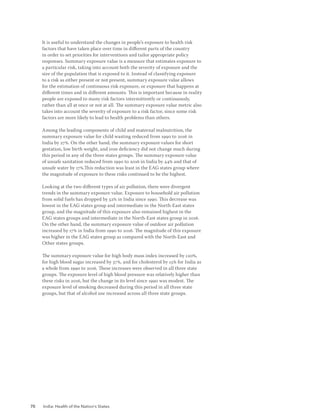
![India: Health of the Nation’s States 35
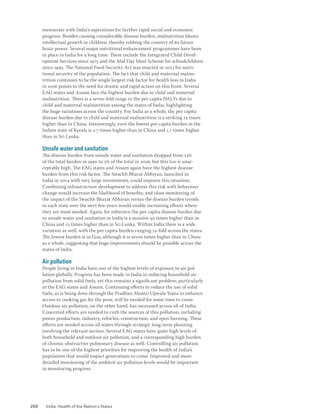
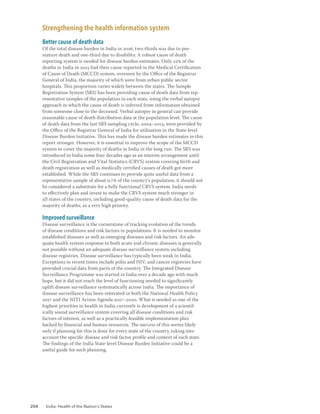
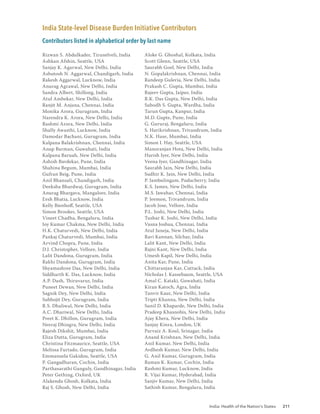
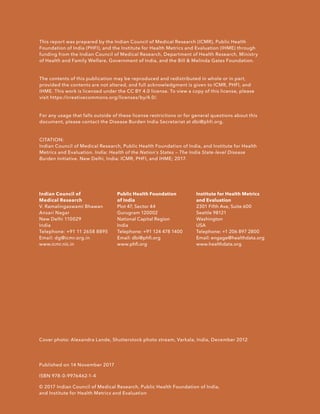
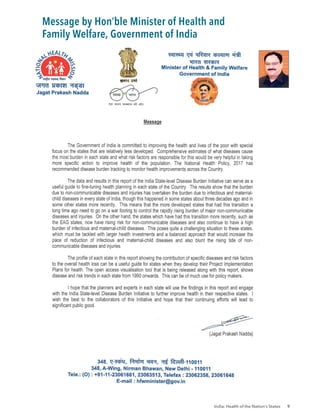
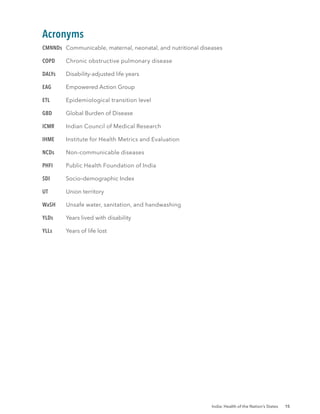
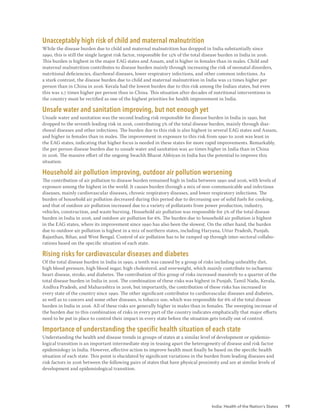
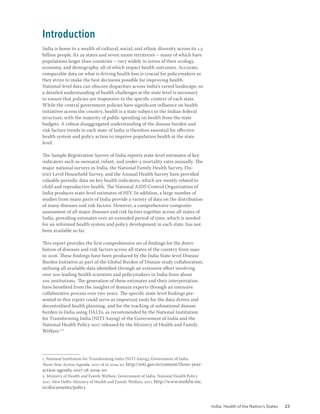
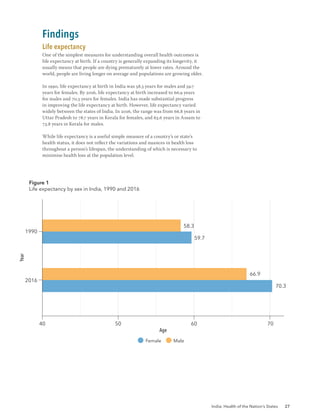
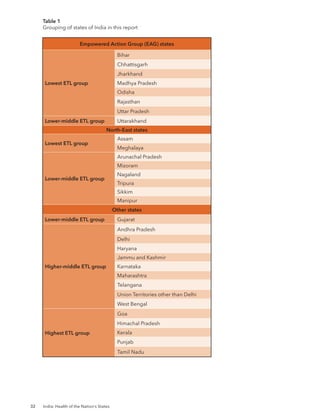
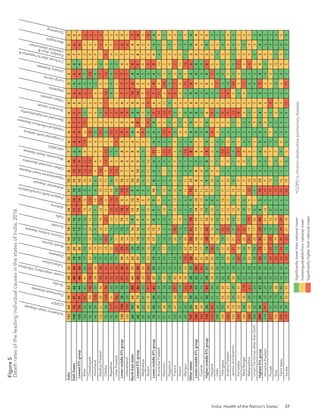
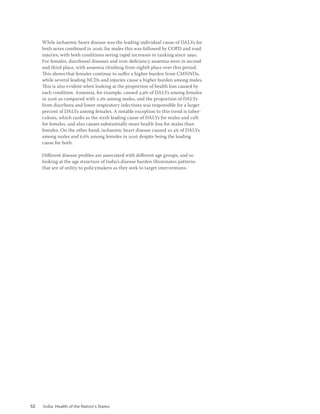
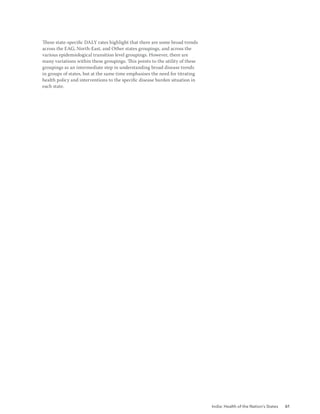
The death rate due to NCDs was over two times that due to CMNNDs in
India in 2016. The proportion of deaths and the death rates due to CMNNDs
were higher in EAG and North-East states group as compared with the
Other states group, whereas the proportion of deaths and the death rates
due to NCDs were highest in the Other states group. CMNNDs caused the
predominant proportion of deaths in the age group 0-14 years in all the states
groups. Injuries caused 34%–40% of the deaths in the age group 15-39 years
across the three states groups. NCDs were the dominant cause of death in
those 40 years or older. The proportion of deaths in the different age groups
differed widely across the individual states of India: 3%–19% of total deaths
in the 0-14 years age group, 7%–16% in the 15-39 years age group, 35%–44% in
the 40-69 years age group, and 30%–52% in those 70 or more years old.
Table 3
Distribution of deaths from major disease groups by age in the state groups, 2016
Age group
Death rate per 100,000
[percent of total deaths in that age group]
Communicable, maternal,
neonatal, and nutritional
diseases
Non-communicable
diseases
Injuries
EAG states group
0-14 years 277 [82.4] 37 [10.9] 23 [6.7]
15-39 years 76 [34.4] 70 [31.6] 75 [34.0]
40-69 years 278 [21.9] 873 [68.9] 116 [9.2]]
70 plus years 2609 [29.5] 5799 [65.5] 444 [5.0]
All ages 268 [34.6] 426 [55.1] 79 [10.2]
North-East states
group
0-14 years 261 [83.0] 32 [10.3] 21 [6.7]
15-39 years 77 [33.8] 82 [35.8] 69 [30.3]
40-69 years 238 [19.7] 881 [73.0] 88 [7.3]
70 plus years 2466 [27.2] 6260 [69.2] 327 [3.6]
All ages 236 [32.1] 433 [58.8] 67 [9.1]
Other states
group
0-14 years 157.5 [77.2] 30 [14.6] 17 [8.2]
15-39 years 41.9 [23.1] 68 [37.2] 72 [39.8]
40-69 years 133.7 [13.1] 785 [77.2] 98 [9.7]
70 plus years 1304.2 [17.3] 5784 [76.9] 435 [5.8]
All ages 145.3 [20.2] 493 [68.5] 81 [11.3]
India
0-14 years 225.6 [80.8] 34 [12.0] 20 [7.2]
15-39 years 58.4 [29.1] 69 [34.4] 73 [36.5]
40-69 years 195.8 [17.4] 824 [73.2] 105 [9.4]
70 plus years 1867.0 [23.0] 5805 [71.6] 435 [5.4]
All ages 204.6 [27.5] 460 [61.8] 80 [10.7]](https://image.slidesharecdn.com/indiahealthofthenationsstatesreport2017-230818115250-fe055a08/85/India_Health_of_the_Nation-s_States_Report_2017-pdf-39-320.jpg)
![48 India: Health of the Nation’s States
Leading causes 1990 Leading causes 2016
Mean % change number
of DALYs 1990-2016
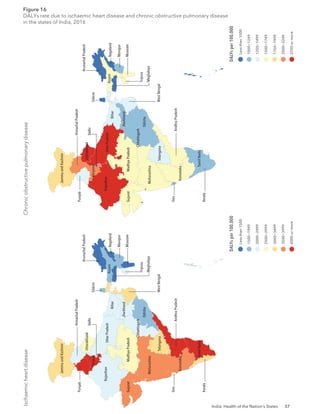
Ischaemic heart disease [8.7%] 104.1%
COPD [4.8%] 36.3%
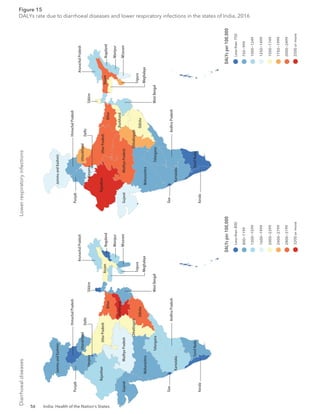
Diarrhoeal diseases [4.6%] -67.7%
Lower respiratory infect [4.3%] -61.5%
Stroke[3.5%] 52.9%
Iron-deficiency anemia [3.5%] 41.8%
Preterm birth complications [3.4%] -46.3%
Tuberculosis [3.2%] -44.5%
Sense organ diseases‡
[2.9%] 85.3%
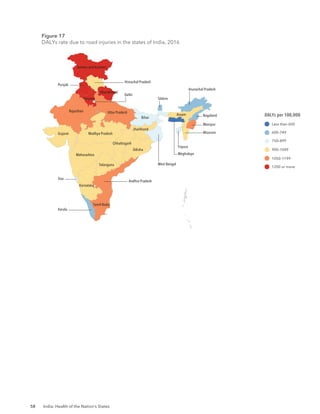
Road injuries [2.9%] 65.1%
Self-harm§
[2.5%] 29.8%
Low back & neck pain [2.3%] 66.1%
Diabetes [2.2%] 174.2%
Other neonatal disorders [2.1%] -49.7%
Migraine [2.1%] 69.1%
Skin diseases [1.9%] 55.0%
Falls [1.8%] 41.3%
Congenital defects [1.8%] -20.9%*
Other musculoskeletal [1.6%] 79.7%
Chronic kidney disease [1.6%] 71.0%
Depressive disorders [1.6%] 65.1%
Neonatal encephalopathy [1.5%] -56.1%
Asthma [1.3%] -15.1%*
Intestinal infectious diseases [1.2%] -37.1%
HIV/AIDS [1.1%] 1,004.6%
Anxiety disorders [0.9%] 61.9%
Meningitis [0.8%] -46.7%
Rheumatic heart disease [0.8%] 2.5%*
Protein-energy malnutrition [0.7%] -42.3%
Drowning [0.7%] -36.0%
Malaria [0.7%]
Neonatal sepsis [0.6%]
Measles [0.4%]
Neonatal haemolytic [0.3%]
Tetanus [0.1%]
*Change not significant
The percent figure in bracket next to each cause is DALYs
from that cause out of the total DALYs.
†
COPD is chronic obstructive pulmonary disease.
‡
Sense organ diseases includes mainly hearing and vision loss.
Communicable, maternal,
neonatal, and nutritional diseases
Non-communicable diseases Injuries
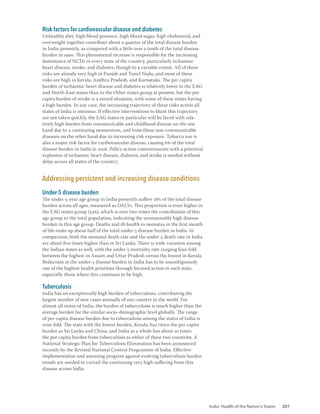
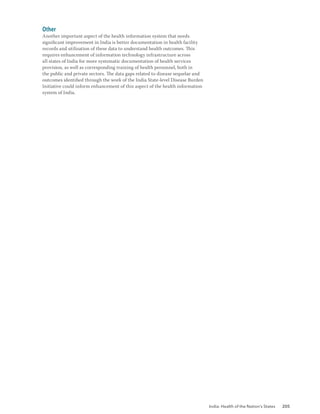
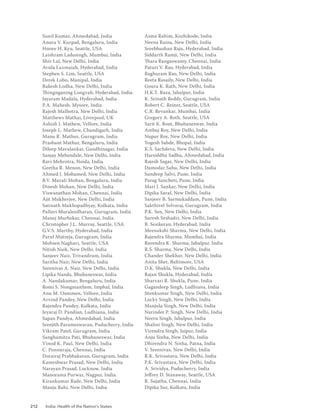
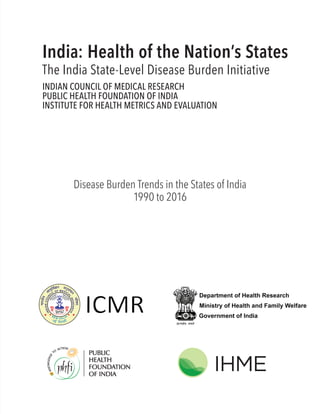
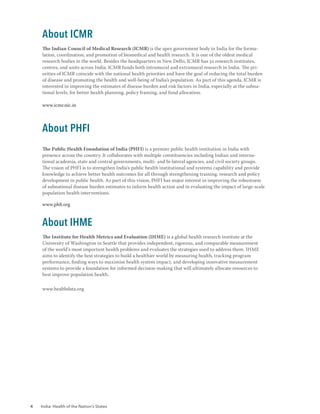
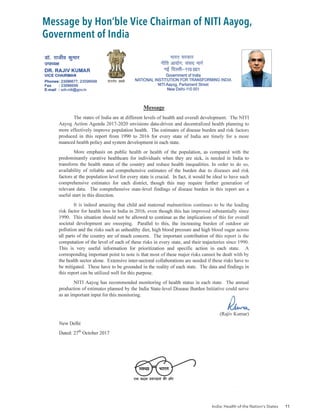
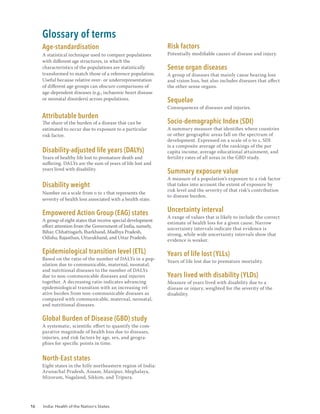
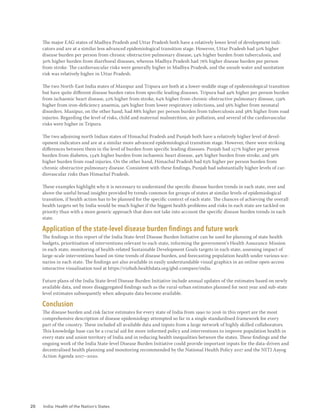
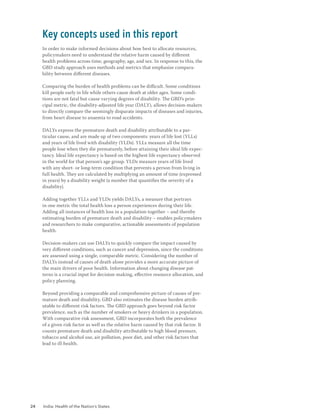
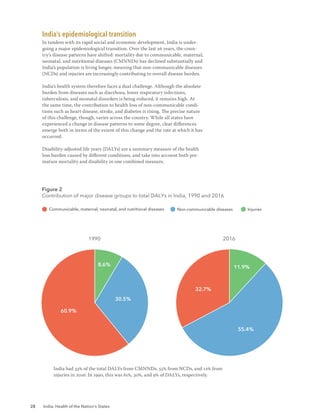
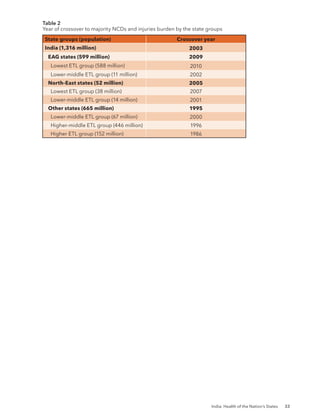
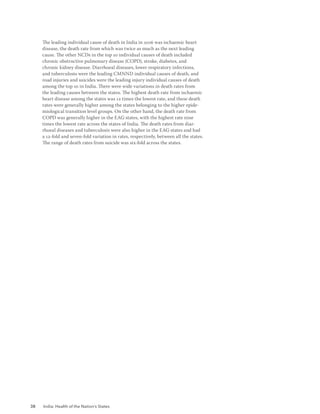
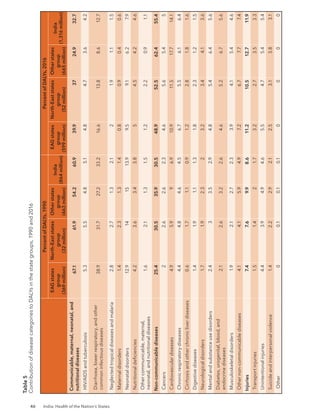
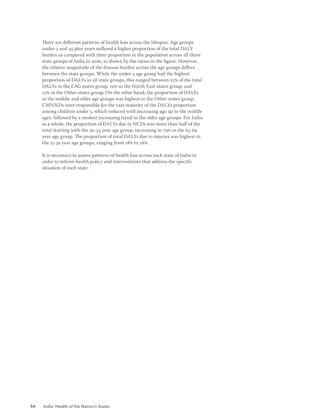
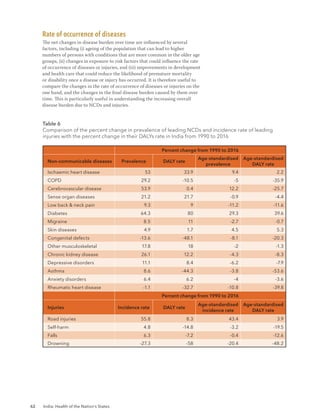
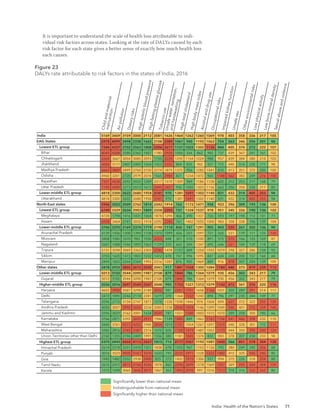
Figure 10
Change in DALYs number and rate for the leading individual causes in India from 1990 to 2016
same or increase decrease
Mean % change DALY
rate 1990-2016
33.9%
-10.5%*
-78.8%
-74.7%
0.4%*
-6.9%
-64.8%
-63.5%
21.7%
8.3%
-14.8%*
9.0%
80.0%
-67.0%
11.0%
1.7%*
-7.2%*
-48.1%
18.0%
12.2%
8.4%
-71.2%
-44.3%
-58.7%
625.0%
6.2%
-65.0%
-32.7%
-62.1%
-58.0%
§
Self-harm refers to suicide and the nonfatal outcomes of self-harm.
Diarrhoeal diseases [12.4%]
Lower respiratory infect [9.8%]
Preterm birth complications [5.5%]
Tuberculosis [5.0%]
Measles [4.2%]
Ischaemic heart disease [3.7%]
Other neonatal disorders [3.6%]
COPD†
[3.1%]
Neonatal encephalopathy [3.0%]
Iron-deficiency anemia [2.1%]
Congenital defects [2.0%]
Stroke [2.0%]
Tetanus [1.8%]
Self-harm§
[1.7%]
Intestinal infectious diseases [1.6%]
Road injuries [1.5%]
Sense organ diseases‡
[1.3%]
Meningitis [1.3%]
Asthma [1.3%]
Low back & neck pain [1.2%]
Falls [1.1%]
Protein-energy malnutrition [1.1%]
Skin diseases [1.1%]
Migraine [1.1%]
Malaria [1.1%]
Drowning [1.0%]
Neonatal haemolytic [0.9%]
Neonatal sepsis [0.9%]
Depressive disorders [0.9%]
Chronic kidney disease [0.8%]
Other musculoskeletal [0.8%]
Diabetes [0.7%]
Rheumatic heart disease [0.7%]
Anxiety disorders [0.5%]
HIV/AIDS [0.1%]
1
2
3
4
5
6
7
8
9
10
11
12
13
14
15
16
17
18
19
20
21
22
23
24
25
26
27
102
1
2
3
4
5
6
7
8
9
10
11
12
13
14
15
16
17
18
19
20
21
22
23
24
25
26
27
109
When looking at the leading individual causes of DALYs in India, most
NCDs have risen in rank since 1990. Ischaemic heart disease and COPD were
the top two causes of DALYs in 2016, up from sixth and eighth place, respec-
tively, in 1990. Diabetes showed a particularly dramatic increase, from 35th
place to 13th. The number of DALYs caused by ischaemic heart disease rose
by 104% over this period and those caused by diabetes a striking 174%. Large
increases in DALYs are evident for the majority of non-communicable condi-
tions, including sense organ diseases, low back and neck pain, and depressive
disorders. Injuries have seen similar rises in their relative ranking, with road
injuries the 10th leading individual cause of health loss in 2016, followed by
self-harm in 11th place. Road injuries caused 65% more DALYs in 2016 than
they did in 1990. These trends are indicative not just of a population that is
increasing in age and therefore living long enough to develop and suffer from
chronic diseases, but also of the impact of lifestyle changes that come with a
rapidly industrialising, urbanising society – from changes in diet and activity
levels to more traffic on the roads.
In contrast, the CMNNDs that led the rankings in 1990 have seen notable
declines. Diarrhoeal disease and lower respiratory infections, which were
India’s top two individual causes of DALYs in 1990, dropped to third and
fourth place in 2016. Other conditions, such as preterm birth complications,
tuberculosis, and vaccine-preventable diseases like measles, also saw a drop](https://image.slidesharecdn.com/indiahealthofthenationsstatesreport2017-230818115250-fe055a08/85/India_Health_of_the_Nation-s_States_Report_2017-pdf-52-320.jpg)
![50 India: Health of the Nation’s States
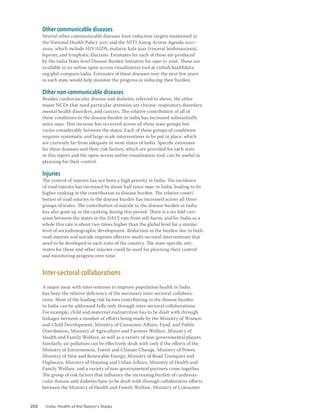
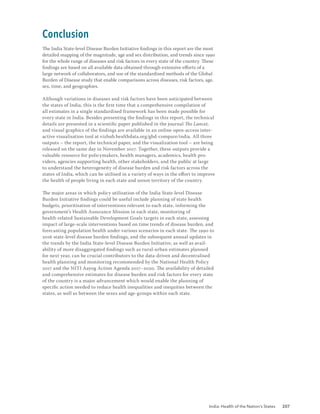
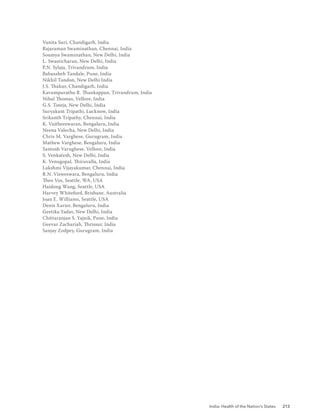
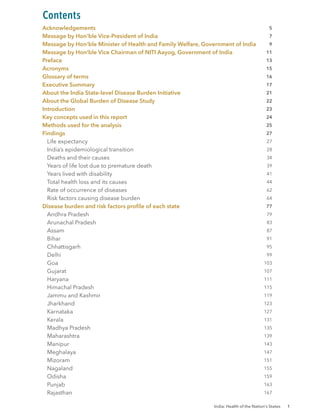
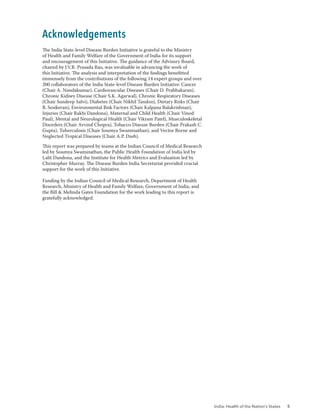
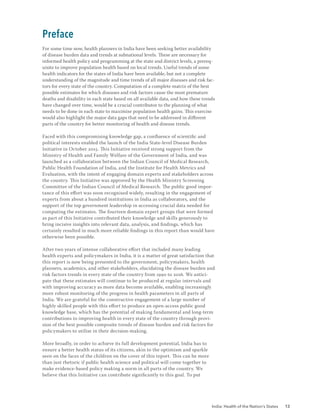
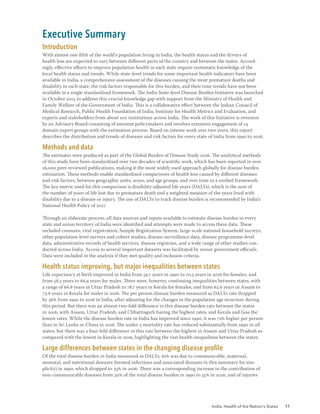
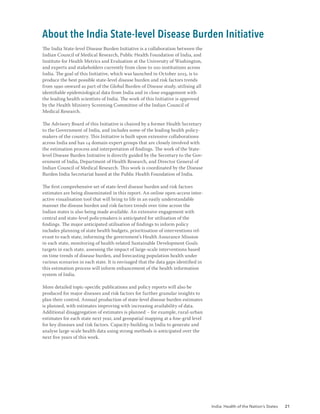
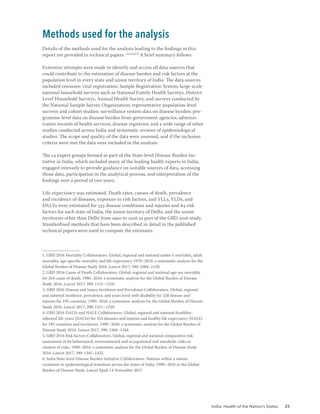
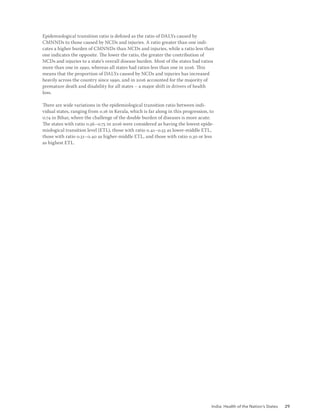
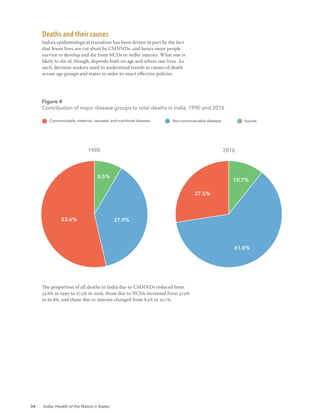
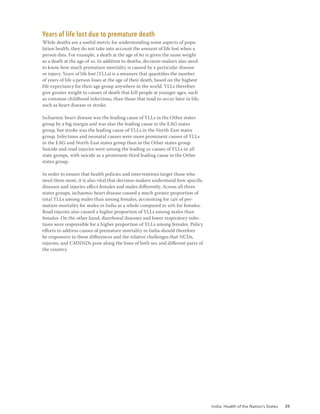
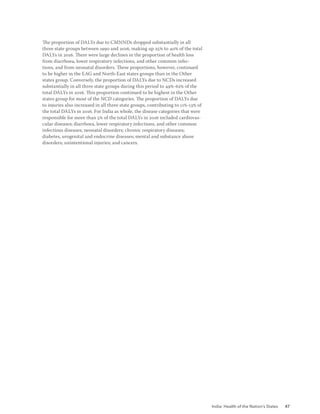
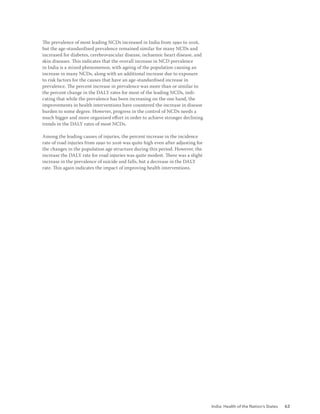
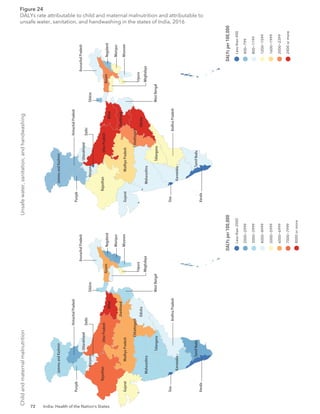
However, these trends have not been uniform throughout the country. The
relative rankings of causes of disease burden vary markedly among the three
state groups. CMNND causes have not been superseded by NCD causes
to the same extent everywhere in India, and generally ranked much higher
in the EAG and North-East states groups than they did in the Other states
group. Diarrhoeal diseases remained the leading cause of health loss in the
North-East states group and second in the EAG states group, with lower
respiratory infections in third place for both of these groups. In contrast,
these conditions were in ninth and eleventh place in the Other states group.
Moreover, the proportion of health loss caused by CMNNDs tended to be
greater in the EAG and North-East states groups than in the Other states
group, with the heaviest burden in the EAG states group.
Alongside variations between state groups, decision-makers should also be
aware of differences in the causes of health loss among females and males.
Figure 11
Comparison of the leading individual causes of DALYs across the state groups, 2016
Leading causes EAG states Leading causes North-East states Leading causes Other states
Diarrhoeal diseases [6.2%] Stroke [5.3%]
Lower respiratory infect [5.0%]
Lower respiratory infect [5.8%]
COPD* [5.0%] Ischaemic heart disease [4.3%]
Tuberculosis [3.9%] COPD* [4.0%]
Neonatal preterm birth [3.7%]
Tuberculosis [3.5%]
Neonatal preterm birth [3.7%]
Iron-deficiency anaemia [3.6%] Road injuries [3.0%]
Neonatal preterm birth [3.0%]
Diarrhoeal [3.0%]
Other neonatal [2.9%] Iron-deficiency anaemia [3.5%]
Stroke [2.8%] Sense organ diseases†
[2.5%]
Road injuries [2.7%] Road injuries [2.4%] Diabetes [2.8%]
Sense organ diseases†
[2.6%] Self-harmº [2.3%]
Other neonatal [2.2%]
Diabetes [2.0%]
Lower respiratory infect [2.8%]
Congenital defects [2.1%] Low back & neck pain [2.7%]
Low back & neck pain [1.9%] Tuberculosis [2.4%]
Skin diseases [1.8%] Migraine [2.0%] Migraine [2.3%]
Chronic kidney disease [2.1%]
Falls [2.0%]
Self-harmº [1.8%] Neonatal encephalopathy [1.9%]
Migraine [1.8%] Low back & neck pain [1.9%]
Falls [1.7%] Skin diseases [1.9%] Skin diseases [2.0%]
Diabetes [1.7%] Hepatitis [1.8%]
Chronic kidney disease [1.6%]
Other musculoskeletal [1.6%]
Congenital defects [1.6%]
Depressive disorders [2.0%]
Other musculoskeletal [1.9%]
Congenital defects [1.5%]
Neonatal encephalopathy [1.3%]
HIV/AIDS [1.2%]
Neonatal encephalopathy [1.7%] ]
Intestinal infectious [1.6%]
Other musculoskeletal [1.4%]
Asthma [1.4%] Depressive disorders [1.5%]
Malaria [1.3%]
Falls [1.2%]
Asthma [1.2%]
Depressive disorders [1.3%] Other neonatal [1.2%]
Chronic kidney disease [1.2%] Asthma [1.1%]
Protein-energy malnutrition [1.0%] Anxiety disorders [1.0%]
Malaria [1.0%] HIV/AIDS [1.1%] Oral disorders [0.8%]
Meningitis [0.9%] Drowning [1.1%] Rheumatic heart disease [0.8%]
Intestinal infectious [0.7%]
Meningitis [0.7%]
Hypertensive heart disease [0.7%]
HIV/AIDS [0.9%] Intestinal infectious [1.0%]
Animal contact [0.9%] Cirrhosis hepatitis B [0.9%]
Anxiety disorders [0.9%]
Rheumatic heart disease [0.9%]
Communicable, maternal,
neonatal, and nutritional diseases
Non-communicable diseases Injuries
*COPD is chronic obstructive pulmonary disease.
†
Sense organ diseases includes mainly hearing and vision loss.
ºSelf-harm refers to suicide and the nonfatal outcomes of self-harm.
The percent figure in bracket next to each cause is DALYs from that
cause out of the total DALYs.
Ischaemic heart disease [6.3%] Diarrhoeal diseases [5.3%] Ischaemic heart disease [11.5%]
COPD* [4.6%]
Stroke [4.1%]
Iron-deficiency anaemia [3.4%]
Sense organ diseases†
[3.3%]
Self-harmº [3.2%]
Rank
1
2
3
4
5
6
7
8
9
10
11
12
13
14
15
16
17
18
19
20
21
22
23
24
25
26
27
28
29
30](https://image.slidesharecdn.com/indiahealthofthenationsstatesreport2017-230818115250-fe055a08/85/India_Health_of_the_Nation-s_States_Report_2017-pdf-54-320.jpg)
![India: Health of the Nation’s States 51
Figure 12
Change in DALYs number for the leading individual causes by sex in India from 1990 to 2016
Leading
causes
2016
Ischaemic
heart
disease
[6.6%]
Diarrhoeal
diseases
[5.5%]
Iron-deficiency
anemia
[4.9%]
Lower
respiratory
infect
[4.7%]
COPD
†
[4.4%]
Stroke
[3.4%]
Preterm
birth
complications
[3.2%]
Sense
organ
diseases
‡
[3.2%]
Migraine
[2.7%]
Leading
causes
1990
Diarrhoeal
diseases
[14.8%]
Lower
respiratory
infect
[10.3%]
Preterm
birth
complications
[4.9%]
Measles
[4.2%]
Tuberculosis
[4.1%]
Other
neonatal
disorders
[3.2%]
Ischaemic
heart
disease
[2.9%]
Iron-deficiency
anemia
[2.8%]
COPD
†
[2.7%]
Neonatal
encephalopathy
[2.5%]
Congenital
defects
[1.9%]
Stroke
[1.9%]
Self-harm
§
[1.8%]
Intestinal
infectious
diseases
[1.6%]
Tetanus
[1.6%]
Low
back
&
neck
pain
[1.4%]
Sense
organ
diseases
‡
[1.4%]
Meningitis
[1.4%]
Migraine
[1.3%]
Protein-energy
malnutrition
[1.3%]
Asthma
[1.3%]
Malaria
[1.2%]
Skin
diseases
[1.2%]
Falls
[1.1%]
Maternal
hemorrhage
[1.0%]
Depressive
disorders
[1.0%]
Whooping
cough
[0.9%]
Neonatal
sepsis
[0.9%]
Other
musculoskeletal
[0.8%]
Encephalitis
[0.8%]
Rheumatic
heart
disease
[0.8%]
Road
injuries
[0.7%]
Chronic
kidney
disease
[0.7%]
Diabetes
[0.7%]
Anxiety
disorders
[0.6%]
Gynecological
diseases
[0.4%]
Breast
cancer
[0.3%]
Low
back
&
neck
pain
[2.7%]
Tuberculosis
[2.5%]
Self-harm
§
[2.4%]*
Diabetes
[2.2%]
Skin
diseases
[2.1%]
Other
neonatal
disorders
[2.1%]
Congenital
defects
[2.1%]*
Depressive
disorders
[2.0%]
Other
musculoskeletal
[1.9%]
Falls
[1.8%]
Chronic
kidney
disease
[1.4%]
Neonatal
encephalopathy
[1.4%]
Asthma
[1.4%]*
Road
injuries
[1.2%]
Intestinal
infectious
diseases
[1.1%]
Anxiety
disorders
[1.1%]
Rheumatic
heart
disease
[1.0%]*
Protein-energy
malnutrition
[0.9%]
Gynecological
diseases
[0.9%]
Breast
cancer
[0.9%]
Malaria
[0.9%]*
Meningitis
[0.8%]
HIV/AIDS
[0.8%]
Encephalitis
[0.7%]*
Neonatal
sepsis
[0.7%]*
Maternal
hemorrhage
[0.5%]
Measles
[0.4%]
Whooping
cough
[0.2%]*
Tetanus
[0.1%]
HIV/AIDS
[0.0%]
Leading
causes
2016
Ischaemic
heart
disease
[10.4%]
COPD
†
[5.2%]
Road
injuries
[4.3%]
Lower
respiratory
infect
[4.0%]
Diarrhoeal
diseases
[3.9%]
Tuberculosis
[3.8%]
Stroke
[3.6%]
Preterm
birth
complications
[3.5%]
Self-harm
§
[2.6%]
Sense
organ
diseases
‡
[2.6%]
Diabetes
[2.3%]
Iron-deficiency
anemia
[2.2%]
Other
neonatal
disorders
[2.0%]
Low
back
&
neck
pain
[1.9%]
Falls
[1.9%]
Chronic
kidney
disease
[1.8%]
Skin
diseases
[1.7%]
Congenital
defects
[1.6%]*
Neonatal
encephalopathy
[1.6%]
Migraine
[1.5%]
Other
musculoskeletal
[1.4%]
Depressive
disorders
[1.3%]
HIV/AIDS
[1.3%]
Intestinal
infectious
diseases
[1.2%]
Asthma
[1.2%]*
Drowning
[0.9%]
Alcohol
use
disorders
[0.9%]
Interpersonal
violence
[0.8%]
Meningitis
[0.8%]
Cirrhosis
hepatitis
B
[0.8%]
Animal
contact
[0.8%]*
Hepatitis
[0.7%]
Protein-energy
malnutrition
[0.6%]
Malaria
[0.6%]*
Neonatal
sepsis
[0.6%]
Neonatal
hemolytic
[0.3%]
Measles
[0.3%]
Tetanus
[0.1%]
Leading
causes
1990
Diarrhoeal
diseases
[10.1%]
Lower
respiratory
infect
[9.4%]
Preterm
birth
complications
[6.0%]
Tuberculosis
[5.8%]
Ischaemic
heart
disease
[4.4%]
Measles
[4.2%]
Other
neonatal
disorders
[4.0%]
COPD
†
[3.4%]
Neonatal
encephalopathy
[3.4%]
Road
injuries
[2.2%]
Congenital
defects
[2.1%]
Stroke
[2.1%]
Tetanus
[2.0%]
Intestinal
infectious
diseases
[1.7%]
Self-harm
§
[1.6%]
Iron-deficiency
anemia
[1.5%]
Asthma
[1.4%]
Meningitis
[1.3%]
Sense
organ
diseases
‡
[1.3%]
Drowning
[1.3%]
Falls
[1.2%]
Neonatal
hemolytic
[1.1%]
Skin
diseases
[1.0%]
Protein-energy
malnutrition
[1.0%]
Chronic
kidney
disease
[1.0%]
Low
back
&
neck
pain
[0.9%]
Malaria
[0.9%]
Neonatal
sepsis
[0.9%]
Animal
contact
[0.8%]
Hepatitis
[0.8%]
Migraine
[0.8%]
Other
musculoskeletal
[0.7%]
Diabetes
[0.7%]
Depressive
disorders
[0.7%]
Interpersonal
violence
[0.6%]
Alcohol
use
disorders
[0.5%]
Cirrhosis
hepatitis
B
[0.4%]
HIV/AIDS
[0.1%]
Females
Males
1
2
3
4
5
6
7
8
9
1
2
3
4
5
6
7
8
9
10
11
12
13
14
15
16
17
18
19
20
21
22
23
24
25
26
27
28
29
30
34
36
52
10
11
12
13
14
15
16
17
18
19
20
21
22
23
24
25
26
27
28
29
30
31
32
34
35
48
54
81
112
111
31
35
40
45
1
2
3
4
5
6
7
8
9
1
2
3
4
5
6
7
8
9
10
11
12
13
14
15
16
17
18
19
20
21
22
23
24
25
26
27
28
29
30
33
36
48
10
11
12
13
14
15
16
17
18
19
20
21
22
23
24
25
26
27
28
29
30
31
33
37
47
48
61
62
90
100
31
34
39
42
Communicable,
maternal,
neonatal,
and
nutritional
diseases
Non-communicable
diseases
Injuries
same
or
increase
decrease
*
Change
not
significant.
†
COPD
is
chronic
obstructive
pulmonary
disease.
‡
Sense
organ
diseases
includes
mainly
hearing
and
vision
loss.
The
percent
figure
in
bracket
next
to
each
cause
is
DALYs
from
that
cause
out
of
the
total
DALYs.
Change in number of DALYs and percent change in rate for the leading individual causes from 1990 to 2016
among males and females, India
§
Self-harm
refers
to
suicide
and
the
nonfatal
outcomes
of
self-harm.](https://image.slidesharecdn.com/indiahealthofthenationsstatesreport2017-230818115250-fe055a08/85/India_Health_of_the_Nation-s_States_Report_2017-pdf-55-320.jpg)
![India: Health of the Nation’s States 53
Figure 13
Percent of DALYs by age in the state groups, 2016
EAG states
North-East states
Other states
The number in the bracket on top of each vertical bar is the ratio of percent DALYs to population for that age group.
The number in parentheses after each age group on the x-axis is the percent of population in that age group.
Communicable, maternal, neonatal, and nutritional diseases
Percent
of
total
DALYs
Non-communicable diseases Injuries
U
n
d
e
r
5
(
1
0
.
2
%
)
5
t
o
9
(
1
1
.
3
%
)
1
0
t
o
1
4
(
1
1
%
)
1
5
t
o
1
9
(
1
0
.
1
%
)
2
0
t
o
2
4
(
8
.
8
%
)
2
5
t
o
2
9
(
8
%
)
3
0
t
o
3
4
(
7
.
5
%
)
3
5
t
o
3
9
(
6
.
5
%
)
4
0
t
o
4
4
(
5
.
7
%
)
4
5
t
o
4
9
(
4
.
8
%
)
5
0
t
o
5
4
(
4
.
2
%
)
5
5
t
o
5
9
(
3
.
6
%
)
6
0
t
o
6
4
(
3
.
1
%
)
6
5
t
o
6
9
(
2
.
1
%
)
7
0
t
o
7
4
(
1
.
4
%
)
7
5
t
o
7
9
(
0
.
9
%
)
8
0
t
o
8
4
(
0
.
5
%
)
8
5
+
(
0
.
3
%
)
Percent
of
total
DALYs
U
n
d
e
r
5
(
8
.
5
%
)
5
t
o
9
(
1
0
.
4
%
)
1
0
t
o
1
4
(
1
0
.
2
%
)
1
5
t
o
1
9
(
9
.
8
%
)
2
0
t
o
2
4
(
9
.
4
%
)
2
5
t
o
2
9
(
9
.
4
%
)
3
0
t
o
3
4
(
8
.
3
%
)
3
5
t
o
3
9
(
7
.
3
%
)
4
0
t
o
4
4
(
6
.
2
%
)
4
5
t
o
4
9
(
5
.
4
%
)
5
0
t
o
5
4
(
4
.
5
%
)
5
5
t
o
5
9
(
3
.
5
%
)
6
0
t
o
6
4
(
2
.
6
%
)
6
5
t
o
6
9
(
1
.
7
%
)
7
0
t
o
7
4
(
1
.
2
%
)
7
5
t
o
7
9
(
0
.
9
%
)
8
0
t
o
8
4
(
0
.
5
%
)
8
5
+
(
0
.
2
%
)
Percent
of
total
DALYs
Age
U
n
d
e
r
5
(
7
%
)
5
t
o
9
(
8
%
)
1
0
t
o
1
4
(
8
.
4
%
)
1
5
t
o
1
9
(
8
.
8
%
)
2
0
t
o
2
4
(
9
.
3
%
)
2
5
t
o
2
9
(
9
.
2
%
)
3
0
t
o
3
4
(
8
.
5
%
)
3
5
t
o
3
9
(
7
.
6
%
)
4
0
t
o
4
4
(
6
.
8
%
)
4
5
t
o
4
9
(
6
.
1
%
)
5
0
t
o
5
4
(
5
.
5
%
)
5
5
t
o
5
9
(
4
.
6
%
)
6
0
t
o
6
4
(
3
.
6
%
)
6
5
t
o
6
9
(
2
.
6
%
)
7
0
t
o
7
4
(
1
.
7
%
)
7
5
t
o
7
9
(
1
.
2
%
)
8
0
t
o
8
4
(
0
.
6
%
)
8
5
+
(
0
.
4
%
)
5
0
10
15
20
25
[0.33] [0.32]
[0.45] [0.55] [0.6] [0.67] [0.79] [0.9] [1.11] [1.35]
[1.68]
[2.13]
[2.64]
[3.26]
[3.51]
[4.35]
[4.11]
[2.26]
5
0
10
15
20
25
[0.33] [0.32]
[0.47]
[0.57]
[0.62] [0.69] [0.82] [0.94]
[1.16] [1.45] [1.79]
[2.21]
[2.82]
[3.32]
[3.58]
[4.46]
[5.7]
[2.31]
5
0
10
15
20
25
[0.3] [0.31]
[0.46]
[0.55]
[0.6] [0.68] [0.8] [0.92]
[1.11]
[1.35] [1.69] [2.12]
[2.59]
[3.19]
[3.53]
[4.46]
[4.37]
[1.68]](https://image.slidesharecdn.com/indiahealthofthenationsstatesreport2017-230818115250-fe055a08/85/India_Health_of_the_Nation-s_States_Report_2017-pdf-57-320.jpg)
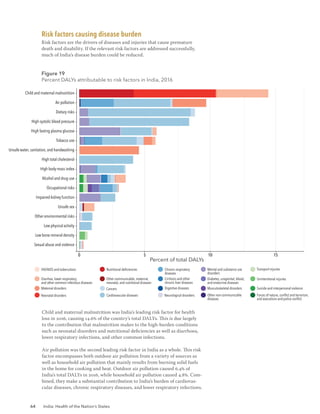
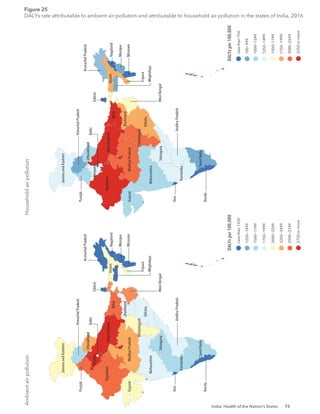
![India: Health of the Nation’s States 65
The behavioural and metabolic risk factors associated with the rising burden
of NCDs have become quite prominent in India. Dietary risks, which include
diets low in fruit, vegetables, and whole grains, but high in salt and fat, were
India’s third leading risk factor, followed closely by high blood pressure and
high blood sugar (high fasting plasma glucose). These risks drive health
loss mainly from cardiovascular disease and diabetes, and also from cancer
in the case of dietary risks. Despite the increasing global awareness of the
health risks it poses, tobacco use, including smoking, secondhand smoke,
and smokeless tobacco, remains a major risk factor in India and caused 5.9%
of the total DALYs in 2016.
Unsafe water, sanitation, and handwashing was the second leading risk
factor in 1990, but its ranking dropped to seventh in 2016. However, it is even
now responsible for 4.6% of the disease burden through diarrhoeal diseases
and other infections.
In line with India’s epidemiological transition, the composition of risk
factors that drives its disease burden has also changed over time. This is a
process linked to socioeconomic development. While the burden of poor
health attributable to risks such as malnutrition and unsafe water, sanitation,
and handwashing has fallen since 1990, it still remains quite high. At the
same time, the burden caused by risks such as unhealthy diets, high blood
pressure, high blood sugar, high cholesterol, and high body mass index is on
the rise.
The large increases in DALYs caused by metabolic risks such as high blood
pressure, high blood sugar, and high body mass index, alongside behavioural
ones such as dietary risks, warrant serious attention from policymakers.
These trends indicate that strong strategies will need to be implemented to
curb their trajectory, in order to prevent and control NCDs in India. Tackling
environmental risk factors, such as outdoor air pollution, will also be an
important part of this effort. While the total burden from air pollution in
India declined between 1990 and 2016, this was largely driven by efforts to
reduce the use of solid fuels in households. Outdoor air pollution continues
to pose a significant and growing challenge to population health.
Malnutrition [14.6%] -64.3% -76.6%
Air pollution [9.8%] -23.6% -49.9%
70.8% 12.1%
89.3% 24.2%
127.9% 49.6%
14.7% -24.7%
-69.0% -79.6%
106.2% 35.3%
281.6% 150.5%
80.6% 18.5%
32.4% -13.1%
76.4% 15.8%
214.4% 106.4%
63.4% 7.2%
109.6% 37.6%
127.4% 49.3%
Dietary risks [8.9%]
High blood pressure [8.5%]
High fasting plasma glucose [6.0%]
[5.9%]
WaSH* [4.6%]
High total cholesterol [4.1%]
High body mass index [3.6%]
Alcohol & drug use [3.6%]
Occupational risks [3.0%]
Impaired kidney function [2.8%]
Unsafe sex [1.1%]
Other environmental [1.0%]
Low physical activity [0.9%]
Low bone mineral density [0.6%]
Sexual abuse & violence [0.3%] 48.0% -2.9%
Tobacco use
Malnutrition [35.5%]
WaSH* [12.8%]
Air pollution [11.1%]
Dietary risks [4.5%]
Tobacco use [4.4%]
High blood pressure [3.9%]
High fasting plasma glucose [2.3%]
Occupational risks [2.0%]
High total cholesterol [1.7%]
Alcohol & drug use [1.7%]
Impaired kidney function [1.4%]
High body mass index [0.8%]
Other environmental [0.5%]
Low physical activity [0.4%]
Unsafe sex [0.3%]
Low bone mineral density [0.2%]
Sexual abuse & violence [0.2%]
1
2
3
4
5
6
7
8
9
10
11
12
13
14
15
1
2
3
4
5
6
7
8
9
10
11
12
13
14
15
16
17
16
17
Leading causes 1990
Figure 20
Change in DALYs number and rate attributable to risk factors in India from 1990 to 2016
Leading causes 2016
The percent figure in bracket next to each risk factor is DALYs attributable to that risk factor out of the total DALYs.
Behavioural risks Environmental/occupational risks Metabolic risks
* WaSH is unsafe water, sanitation, and handwashing.
Mean % change number
of DALYs 1990-2016
Mean % change
DALY rate 1990-2016
Figure 20
Change in DALYs number and rate attributable to risk factors in India from 1990 to 2016](https://image.slidesharecdn.com/indiahealthofthenationsstatesreport2017-230818115250-fe055a08/85/India_Health_of_the_Nation-s_States_Report_2017-pdf-69-320.jpg)


![79
39.2
33.7
33.4
0
50
100
150
1990 1995 2000 2005 2010 2016
Year
Deaths
per
1,000
live
births
Andhra Pradesh under-5 rate India under-5 rate Comparative average rate globally for similar
Socio-demographic Index as Andhra Pradesh
How much did the under-5 mortality rate change from 1990 to 2016?
Under-5 mortality rate, both sexes combined, 1990-2016
2016 life expectancy
Females: 71.9 years Males: 67.3 years
1990 life expectancy
Females: 58.4 years Males: 57.7 years
Andhra Pradesh
1.5%
29.1%
2.5%
42.1%
1.2%
2.1%
1%
9.6%
1.2%
5.8%
3.8%
0−14 years [7.6% of total deaths]
2.5%
3.2%
3.7%
9.9%
8.5%
5.8%
14.9%
11.3%
9.2%
19.9%
11%
15−39 years [11.7% of total deaths]
4.6%
7.7%
11.7%
40%
9.8%
3.1%
7%
2.9%
4.6%
2.8%
5.7%
40−69 years [43.7% of total deaths]
2%
17.7%
6.5%
36.8%
14.1%
1%
1.4%
4.4%
8%
5.2%
2.9%
70+ years [37% of total deaths]
HIV/AIDS & tuberculosis
Diarrhoea/LRI*/other
NTDs†
& malaria
Maternal disorders
Neonatal disorders
Nutritional deficiencies
Other communicable diseases
Cancers
Cardiovascular diseases
Chronic respiratory diseases
Cirrhosis
Digestive diseases
Neurological disorders
Diabetes/urog‡
/blood/endo§
Other non-communicable
Transport injuries
Unintentional injuries
Suicide & violence
Other causes of death
*LRI is lower respiratory infections.
†
NTDs are neglected tropical diseases.
‡
Urog is urogenital diseases.
§
Endo is endocrine diseases.
What caused the most deaths in different age groups in 2016?
Percent contribution of top 10 causes of death by age group, both sexes, 2016
How much did the under-5 mortality rate change from 1990 to 2016?
Under-5 mortality rate, both sexes combined, 1990-2016
What caused the most deaths in different age groups in 2016?
Percent contribution of top 10 causes of death by age group, both sexes, 2016
Andhra Pradesh](https://image.slidesharecdn.com/indiahealthofthenationsstatesreport2017-230818115250-fe055a08/85/India_Health_of_the_Nation-s_States_Report_2017-pdf-83-320.jpg)
![81
Andhra Pradesh
Ischaemic heart disease [11.6%]
COPD†
[4.6%]
Iron-deficiency anaemia [3.7%]
Diarrhoeal diseases [3.7%]
Self-harm§
[3.6%]*
Stroke [3.5%]*
Preterm birth complications [3.3%]
Road injuries [3.1%]
Sense organ diseases‡
[3.1%]
Lower respiratory infections [2.7%]
Low back & neck pain [2.5%]
Diabetes [2.4%]
Depressive disorders [2.3%]
Migraine [2.2%]
Falls [2.2%]*
Tuberculosis [1.8%]
Congenital birth defects [1.6%]
Neonatal encephalopathy [1.6%]
Intestinal infectious diseases [1.0%]
Other neonatal disorders [0.9%]
Neonatal haemolytic disease [0.4%]
Measles [0.2%]
Diarrhoeal diseases [16.4%]
Lower respiratory infections [8.1%]
Preterm birth complications [6.6%]
Ischaemic heart disease [4.4%]
Tuberculosis [4.1%]
Measles [3.8%]
Neonatal encephalopathy [3.7%]
COPD†
[2.4%]
Congenital birth defects [2.4%]
Self-harm§
[2.3%]
Iron-deficiency anaemia [2.2%]
Other neonatal disorders [2.2%]
Stroke [2.0%]
Neonatal haemolytic disease [1.6%]
Intestinal infectious diseases [1.5%]
Road injuries [1.5%]
Sense organ diseases‡
[1.3%]
Low back & neck pain [1.2%]
Falls [1.2%]
Depressive disorders [1.1%]
Migraine [1.1%]
Diabetes [0.7%]
1
2
3
4
5
6
7
8
9
10
11
12
13
14
15
1
2
3
4
5
6
7
8
9
10
11
12
13
14
15
18
22
24
27
49
82
20
19
20
22
23
34
16
18
Leading causes of DALYs 1990
How have the leading causes of death and disability combined changed from 1990 to 2016?
Change in top 15 causes of DALYs, both sexes, ranked by number of DALYs, 1990–2016
Leading causes of DALYs 2016
Communicable, maternal,
neonatal, and nutritional diseases
Non-communicable diseases Injuries same or increase decrease
*Change not significant.
The percent figure in brackets next to each cause is
DALYs from that cause out of total DALYs.
†
COPD is chronic obstructive pulmonary disease.
‡
Sense organ diseases includes mainly hearing and vision loss.
§
Self-harm refers to suicide and the nonfatal outcomes of self-harm.
The number in the bracket on top of each vertical bar is the ratio of percent DALYs to population for that age group.
The number in parentheses after each age group on the x-axis is the percent of population in that age group.
Communicable, maternal, neonatal, and nutritional diseases
Percent
of
total
DALYs
Age
Non-communicable diseases Injuries
U
n
d
e
r
5
(
7
%
)
5
t
o
9
(
8
%
)
1
0
t
o
1
4
(
8
%
)
1
5
t
o
1
9
(
9
%
)
2
0
t
o
2
4
(
9
%
)
2
5
t
o
2
9
(
9
%
)
3
0
t
o
3
4
(
9
%
)
3
5
t
o
3
9
(
8
%
)
4
0
t
o
4
4
(
7
%
)
4
5
t
o
4
9
(
6
%
)
5
0
t
o
5
4
(
5
%
)
5
5
t
o
5
9
(
4
%
)
6
0
t
o
6
4
(
4
%
)
6
5
t
o
6
9
(
3
%
)
7
0
t
o
7
4
(
2
%
)
7
5
t
o
7
9
(
1
%
)
8
0
t
o
8
4
(
1
%
)
8
5
+
(
<
1
%
)
What caused the most death and disability combined across age groups in 2016?
Percent of DALYs by age group, both sexes, 2016
5
0
10
[0.3]
[0.31]
[0.46]
[0.55]
[0.61] [0.68]
[0.8] [0.92]
[1.1]
[1.36] [1.66]
[2.07]
[2.59]
[3.11]
[3.55]
[4.04]
[4.51]
[1.75]
How have the leading causes of death and disability combined changed from 1990 to 2016?
Change in top 15 causes of DALYs, both sexes, ranked by number of DALYs, 1990–2016
What caused the most death and disability combined across age groups in 2016?
Percent of DALYs by age group, both sexes, 2016
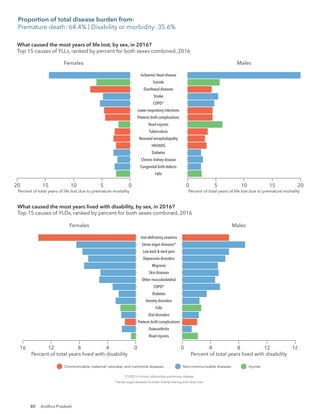
Proportion of total disease burden from:
CMNNDs: 27.0% | NCDs: 59.7% | Injuries: 13.3%](https://image.slidesharecdn.com/indiahealthofthenationsstatesreport2017-230818115250-fe055a08/85/India_Health_of_the_Nation-s_States_Report_2017-pdf-85-320.jpg)
![82
Risk factors 1990 Risk factors 2016
The percent figure in bracket next to each risk is DALYs from that risk out of total DALYs. *Malnutrition is child and maternal malnutrition.
†
WaSH is unsafe water, sanitation, and handwashing.
What risk factors are driving the most death and disability combined?
Contribution of top 10 risks to DALYs number, both sexes, ranked by number of DALYs,
same or increase decrease
Behavioural Environmental/occupational Metabolic
Malnutrition* [36.9%]
WaSH†
[16.4%]
Air pollution [9.5%]
Dietary risks [5.1%]
High blood pressure [4.4%]
Tobacco use [4.2%]
High total cholesterol [2.3%]
High fasting plasma glucose [2.2%]
Occupational risks [1.9%]
High body-mass index [0.6%]
Alcohol & drug use [1.4%]
Malnutrition* [11.7%]
Dietary risks [11.5%]
High blood pressure [10.5%]
Air pollution [8.7%]
High fasting plasma glucose [6.4%]
Tobacco use [6.0%]
High total cholesterol [5.9%]
High body-mass index [5.4%]
WaSH†
[3.6%]
Alcohol & drug use [3.3%]
Occupational risks [3.2%]
1
2
3
4
5
6
7
8
9
10
13
1
2
3
4
5
6
7
8
9
10
11
Risk factors 1990 Risk factors 2016
The percent figure in bracket next to each risk is DALYs from that risk out of total DALYs. *Malnutrition is child and maternal malnutrition.
†
WaSH is unsafe water, sanitation, and handwashing.
What risk factors are driving the most death and disability combined?
Contribution of top 10 risks to DALYs number, both sexes, ranked by number of DALYs, 1990-2016
same or increase decrease
Behavioural Environmental/occupational Metabolic
Malnutrition* [36.9%]
WaSH†
[16.4%]
Air pollution [9.5%]
Dietary risks [5.1%]
High blood pressure [4.4%]
Tobacco use [4.2%]
High total cholesterol [2.3%]
High fasting plasma glucose [2.2%]
Occupational risks [1.9%]
High body-mass index [0.6%]
Alcohol & drug use [1.4%]
Malnutrition* [11.7%]
Dietary risks [11.5%]
High blood pressure [10.5%]
Air pollution [8.7%]
High fasting plasma glucose [6.4%]
Tobacco use [6.0%]
High total cholesterol [5.9%]
High body-mass index [5.4%]
WaSH†
[3.6%]
Alcohol & drug use [3.3%]
Occupational risks [3.2%]
1
2
3
4
5
6
7
8
9
10
13
1
2
3
4
5
6
7
8
9
10
11
Females
12 8 4 0 0 4 8 12
Alcohol & drug use
WaSH†
High body-mass index
High total cholesterol
Tobacco use
High fasting plasma glucose
Air pollution
High blood pressure
Dietary risks
Malnutrition*
Males
Percent of years of life lost and years lived with disability Percent of years of life lost and years lived with disability
How did the risk factors differ by sex in 2016?
Percent of total DALYs attributable to top 10 risks, ranked by percent for both sexes combined, 2016
Behavioural Environmental/occupational Metabolic
*Malnutrition is child and maternal malnutrition.
†
WaSH is unsafe water, sanitation, and handwashing.
What risk factors are driving the most death and disability combined?
Contribution of top 10 risks to DALYs number, both sexes, ranked by number of DALYs, 1990-2016
Andhra Pradesh](https://image.slidesharecdn.com/indiahealthofthenationsstatesreport2017-230818115250-fe055a08/85/India_Health_of_the_Nation-s_States_Report_2017-pdf-86-320.jpg)
![83
0
50
100
150
1990 1995 2000 2005 2010 2016
Year
Deaths
per
1,000
live
births
Arunachal Pradesh under-5 rate India under-5 rate Comparative average rate globally for similar
Socio-demographic Index as Arunachal Pradesh
39.2
30.6
32.5
How much did the under-5 mortality rate change from 1990 to 2016?
Under-5 mortality rate, both sexes combined, 1990-2016
2016 life expectancy
Females: 72.7 years Males: 68.2 years
1990 life expectancy
Females: 60.8 years Males: 59.4 years
Arunachal Pradesh
1.8%
35.1%
4.2%
34%
1.3%
4.2%
1.6%
6.6%
1.3%
5.3%
4.6%
14.9%
7.9%
4.6%
7.6%
7.6%
8.5% 4.4%
8.7%
7.1%
16.3%
12.4%
8.7%
7.7%
21.8%
20.5%
6.6%
9.7%
3.1%
7%
3.5%
2.9%
8.4%
4.9%
21.5%
10.7%
24.4%
11.1%
2.7%
2.6%
5.2%
9.1%
4.1%
3.7%
0−14 years [14.4% of total deaths] 15−39 years [16.4% of total deaths]
40−69 years [39.5% of total deaths] 70+ years [29.7% of total deaths]
What caused the most deaths in different age groups in 2016?
Percent contribution of top 10 causes of death by age group, both sexes, 2016
HIV/AIDS & tuberculosis
Diarrhoea/LRI*/other
NTDs†
& malaria
Maternal disorders
Neonatal disorders
Nutritional deficiencies
Other communicable diseases
Cancers
Cardiovascular diseases
Chronic respiratory diseases
Cirrhosis
Digestive diseases
Neurological disorders
Diabetes/urog‡
/blood/endo§
Other non-communicable
Transport injuries
Unintentional injuries
Suicide & violence
Other causes of death
*LRI is lower respiratory infections.
†
NTDs are neglected tropical diseases.
‡
Urog is urogenital diseases.
§
Endo is endocrine diseases.
How much did the under-5 mortality rate change from 1990 to 2016?
Under-5 mortality rate, both sexes combined, 1990-2016
What caused the most deaths in different age groups in 2016?
Percent contribution of top 10 causes of death by age group, both sexes, 2016
Arunachal Pradesh](https://image.slidesharecdn.com/indiahealthofthenationsstatesreport2017-230818115250-fe055a08/85/India_Health_of_the_Nation-s_States_Report_2017-pdf-87-320.jpg)
![85
Arunachal Pradesh
Diarrhoeal diseases [15.3%]
Lower respiratory infections [9.2%]
Malaria [6.8%]
Tuberculosis [5.8%]
Measles [4.0%]
Preterm birth complications [3.7%]
Hepatitis [2.8%]
Other neonatal disorders [2.6%]
Neonatal encephalopathy [2.2%]
Iron-deficiency anaemia [1.6%]
Self-harm§
[1.5%]
COPD†
[1.5%]
Meningitis [1.5%]
Ischaemic heart disease [1.4%]
Road injuries [1.4%]
Stroke [1.4%]
Sense organ diseases‡
[1.3%]
Low back & neck pain [1.2%]
Skin diseases [1.2%]
Migraine [1.1%]
Depressive disorders [1.0%]
Lower respiratory infections [4.3%]
Diarrhoeal diseases [4.3%]
Preterm birth complications [3.7%]*
Ischaemic heart disease [3.4%]
Tuberculosis [3.2%]
Iron-deficiency anaemia [3.2%]
[2.9%]
COPD†
[2.8%]
Sense organ diseases‡
[2.7%]
Stroke [2.6%]
Road injuries [2.6%]
Skin diseases [2.5%]
Migraine [2.5%]
Low back & neck pain [2.4%]
Depressive disorders [2.2%]
Other neonatal disorders [1.9%]*
Hepatitis [1.9%]
Neonatal encephalopathy [1.6%]*
Malaria [1.0%]
Meningitis [0.8%]*
Measles [0.4%]
Self-harm§
1
2
3
4
5
6
7
8
9
10
11
12
13
14
15
1
2
3
4
5
6
7
8
9
10
11
12
13
14
15
17
23
29
36
54
18
19
20
23
26
16
17
Leading causes of DALYs 1990
How have the leading causes of death and disability combined changed from 1990 to 2016?
Change in top 15 causes of DALYs, both sexes, ranked by number of DALYs, 1990–2016
Leading causes of DALYs 2016
Communicable, maternal,
neonatal, and nutritional diseases
Non-communicable diseases Injuries same or increase decrease
*Change not significant.
The percent figure in brackets next to each cause is
DALYs from that cause out of total DALYs.
†
COPD is chronic obstructive pulmonary disease.
‡
Sense organ diseases includes mainly hearing and vision loss.
§
Self-harm refers to suicide and the nonfatal outcomes of self-harm.
The number in the bracket on top of each vertical bar is the ratio of percent DALYs to population for that age group.
The number in parentheses after each age group on the x-axis is the percent of population in that age group.
Communicable, maternal, neonatal, and nutritional diseases
Percent
of
total
DALYs
Age
Non-communicable diseases Injuries
U
n
d
e
r
5
(
1
0
%
)
5
t
o
9
(
1
1
%
)
1
0
t
o
1
4
(
1
2
%
)
1
5
t
o
1
9
(
1
1
%
)
2
0
t
o
2
4
(
9
%
)
2
5
t
o
2
9
(
9
%
)
3
0
t
o
3
4
(
8
%
)
3
5
t
o
3
9
(
7
%
)
4
0
t
o
4
4
(
6
%
)
4
5
t
o
4
9
(
5
%
)
5
0
t
o
5
4
(
4
%
)
5
5
t
o
5
9
(
3
%
)
6
0
t
o
6
4
(
2
%
)
6
5
t
o
6
9
(
1
%
)
7
0
t
o
7
4
(
1
%
)
7
5
t
o
7
9
(
1
%
)
8
0
t
o
8
4
(
<
1
%
)
8
5
+
(
<
1
%
)
What caused the most death and disability combined across age groups in 2016?
Percent of DALYs by age group, both sexes, 2016
5
0
10
15
20
[0.35]
[2.01]
[0.36]
[0.52] [0.65]
[0.72] [0.81] [0.94]
[1.09] [1.32] [1.63]
[2.04]
[2.49]
[3.11]
[3.73]
[4.27]
[4.94]
[5.52]
How have the leading causes of death and disability combined changed from 1990 to 2016?
Change in top 15 causes of DALYs, both sexes, ranked by number of DALYs, 1990–2016
What caused the most death and disability combined across age groups in 2016?
Percent of DALYs by age group, both sexes, 2016
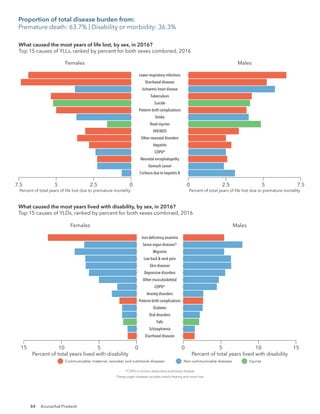
Proportion of total disease burden from:
CMNNDs: 35.5% | NCDs: 52.9% | Injuries: 11.6%](https://image.slidesharecdn.com/indiahealthofthenationsstatesreport2017-230818115250-fe055a08/85/India_Health_of_the_Nation-s_States_Report_2017-pdf-89-320.jpg)
![86 Arunachal Pradesh
Risk factors 1990 Risk factors 2016
The percent figure in bracket next to each risk is DALYs from that risk out of total DALYs. *Malnutrition is child and maternal malnutrition.
†
WaSH is unsafe water, sanitation, and handwashing.
What risk factors are driving the most death and disability combined?
Contribution of top 10 risks to DALYs number, both sexes, ranked by number of DALYs, 19
same or increase decrease
Behavioural Environmental/occupational Metabolic
Malnutrition* [32.2%]
WaSH†
[15.2%]
Air pollution [7.7%]
Tobacco use [3.6%]
Dietary risks [2.3%]
High blood pressure [2.2%]
Occupational risks [1.9%]
Alcohol & drug use [1.6%]
High fasting plasma glucose [1.4%]
Impaired kidney function [0.9%]
Malnutrition* [14.8%]
Air pollution [5.1%]
High blood pressure [5.0%]
Tobacco use [4.9%]
Dietary risks [4.7%]
High fasting plasma glucose [4.0%]
WaSH†
[3.9%]
Alcohol & drug use [3.9%]
Occupational risks [2.6%]
Impaired kidney function [2.0%]
1
2
3
4
5
6
7
8
9
10
1
2
3
4
5
6
7
8
9
10
Risk factors 1990 Risk factors 2016
The percent figure in bracket next to each risk is DALYs from that risk out of total DALYs. *Malnutrition is child and maternal malnutrition.
†
WaSH is unsafe water, sanitation, and handwashing.
What risk factors are driving the most death and disability combined?
Contribution of top 10 risks to DALYs number, both sexes, ranked by number of DALYs, 1990-2016
same or increase decrease
Behavioural Environmental/occupational Metabolic
Malnutrition* [32.2%]
WaSH†
[15.2%]
Air pollution [7.7%]
Tobacco use [3.6%]
Dietary risks [2.3%]
High blood pressure [2.2%]
Occupational risks [1.9%]
Alcohol & drug use [1.6%]
High fasting plasma glucose [1.4%]
Impaired kidney function [0.9%]
Malnutrition* [14.8%]
Air pollution [5.1%]
High blood pressure [5.0%]
Tobacco use [4.9%]
Dietary risks [4.7%]
High fasting plasma glucose [4.0%]
WaSH†
[3.9%]
Alcohol & drug use [3.9%]
Occupational risks [2.6%]
Impaired kidney function [2.0%]
1
2
3
4
5
6
7
8
9
10
1
2
3
4
5
6
7
8
9
10
Females
15 10 5 0 0 5 10 15
Impaired kidney function
Occupational risks
Alcohol & drug use
WaSH†
High fasting plasma glucose
Dietary risks
Tobacco use
High blood pressure
Air pollution
Malnutrition*
Males
Percent of years of life lost and years lived with disability Percent of years of life lost and years lived with disability
How did the risk factors differ by sex in 2016?
Percent of total DALYs attributable to top 10 risks, ranked by percent for both sexes combined, 2016
Behavioural Environmental/occupational Metabolic
*Malnutrition is child and maternal malnutrition.
†
WaSH is unsafe water, sanitation, and handwashing.
What risk factors are driving the most death and disability combined?
Contribution of top 10 risks to DALYs number, both sexes, ranked by number of DALYs, 1990-2016](https://image.slidesharecdn.com/indiahealthofthenationsstatesreport2017-230818115250-fe055a08/85/India_Health_of_the_Nation-s_States_Report_2017-pdf-90-320.jpg)
![87
0
50
100
150
1990 1995 2000 2005 2010 2016
Year
Deaths
per
1,000
live
births
Assam under-5 rate India under-5 rate Comparative average rate globally for similar
Socio-demographic Index as Assam
39.2
52.2
37.8
How much did the under-5 mortality rate change from 1990 to 2016?
Under-5 mortality rate, both sexes combined, 1990-2016
2016 life expectancy
Females: 66.9 years Males: 63.5 years
1990 life expectancy
Females: 56.6 years Males: 55.6 years
Assam
1.1%
35%
4.1%
38.1%
1.8%
2.9%
0.9%
1.1%
5.7%
5.3%
3.8%
12%
10.3%
5.6%
5.1%
5.6%
11% 5.2%
8.5%
8.4%
12.6%
15.7%
7.7%
9.2%
2.3%
15%
28.7%
10.5%
5.4%
4.3%
7%
3.1%
6.8%
3.8%
22.6%
6.9%
28.9%
16.5%
1.6%
3.2%
3.3%
7.7%
2.6%
2.8%
0−14 years [13% of total deaths] 15−39 years [13.6% of total deaths]
40−69 years [39.8% of total deaths] 70+ years [33.5% of total deaths]
What caused the most deaths in different age groups in 2016?
Percent contribution of top 10 causes of death by age group, both sexes, 2016
HIV/AIDS & tuberculosis
Diarrhoea/LRI*/other
NTDs†
& malaria
Maternal disorders
Neonatal disorders
Nutritional deficiencies
Other communicable diseases
Cancers
Cardiovascular diseases
Chronic respiratory diseases
Cirrhosis
Digestive diseases
Neurological disorders
Diabetes/urog‡
/blood/endo§
Other non-communicable
Transport injuries
Unintentional injuries
Suicide & violence
Other causes of death
*LRI is lower respiratory infections.
†
NTDs are neglected tropical diseases.
‡
Urog is urogenital diseases.
§
Endo is endocrine diseases.
How much did the under-5 mortality rate change from 1990 to 2016?
Under-5 mortality rate, both sexes combined, 1990-2016
What caused the most deaths in different age groups in 2016?
Percent contribution of top 10 causes of death by age group, both sexes, 2016
Assam](https://image.slidesharecdn.com/indiahealthofthenationsstatesreport2017-230818115250-fe055a08/85/India_Health_of_the_Nation-s_States_Report_2017-pdf-91-320.jpg)
![89
Assam
Diarrhoeal diseases [14.0%]
Lower respiratory infections [7.9%]
Tuberculosis [5.6%]
Preterm birth complications [4.9%]
Measles [4.7%]
Other neonatal disorders [4.1%]
COPD†
[3.4%]
Neonatal encephalopathy [3.2%]
Stroke [3.0%]
Iron-deficiency anaemia [2.4%]
Ischaemic heart disease [1.7%]
Self-harm§
[1.6%]
Asthma [1.5%]
Malaria [1.4%]
Intestinal infectious diseases [1.4%]
Hepatitis [1.3%]
Sense organ diseases‡
[1.1%]
Road injuries [1.1%]
Diabetes [0.7%]
Diarrhoeal diseases [5.8%]
Stroke [5.6%]
Lower respiratory infections [5.1%]
COPD†
[4.1%]*
Ischaemic heart disease [4.1%]
Preterm birth complications [3.8%]*
Tuberculosis [3.8%]
Iron-deficiency anaemia [3.7%]
Other neonatal disorders [2.4%]
Sense organ diseases‡
[2.3%]
Road injuries [2.3%]
Self-harm§
[2.2%]*
Hepatitis [2.1%]
Neonatal encephalopathy [2.1%]
Diabetes [2.0%]
Asthma [1.2%]*
Malaria [1.2%]*
Intestinal infectious diseases [0.9%]
Measles [0.6%]
1
2
3
4
5
6
7
8
9
10
11
12
13
14
15
1
2
3
4
5
6
7
8
9
10
11
12
13
14
15
23
27
46
26
21
37
18
20
Leading causes of DALYs 1990
How have the leading causes of death and disability combined changed from 1990 to 2016?
Change in top 15 causes of DALYs, both sexes, ranked by number of DALYs, 1990–2016
Leading causes of DALYs 2016
Communicable, maternal,
neonatal, and nutritional diseases
Non-communicable diseases Injuries same or increase decrease
*Change not significant.
The percent figure in brackets next to each cause is
DALYs from that cause out of total DALYs.
†
COPD is chronic obstructive pulmonary disease.
‡
Sense organ diseases includes mainly hearing and vision loss.
§
Self-harm refers to suicide and the nonfatal outcomes of self-harm.
The number in the bracket on top of each vertical bar is the ratio of percent DALYs to population for that age group.
The number in parentheses after each age group on the x-axis is the percent of population in that age group.
Communicable, maternal, neonatal, and nutritional diseases
Percent
of
total
DALYs
Age
Non-communicable diseases Injuries
U
n
d
e
r
5
(
9
%
)
5
t
o
9
(
1
0
%
)
1
0
t
o
1
4
(
1
0
%
)
1
5
t
o
1
9
(
9
%
)
2
0
t
o
2
4
(
9
%
)
2
5
t
o
2
9
(
9
%
)
3
0
t
o
3
4
(
8
%
)
3
5
t
o
3
9
(
7
%
)
4
0
t
o
4
4
(
6
%
)
4
5
t
o
4
9
(
6
%
)
5
0
t
o
5
4
(
5
%
)
5
5
t
o
5
9
(
4
%
)
6
0
t
o
6
4
(
3
%
)
6
5
t
o
6
9
(
2
%
)
7
0
t
o
7
4
(
1
%
)
7
5
t
o
7
9
(
1
%
)
8
0
t
o
8
4
(
1
%
)
8
5
+
(
<
1
%
)
What caused the most death and disability combined across age groups in 2016?
Percent of DALYs by age group, both sexes, 2016
[2.4]
[0.33] [0.32]
[0.46]
[0.57]
[0.61] [0.68] [0.8] [0.93]
[1.13] [1.41] [1.75]
[2.16]
[2.71]
[3.27]
[3.71]
[4.13]
[4.41]
5
0
10
15
20
How have the leading causes of death and disability combined changed from 1990 to 2016?
Change in top 15 causes of DALYs, both sexes, ranked by number of DALYs, 1990–2016
What caused the most death and disability combined across age groups in 2016?
Percent of DALYs by age group, both sexes, 2016
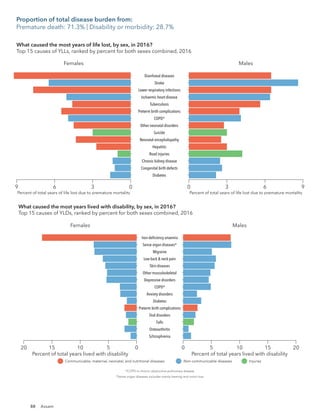
Proportion of total disease burden from:
CMNNDs: 38.5% | NCDs: 51.2% | Injuries: 10.3%](https://image.slidesharecdn.com/indiahealthofthenationsstatesreport2017-230818115250-fe055a08/85/India_Health_of_the_Nation-s_States_Report_2017-pdf-93-320.jpg)
![90 Assam
Risk factors 1990 Risk factors 2016
The percent figure in bracket next to each risk is DALYs from that risk out of total DALYs. *Malnutrition is child and maternal malnutrition.
†
WaSH is unsafe water, sanitation, and handwashing.
What risk factors are driving the most death and disability combined?
Contribution of top 10 risks to DALYs number, both sexes, ranked by number of DALYs, 19
same or increase decrease
Behavioural Environmental/occupational Metabolic
Malnutrition* [35.4%]
WaSH†
[14.1%]
Air pollution [9.3%]
Tobacco use [4.4%]
Dietary risks [3.7%]
High blood pressure [3.6%]
High fasting plasma glucose [2.1%]
Alcohol & drug use [2.0%]
Occupational risks [1.9%]
Impaired kidney function [1.3%]
Malnutrition* [17.4%]
Air pollution [8.7%]
High blood pressure [7.6%]
Dietary risks [6.9%]
Tobacco use [5.7%]
WaSH†
[5.7%]
High fasting plasma glucose [4.8%]
Alcohol & drug use [3.9%]
High body-mass index [3.5%]
Occupational risks [2.5%]
1
2
3
4
5
6
7
8
9
10
1
2
3
4
5
6
7
8
9
10
High body-mass index [1.0%] Impaired kidney function [2.5%]
11 11
Risk factors 1990 Risk factors 2016
The percent figure in bracket next to each risk is DALYs from that risk out of total DALYs. *Malnutrition is child and maternal malnutrition.
†
WaSH is unsafe water, sanitation, and handwashing.
What risk factors are driving the most death and disability combined?
Contribution of top 10 risks to DALYs number, both sexes, ranked by number of DALYs, 1990-2016
same or increase decrease
Behavioural Environmental/occupational Metabolic
Malnutrition* [32.2%]
WaSH†
[15.2%]
Air pollution [7.7%]
Tobacco use [3.6%]
Dietary risks [2.3%]
High blood pressure [2.2%]
Occupational risks [1.9%]
Alcohol & drug use [1.6%]
High fasting plasma glucose [1.4%]
Impaired kidney function [0.9%]
Malnutrition* [14.8%]
Air pollution [5.1%]
High blood pressure [5.0%]
Tobacco use [4.9%]
Dietary risks [4.7%]
High fasting plasma glucose [4.0%]
WaSH†
[3.9%]
Alcohol & drug use [3.9%]
Occupational risks [2.6%]
Impaired kidney function [2.0%]
1
2
3
4
5
6
7
8
9
10
1
2
3
4
5
6
7
8
9
10
Females
15 10 5 0 0 5 10 15
Occupational risks
High body-mass index
Alcohol & drug use
High fasting plasma glucose
WaSH†
Tobacco use
Dietary risks
High blood pressure
Air pollution
Malnutrition*
Males
20 20
Percent of years of life lost and years lived with disability Percent of years of life lost and years lived with disability
How did the risk factors differ by sex in 2016?
Percent of total DALYs attributable to top 10 risks, ranked by percent for both sexes combined, 2016
Behavioural Environmental/occupational Metabolic
*Malnutrition is child and maternal malnutrition.
†
WaSH is unsafe water, sanitation, and handwashing.
What risk factors are driving the most death and disability combined?
Contribution of top 10 risks to DALYs number, both sexes, ranked by number of DALYs, 1990-2016](https://image.slidesharecdn.com/indiahealthofthenationsstatesreport2017-230818115250-fe055a08/85/India_Health_of_the_Nation-s_States_Report_2017-pdf-94-320.jpg)
![91
0
50
100
150
1990 1995 2000 2005 2010 2016
Year
Deaths
per
1,000
live
births
Bihar under-5 rate India under-5 rate Comparative average rate globally for similar
Socio-demographic Index as Bihar
39.2
45.8
66.4
How much did the under-5 mortality rate change from 1990 to 2016?
Under-5 mortality rate, both sexes combined, 1990-2016
2016 life expectancy
Females: 67.7 years Males: 67.7 years
1990 life expectancy
Females: 57.9 years Males: 58.9 years
Bihar
39.5%
3.9%
31.8%
1.5%
2.4%
0.9%
9.5%
1.1%
5.5%
0.9%
3.1%
11.8%
13.4%
7.2%
5.7%
12.8%
4.1%
3.9%
9%
10.4%
8.2%
13.5%
6.3%
11.9%
11%
33.3%
12.1%
3.9%
2.4%
6.7%
2.5%
4.5%
5.5%
2.5%
23.2%
5.4%
33.1%
16.4%
1.4%
1.6%
3.6%
6.9%
3.6%
2.4%
0−14 years [18.6% of total deaths] 15−39 years [11.6% of total deaths]
40−69 years [38.2% of total deaths] 70+ years [31.6% of total deaths]
What caused the most deaths in different age groups in 2016?
Percent contribution of top 10 causes of death by age group, both sexes, 2016
HIV/AIDS & tuberculosis
Diarrhoea/LRI*/other
NTDs†
& malaria
Maternal disorders
Neonatal disorders
Nutritional deficiencies
Other communicable diseases
Cancers
Cardiovascular diseases
Chronic respiratory diseases
Cirrhosis
Digestive diseases
Neurological disorders
Diabetes/urog‡
/blood/endo§
Other non-communicable
Transport injuries
Unintentional injuries
Suicide & violence
Other causes of death
*LRI is lower respiratory infections.
†
NTDs are neglected tropical diseases.
‡
Urog is urogenital diseases.
§
Endo is endocrine diseases.
How much did the under-5 mortality rate change from 1990 to 2016?
Under-5 mortality rate, both sexes combined, 1990-2016
What caused the most deaths in different age groups in 2016?
Percent contribution of top 10 causes of death by age group, both sexes, 2016
Bihar](https://image.slidesharecdn.com/indiahealthofthenationsstatesreport2017-230818115250-fe055a08/85/India_Health_of_the_Nation-s_States_Report_2017-pdf-95-320.jpg)
![93
Bihar
Diarrhoeal diseases [14.1%]
Lower respiratory infections [12.3%]
Measles [7.0%]
Preterm birth complications [4.2%]
Tuberculosis [3.8%]
Other neonatal disorders [3.4%]
Ischaemic heart disease [2.8%]
COPD†
[2.7%]
Neonatal encephalopathy [2.6%]
Leishmaniasis [2.5%]
Iron-deficiency anaemia [2.5%]
Congenital birth defects [2.1%]
Tetanus [1.8%]
Falls [1.3%]
Stroke [1.3%]
Sense organ diseases‡
[1.2%]
Low back & neck pain [1.1%]
Road injuries [1.1%]
Skin diseases [1.0%]
Diarrhoeal diseases [7.6%]
Ischaemic heart disease [6.6%]
Lower respiratory infections [6.4%]
Iron-deficiency anaemia [4.3%]
COPD†
[3.9%]
Preterm birth complications [3.5%]*
Congenital birth defects [3.3%]*
Other neonatal disorders [3.1%]*
Stroke [2.8%]
Neonatal encephalopathy [2.6%]*
Sense organ diseases‡
[2.5%]
Tuberculosis [2.4%]
Road injuries [2.1%]
Low back & neck pain [1.9%]
Skin diseases [1.8%]
Falls [1.6%]*
Leishmaniasis [0.7%]
Measles [0.6%]
Tetanus [0.1%]
1
2
3
4
5
6
7
8
9
10
11
12
13
14
15
1
2
3
4
5
6
7
8
9
10
11
12
13
14
15
18
41
101
35
22
25
17
20
Leading causes of DALYs 1990
How have the leading causes of death and disability combined changed from 1990 to 2016?
Change in top 15 causes of DALYs, both sexes, ranked by number of DALYs, 1990–2016
Leading causes of DALYs 2016
Communicable, maternal,
neonatal, and nutritional diseases
Non-communicable diseases Injuries same or increase decrease
*Change not significant.
The percent figure in brackets next to each cause is
DALYs from that cause out of total DALYs.
†
COPD is chronic obstructive pulmonary disease.
‡
Sense organ diseases includes mainly hearing and vision loss.
§
Self-harm refers to suicide and the nonfatal outcomes of self-harm.
The number in the bracket on top of each vertical bar is the ratio of percent DALYs to population for that age group.
The number in parentheses after each age group on the x-axis is the percent of population in that age group.
Communicable, maternal, neonatal, and nutritional diseases
Percent
of
total
DALYs
Age
Non-communicable diseases Injuries
U
n
d
e
r
5
(
1
2
%
)
5
t
o
9
(
1
3
%
)
1
0
t
o
1
4
(
1
2
%
)
1
5
t
o
1
9
(
9
%
)
2
0
t
o
2
4
(
8
%
)
2
5
t
o
2
9
(
8
%
)
3
0
t
o
3
4
(
8
%
)
3
5
t
o
3
9
(
6
%
)
4
0
t
o
4
4
(
5
%
)
4
5
t
o
4
9
(
4
%
)
5
0
t
o
5
4
(
4
%
)
5
5
t
o
5
9
(
3
%
)
6
0
t
o
6
4
(
3
%
)
6
5
t
o
6
9
(
2
%
)
7
0
t
o
7
4
(
1
%
)
7
5
t
o
7
9
(
1
%
)
8
0
t
o
8
4
(
<
1
%
)
8
5
+
(
<
1
%
)
What caused the most death and disability combined across age groups in 2016?
Percent of DALYs by age group, both sexes, 2016
[2.41]
[0.35]
[0.33] [0.45] [0.54] [0.6] [0.66] [0.76] [0.87] [1.05] [1.3]
[1.61]
[2.03]
[2.56]
[3.11]
[3.54]
[4.05]
[4.43]
0
10
20
How have the leading causes of death and disability combined changed from 1990 to 2016?
Change in top 15 causes of DALYs, both sexes, ranked by number of DALYs, 1990–2016
What caused the most death and disability combined across age groups in 2016?
Percent of DALYs by age group, both sexes, 2016
Proportion of total disease burden from:
CMNNDs: 42.6% | NCDs: 47.6% | Injuries: 9.8%](https://image.slidesharecdn.com/indiahealthofthenationsstatesreport2017-230818115250-fe055a08/85/India_Health_of_the_Nation-s_States_Report_2017-pdf-97-320.jpg)
![94 Bihar
Risk factors 1990 Risk factors 2016
The percent figure in bracket next to each risk is DALYs from that risk out of total DALYs. *Malnutrition is child and maternal malnutrition.
†
WaSH is unsafe water, sanitation, and handwashing.
What risk factors are driving the most death and disability combined?
Contribution of top 10 risks to DALYs number, both sexes, ranked by number of DALYs, 19
same or increase decrease
Behavioural Environmental/occupational Metabolic
Malnutrition* [39.7%]
WaSH†
[14.9%]
Air pollution [12.7%]
Tobacco use [3.8%]
Dietary risks [3.3%]
High blood pressure [2.8%]
Occupational risks [1.9%]
High fasting plasma glucose [1.5%]
High total cholesterol [1.3%]
Alcohol & drug use [1.2%]
Malnutrition* [21.7%]
Air pollution [11.6%]
WaSH†
[7.9%]
Dietary risks [7.0%]
High blood pressure [6.4%]
Tobacco use [4.8%]
High fasting plasma glucose [3.8%]
High total cholesterol [2.7%]
Occupational risks [2.7%]
Alcohol & drug use [2.3%]
1
2
3
4
5
6
7
8
9
10
1
2
3
4
5
6
7
8
9
10
Risk factors 1990 Risk factors 2016
The percent figure in bracket next to each risk is DALYs from that risk out of total DALYs. *Malnutrition is child and maternal malnutrition.
†
WaSH is unsafe water, sanitation, and handwashing.
What risk factors are driving the most death and disability combined?
Contribution of top 10 risks to DALYs number, both sexes, ranked by number of DALYs, 1990-2016
same or increase decrease
Behavioural Environmental/occupational Metabolic
Malnutrition* [32.2%]
WaSH†
[15.2%]
Air pollution [7.7%]
Tobacco use [3.6%]
Dietary risks [2.3%]
High blood pressure [2.2%]
Occupational risks [1.9%]
Alcohol & drug use [1.6%]
High fasting plasma glucose [1.4%]
Impaired kidney function [0.9%]
Malnutrition* [14.8%]
Air pollution [5.1%]
High blood pressure [5.0%]
Tobacco use [4.9%]
Dietary risks [4.7%]
High fasting plasma glucose [4.0%]
WaSH†
[3.9%]
Alcohol & drug use [3.9%]
Occupational risks [2.6%]
Impaired kidney function [2.0%]
1
2
3
4
5
6
7
8
9
10
1
2
3
4
5
6
7
8
9
10
Females
15 10 5 0 0 5 10 15
Alcohol & drug use
Occupational risks
High total cholesterol
High fasting plasma glucose
Tobacco use
High blood pressure
Dietary risks
WaSH†
Air pollution
Malnutrition*
Males
20 20
Percent of years of life lost and years lived with disability Percent of years of life lost and years lived with disability
How did the risk factors differ by sex in 2016?
Percent of total DALYs attributable to top 10 risks, ranked by percent for both sexes combined, 2016
Behavioural Environmental/occupational Metabolic
*Malnutrition is child and maternal malnutrition.
†
WaSH is unsafe water, sanitation, and handwashing.
What risk factors are driving the most death and disability combined?
Contribution of top 10 risks to DALYs number, both sexes, ranked by number of DALYs, 1990-2016](https://image.slidesharecdn.com/indiahealthofthenationsstatesreport2017-230818115250-fe055a08/85/India_Health_of_the_Nation-s_States_Report_2017-pdf-98-320.jpg)
![95
0
50
100
150
1990 1995 2000 2005 2010 2016
Year
Deaths
per
1,000
live
births
Chhattisgarh under-5 rate India under-5 rate Comparative average rate globally for similar
Socio-demographic Index as Chhattisgarh
39.2
46.9
37.8
How much did the under-5 mortality rate change from 1990 to 2016?
Under-5 mortality rate, both sexes combined, 1990-2016
2016 life expectancy
Females: 68.3 years Males: 64.6 years
1990 life expectancy
Females: 58.9 years Males: 55.7 years
Chhattisgarh
1.4%
32%
5.8%
41.3%
2.9%
1.6%
1%
5.1%
0.9%
4.8%
3.2%
10.8%
12%
3.3%
5.6%
11.4%
3.6%
4.7%
9.8%
9.9%
16.1%
12.8%
7.6%
11.4%
11.6%
33.5%
7.2%
2.7%
4%
7.3%
2.8%
4.4%
7.5%
4%
26.5%
6.1%
31.4%
9.7%
0.8%
2.8%
3.3%
8.1%
4%
3.2%
0−14 years [12% of total deaths] 15−39 years [12% of total deaths]
40−69 years [41.9% of total deaths] 70+ years [34.1% of total deaths]
What caused the most deaths in different age groups in 2016?
Percent contribution of top 10 causes of death by age group, both sexes, 2016
HIV/AIDS & tuberculosis
Diarrhoea/LRI*/other
NTDs†
& malaria
Maternal disorders
Neonatal disorders
Nutritional deficiencies
Other communicable diseases
Cancers
Cardiovascular diseases
Chronic respiratory diseases
Cirrhosis
Digestive diseases
Neurological disorders
Diabetes/urog‡
/blood/endo§
Other non-communicable
Transport injuries
Unintentional injuries
Suicide & violence
Other causes of death
*LRI is lower respiratory infections.
†
NTDs are neglected tropical diseases.
‡
Urog is urogenital diseases.
§
Endo is endocrine diseases.
How much did the under-5 mortality rate change from 1990 to 2016?
Under-5 mortality rate, both sexes combined, 1990-2016
What caused the most deaths in different age groups in 2016?
Percent contribution of top 10 causes of death by age group, both sexes, 2016
Chhattisgarh](https://image.slidesharecdn.com/indiahealthofthenationsstatesreport2017-230818115250-fe055a08/85/India_Health_of_the_Nation-s_States_Report_2017-pdf-99-320.jpg)
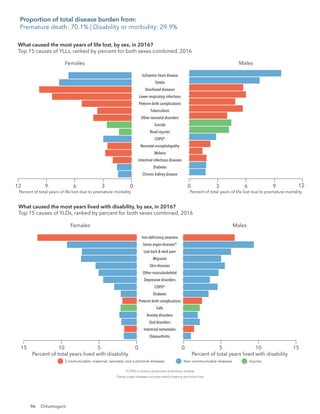
![97
Chhattisgarh
Lower respiratory infections [11.5%]
Diarrhoeal diseases [10.4%]
Preterm birth complications [6.7%]
Other neonatal disorders [5.2%]
Malaria [4.8%]
Tuberculosis [4.6%]
Neonatal encephalopathy [3.8%]
Measles [3.4%]
Stroke [2.6%]
Intestinal infectious diseases [2.2%]
Ischaemic heart disease [2.1%]
Iron-deficiency anaemia [1.8%]
Protein-energy malnutrition [1.6%]
Congenital birth defects [1.6%]
COPD†
[1.5%]
Sense organ diseases‡
[1.3%]
Self-harm§
[1.3%]
Road injuries [1.2%]
Low back & neck pain [1.0%]
Migraine [0.9%]
Diabetes [0.5%]
Ischaemic heart disease [6.1%]
Diarrhoeal diseases [5.7%]
Stroke [5.5%]
Lower respiratory infections [5.0%]
Preterm birth complications [4.2%]
Tuberculosis [3.5%]
COPD†
[3.1%]
Iron-deficiency anaemia [3.1%]
Other neonatal disorders [2.9%]
Sense organ diseases‡
[2.8%]
Self-harm§
[2.6%]
Road injuries [2.4%]
Low back & neck pain [2.0%]
Diabetes [2.0%]
Migraine [1.9%]
Neonatal encephalopathy [1.7%]
Malaria [1.5%]
Intestinal infectious diseases [1.4%]
Congenital birth defects [1.3%]*
Protein-energy malnutrition [1.0%]
Measles [0.5%]
1
2
3
4
5
6
7
8
9
10
11
12
13
14
15
1
2
3
4
5
6
7
8
9
10
11
12
13
14
15
17
22
23
20
20
24
17
19
26
49
27
41
Leading causes of DALYs 1990
How have the leading causes of death and disability combined changed from 1990 to 2016?
Change in top 15 causes of DALYs, both sexes, ranked by number of DALYs, 1990–2016
Leading causes of DALYs 2016
Communicable, maternal,
neonatal, and nutritional diseases
Non-communicable diseases Injuries same or increase decrease
*Change not significant.
The percent figure in brackets next to each cause is
DALYs from that cause out of total DALYs.
†
COPD is chronic obstructive pulmonary disease.
‡
Sense organ diseases includes mainly hearing and vision loss.
§
Self-harm refers to suicide and the nonfatal outcomes of self-harm.
[2.17]
[0.31] [0.31]
[0.45]
[0.55] [0.59] [0.66]
[0.78]
[0.9]
[1.1] [1.38] [1.7] [2.12]
[2.65]
[3.2]
[3.63]
[4.09]
[4.43]
The number in the bracket on top of each vertical bar is the ratio of percent DALYs to population for that age group.
The number in parentheses after each age group on the x-axis is the percent of population in that age group.
Communicable, maternal, neonatal, and nutritional diseases
Percent
of
total
DALYs
Age
Non-communicable diseases Injuries
U
n
d
e
r
5
(
9
%
)
5
t
o
9
(
1
0
%
)
1
0
t
o
1
4
(
1
0
%
)
1
5
t
o
1
9
(
1
0
%
)
2
0
t
o
2
4
(
9
%
)
2
5
t
o
2
9
(
8
%
)
3
0
t
o
3
4
(
8
%
)
3
5
t
o
3
9
(
7
%
)
4
0
t
o
4
4
(
7
%
)
4
5
t
o
4
9
(
6
%
)
5
0
t
o
5
4
(
5
%
)
5
5
t
o
5
9
(
4
%
)
6
0
t
o
6
4
(
3
%
)
6
5
t
o
6
9
(
2
%
)
7
0
t
o
7
4
(
1
%
)
7
5
t
o
7
9
(
1
%
)
8
0
t
o
8
4
(
<
1
%
)
8
5
+
(
<
1
%
)
What caused the most death and disability combined across age groups in 2016?
Percent of DALYs by age group, both sexes, 2016
0
5
10
15
20
How have the leading causes of death and disability combined changed from 1990 to 2016?
Change in top 15 causes of DALYs, both sexes, ranked by number of DALYs, 1990–2016
What caused the most death and disability combined across age groups in 2016?
Percent of DALYs by age group, both sexes, 2016
Proportion of total disease burden from:
CMNNDs: 37.7% | NCDs: 50.4% | Injuries: 11.9%](https://image.slidesharecdn.com/indiahealthofthenationsstatesreport2017-230818115250-fe055a08/85/India_Health_of_the_Nation-s_States_Report_2017-pdf-101-320.jpg)
![98 Chhattisgarh
Risk factors 1990 Risk factors 2016
The percent figure in bracket next to each risk is DALYs from that risk out of total DALYs. *Malnutrition is child and maternal malnutrition.
†
WaSH is unsafe water, sanitation, and handwashing.
What risk factors are driving the most death and disability combined?
Contribution of top 10 risks to DALYs number, both sexes, ranked by number of DALYs, 19
same or increase decrease
Behavioural Environmental/occupational Metabolic
Malnutrition* [37.6%]
WaSH†
[11.4%]
Air pollution [10.8%]
Tobacco use [3.6%]
Dietary risks [3.6%]
High blood pressure [3.6%]
High fasting plasma glucose [1.6%]
Occupational risks [1.6%]
Alcohol & drug use [1.2%]
High total cholesterol [1.1%]
Malnutrition* [16.4%]
Air pollution [9.5%]
High blood pressure [8.0%]
Dietary risks [7.9%]
WaSH†
[5.7%]
High fasting plasma glucose [5.4%]
Tobacco use [4.5%]
High total cholesterol [3.3%]
Alcohol & drug use [3.2%]
High body-mass index [3.0%]
1
2
3
4
5
6
7
8
9
10
1
2
3
4
5
6
7
8
9
10
High body-mass index [0.6%] Occupational risks [2.5%]
12 11
Risk factors 1990 Risk factors 2016
The percent figure in bracket next to each risk is DALYs from that risk out of total DALYs. *Malnutrition is child and maternal malnutrition.
†
WaSH is unsafe water, sanitation, and handwashing.
What risk factors are driving the most death and disability combined?
Contribution of top 10 risks to DALYs number, both sexes, ranked by number of DALYs, 1990-2016
same or increase decrease
Behavioural Environmental/occupational Metabolic
Malnutrition* [32.2%]
WaSH†
[15.2%]
Air pollution [7.7%]
Tobacco use [3.6%]
Dietary risks [2.3%]
High blood pressure [2.2%]
Occupational risks [1.9%]
Alcohol & drug use [1.6%]
High fasting plasma glucose [1.4%]
Impaired kidney function [0.9%]
Malnutrition* [14.8%]
Air pollution [5.1%]
High blood pressure [5.0%]
Tobacco use [4.9%]
Dietary risks [4.7%]
High fasting plasma glucose [4.0%]
WaSH†
[3.9%]
Alcohol & drug use [3.9%]
Occupational risks [2.6%]
Impaired kidney function [2.0%]
1
2
3
4
5
6
7
8
9
10
1
2
3
4
5
6
7
8
9
10
Females
15 10 5 0 0 5 10 15
High body-mass index
Alcohol & drug use
High total cholesterol
Tobacco use
High fasting plasma glucose
WaSH†
Dietary risks
High blood pressure
Air pollution
Malnutrition*
Males
20 20
Percent of years of life lost and years lived with disability Percent of years of life lost and years lived with disability
How did the risk factors differ by sex in 2016?
Percent of total DALYs attributable to top 10 risks, ranked by percent for both sexes combined, 2016
Behavioural Environmental/occupational Metabolic
*Malnutrition is child and maternal malnutrition.
†
WaSH is unsafe water, sanitation, and handwashing.
What risk factors are driving the most death and disability combined?
Contribution of top 10 risks to DALYs number, both sexes, ranked by number of DALYs, 1990-2016](https://image.slidesharecdn.com/indiahealthofthenationsstatesreport2017-230818115250-fe055a08/85/India_Health_of_the_Nation-s_States_Report_2017-pdf-102-320.jpg)
![99
0
50
100
150
1990 1995 2000 2005 2010 2016
Year
Deaths
per
1,000
live
births
Delhi under-5 rate India under-5 rate Comparative average rate globally for similar
Socio-demographic Index as Delhi
39.2
31.4
12.7
How much did the under-5 mortality rate change from 1990 to 2016?
Under-5 mortality rate, both sexes combined, 1990-2016
2016 life expectancy
Females: 74.7 years Males: 70.8 years
1990 life expectancy
Females: 65.6 years Males: 63.5 years
Delhi
28.3%
2.5%
45%
1.5%
0.9%
2.3%
1.3%
8.2%
1.6%
4.3%
4%
11.5%
8.4%
2.5%
9.1%
14.9%
5.2% 5.7%
12.4%
8.1%
10.7%
11.6%
6.1%
4.7%
19.8%
35.6%
6.3%
4.2%
2.2%
9%
3.4%
3.4%
5.2%
2.6%
9.4%
9%
43.2%
9.5%
1.2%
1.9%
4.8%
11.6%
4.3%
2.6%
40−69 years [41.2% of total deaths] 70+ years [33.2% of total deaths]
0−14 years [10.8% of total deaths] 15−39 years [14.8% of total deaths]
What caused the most deaths in different age groups in 2016?
Percent contribution of top 10 causes of death by age group, both sexes, 2016
HIV/AIDS & tuberculosis
Diarrhoea/LRI*/other
NTDs†
& malaria
Maternal disorders
Neonatal disorders
Nutritional deficiencies
Other communicable diseases
Cancers
Cardiovascular diseases
Chronic respiratory diseases
Cirrhosis
Digestive diseases
Neurological disorders
Diabetes/urog‡
/blood/endo§
Other non-communicable
Transport injuries
Unintentional injuries
Suicide & violence
Other causes of death
*LRI is lower respiratory infections.
†
NTDs are neglected tropical diseases.
‡
Urog is urogenital diseases.
§
Endo is endocrine diseases.
How much did the under-5 mortality rate change from 1990 to 2016?
Under-5 mortality rate, both sexes combined, 1990-2016
What caused the most deaths in different age groups in 2016?
Percent contribution of top 10 causes of death by age group, both sexes, 2016
Delhi](https://image.slidesharecdn.com/indiahealthofthenationsstatesreport2017-230818115250-fe055a08/85/India_Health_of_the_Nation-s_States_Report_2017-pdf-103-320.jpg)
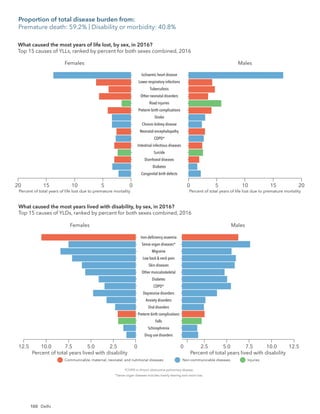
![101
Delhi
Lower respiratory infections [7.4%]
Diarrhoeal diseases [6.9%]
Preterm birth complications [5.7%]
Other neonatal disorders [5.4%]
Ischaemic heart disease [5.3%]
Tuberculosis [5.2%]
Neonatal encephalopathy [3.8%]
Meningitis [2.6%]
Intestinal infectious diseases [2.5%]
Congenital birth defects [2.3%]
Iron-deficiency anaemia [2.3%]
Road injuries [2.2%]
COPD†
[1.9%]
Measles [1.8%]
Sense organ diseases‡
[1.6%]
Stroke [1.6%]
Skin diseases [1.5%]
Migraine [1.5%]
Low back & neck pain [1.5%]
Diabetes [1.3%]
Other musculoskeletal disorders [1.2%]
Ischaemic heart disease [9.6%]
Iron-deficiency anaemia [3.4%]
COPD†
[3.4%]
Preterm birth complications [3.4%]*
Diabetes [3.2%]
Tuberculosis [3.2%]
Sense organ diseases‡
[3.1%]
Road injuries [3.1%]
Lower respiratory infections [3.0%]
Migraine [2.8%]
Low back & neck pain [2.7%]
Other neonatal disorders [2.6%]*
Skin diseases [2.6%]
Other musculoskeletal disorders [2.1%]
Stroke [2.1%]
Diarrhoeal diseases [1.8%]
Neonatal encephalopathy [1.7%]
Congenital birth defects [1.6%]*
Intestinal infectious diseases [1.6%]
Meningitis [0.9%]
Measles [0.1%]
1
2
3
4
5
6
7
8
9
10
11
12
13
14
15
1
2
3
4
5
6
7
8
9
10
11
12
13
14
15
18
21
22
20
18
19
16
17
29
105
22
24
Leading causes of DALYs 1990
How have the leading causes of death and disability combined changed from 1990 to 2016?
Change in top 15 causes of DALYs, both sexes, ranked by number of DALYs, 1990–2016
Leading causes of DALYs 2016
Communicable, maternal,
neonatal, and nutritional diseases
Non-communicable diseases Injuries same or increase decrease
*Change not significant.
The percent figure in brackets next to each cause is
DALYs from that cause out of total DALYs.
†
COPD is chronic obstructive pulmonary disease.
‡
Sense organ diseases includes mainly hearing and vision loss.
§
Self-harm refers to suicide and the nonfatal outcomes of self-harm.
[2.23]
[0.37] [0.36]
[0.49]
[0.59]
[0.65]
[0.73]
[0.85]
[0.98] [1.18] [1.46] [1.82]
[2.25]
[2.8]
[3.35]
[3.84]
[4.52]
[5.22]
The number in the bracket on top of each vertical bar is the ratio of percent DALYs to population for that age group.
The number in parentheses after each age group on the x-axis is the percent of population in that age group.
Communicable, maternal, neonatal, and nutritional diseases
Percent
of
total
DALYs
Age
Non-communicable diseases Injuries
What caused the most death and disability combined across age groups in 2016?
Percent of DALYs by age group, both sexes, 2016
U
n
d
e
r
5
(
7
%
)
5
t
o
9
(
9
%
)
1
0
t
o
1
4
(
9
%
)
1
5
t
o
1
9
(
9
%
)
2
0
t
o
2
4
(
1
0
%
)
2
5
t
o
2
9
(
1
1
%
)
3
0
t
o
3
4
(
1
0
%
)
3
5
t
o
3
9
(
8
%
)
4
0
t
o
4
4
(
7
%
)
4
5
t
o
4
9
(
6
%
)
5
0
t
o
5
4
(
5
%
)
5
5
t
o
5
9
(
4
%
)
6
0
t
o
6
4
(
3
%
)
6
5
t
o
6
9
(
2
%
)
7
0
t
o
7
4
(
1
%
)
7
5
t
o
7
9
(
1
%
)
8
0
t
o
8
4
(
<
1
%
)
8
5
+
(
<
1
%
)
0
4
8
12
16
How have the leading causes of death and disability combined changed from 1990 to 2016?
Change in top 15 causes of DALYs, both sexes, ranked by number of DALYs, 1990–2016
What caused the most death and disability combined across age groups in 2016?
Percent of DALYs by age group, both sexes, 2016
Proportion of total disease burden from:
CMNNDs: 27.8% | NCDs: 61.2% | Injuries: 11.0%](https://image.slidesharecdn.com/indiahealthofthenationsstatesreport2017-230818115250-fe055a08/85/India_Health_of_the_Nation-s_States_Report_2017-pdf-105-320.jpg)
![102 Delhi
Risk factors 1990 Risk factors 2016
The percent figure in bracket next to each risk is DALYs from that risk out of total DALYs. *Malnutrition is child and maternal malnutrition.
†
WaSH is unsafe water, sanitation, and handwashing.
What risk factors are driving the most death and disability combined?
Contribution of top 10 risks to DALYs number, both sexes, ranked by number of DALYs, 19
same or increase decrease
Behavioural Environmental/occupational Metabolic
Malnutrition* [30.5%]
Air pollution [7.4%]
WaSH†
[6.2%]
Dietary risks [5.5%]
High blood pressure [4.7%]
Tobacco use [4.4%]
High fasting plasma glucose [4.0%]
Alcohol & drug use [2.9%]
High total cholesterol [2.7%]
Occupational risks [2.0%]
Malnutrition* [12.9%]
High fasting plasma glucose [8.5%]
Dietary risks [8.4%]
High blood pressure [7.9%]
Air pollution [7.0%]
Tobacco use [6.0%]
High body-mass index [5.7%]
High total cholesterol [5.1%]
Alcohol & drug use [4.6%]
Occupational risks [3.3%]
1
2
3
4
5
6
7
8
9
10
1
2
3
4
5
6
7
8
9
10
High body-mass index [1.8%] WaSH†
[1.4%]
11 12
Risk factors 1990 Risk factors 2016
The percent figure in bracket next to each risk is DALYs from that risk out of total DALYs. *Malnutrition is child and maternal malnutrition.
†
WaSH is unsafe water, sanitation, and handwashing.
What risk factors are driving the most death and disability combined?
Contribution of top 10 risks to DALYs number, both sexes, ranked by number of DALYs, 1990-2016
same or increase decrease
Behavioural Environmental/occupational Metabolic
Malnutrition* [32.2%]
WaSH†
[15.2%]
Air pollution [7.7%]
Tobacco use [3.6%]
Dietary risks [2.3%]
High blood pressure [2.2%]
Occupational risks [1.9%]
Alcohol & drug use [1.6%]
High fasting plasma glucose [1.4%]
Impaired kidney function [0.9%]
Malnutrition* [14.8%]
Air pollution [5.1%]
High blood pressure [5.0%]
Tobacco use [4.9%]
Dietary risks [4.7%]
High fasting plasma glucose [4.0%]
WaSH†
[3.9%]
Alcohol & drug use [3.9%]
Occupational risks [2.6%]
Impaired kidney function [2.0%]
1
2
3
4
5
6
7
8
9
10
1
2
3
4
5
6
7
8
9
10
Females
12 8 4 0 0 4 8 12
Occupational risks
Alcohol & drug use
High total cholesterol
High body-mass index
Tobacco use
Air pollution
High blood pressure
Dietary risks
High fasting plasma glucose
Malnutrition*
Males
16 16
Percent of years of life lost and years lived with disability Percent of years of life lost and years lived with disability
How did the risk factors differ by sex in 2016?
Percent of total DALYs attributable to top 10 risks, ranked by percent for both sexes combined, 2016
*Malnutrition is child and maternal malnutrition.
Behavioural Environmental/occupational Metabolic
What risk factors are driving the most death and disability combined?
Contribution of top 10 risks to DALYs number, both sexes, ranked by number of DALYs, 1990-2016](https://image.slidesharecdn.com/indiahealthofthenationsstatesreport2017-230818115250-fe055a08/85/India_Health_of_the_Nation-s_States_Report_2017-pdf-106-320.jpg)
![103
0
50
100
150
1990 1995 2000 2005 2010 2016
Year
Deaths
per
1,000
live
births
Goa under-5 rate India under-5 rate Comparative average rate globally for similar
Socio-demographic Index as Goa
16
13.5
39.2
How much did the under-5 mortality rate change from 1990 to 2016?
Under-5 mortality rate, both sexes combined, 1990-2016
2016 life expectancy
Females: 78.4 years Males: 73.0 years
1990 life expectancy
Females: 69.2 years Males: 66.1 years
Goa
2.9%
22%
2.7%
42.1%
2% 1.2%
1.4%
12.4%
1.6%
6.6%
5%
10.5%
4.5%
7.7%
13.4%
12.7%
2.5%
5.1%
12.1%
8.3%
15.1%
8%
3.6%
4.5%
14.4%
37.4%
6.6%
9.5%
10.4%
2.8%
3.9%
1.9%
4.9%
1.4%
9.6%
7.5%
42.8%
9.5%
2.4%
1.3%
5.6%
12.3%
5.3%
2.1%
0−14 years [4.7% of total deaths] 15−39 years [9.4% of total deaths]
40−69 years [42.6% of total deaths] 70+ years [43.3% of total deaths]
What caused the most deaths in different age groups in 2016?
Percent contribution of top 10 causes of death by age group, both sexes, 2016
HIV/AIDS & tuberculosis
Diarrhoea/LRI*/other
NTDs†
& malaria
Maternal disorders
Neonatal disorders
Nutritional deficiencies
Other communicable diseases
Cancers
Cardiovascular diseases
Chronic respiratory diseases
Cirrhosis
Digestive diseases
Neurological disorders
Diabetes/urog‡
/blood/endo§
Other non-communicable
Transport injuries
Unintentional injuries
Suicide & violence
Other causes of death
*LRI is lower respiratory infections.
†
NTDs are neglected tropical diseases.
‡
Urog is urogenital diseases.
§
Endo is endocrine diseases.
How much did the under-5 mortality rate change from 1990 to 2016?
Under-5 mortality rate, both sexes combined, 1990-2016
What caused the most deaths in different age groups in 2016?
Percent contribution of top 10 causes of death by age group, both sexes, 2016
Goa](https://image.slidesharecdn.com/indiahealthofthenationsstatesreport2017-230818115250-fe055a08/85/India_Health_of_the_Nation-s_States_Report_2017-pdf-107-320.jpg)
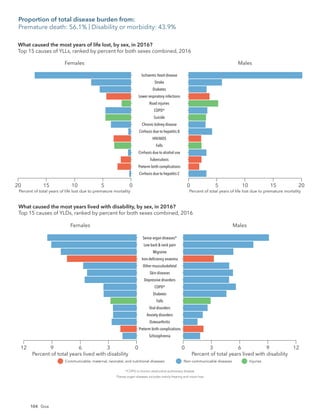
![105
Goa
Ischaemic heart disease [11.0%]
Sense organ diseases‡
[4.1%]
Diabetes [4.1%]
COPD†
[4.1%]
Stroke [4.0%]*
Low back & neck pain [3.6%]
Migraine [3.0%]
Road injuries [2.8%]
Falls [2.7%]
Skin diseases [2.5%]
Iron-deficiency anaemia [2.4%]
Other musculoskeletal disorders [2.4%]
Lower respiratory infections [2.3%]
Depressive disorders [2.3%]
Chronic kidney disease [2.3%]
[2.1%]*
Preterm birth complications [2.0%]
Diarrhoeal diseases [1.5%]
Congenital birth defects [1.4%]
Tuberculosis [1.3%]
Other neonatal disorders [1.1%]
Neonatal encephalopathy [0.9%]
Neonatal haemolytic disease [0.4%]
Lower respiratory infections [7.8%]
Diarrhoeal diseases [7.0%]
Preterm birth complications [6.0%]
Ischaemic heart disease [5.6%]
Congenital birth defects [4.0%]
Other neonatal disorders [3.9%]
Tuberculosis [3.8%]
Neonatal haemolytic disease [2.8%]
Stroke [2.8%]
Neonatal encephalopathy [2.6%]
COPD†
[2.6%]
Self-harm§
[2.2%]
Sense organ diseases‡
[2.1%]
Low back & neck pain [2.0%]
Iron-deficiency anaemia [1.9%]
Road injuries [1.8%]
Migraine [1.8%]
Skin diseases [1.8%]
Falls [1.7%]
Depressive disorders [1.4%]
Chronic kidney disease [1.3%]
Other musculoskeletal disorders [1.3%]
Diabetes [1.2%]
Self-harm§
1
2
3
4
5
6
7
8
9
10
11
12
13
14
15
1
2
3
4
5
6
7
8
9
10
11
12
13
14
15
16
20
21
17
18
19
16
17
22
26
31
60
24
25
21
22
Leading causes of DALYs 1990
How have the leading causes of death and disability combined changed from 1990 to 2016?
Change in top 15 causes of DALYs, both sexes, ranked by number of DALYs, 1990–2016
Leading causes of DALYs 2016
Communicable, maternal,
neonatal, and nutritional diseases
Non-communicable diseases Injuries same or increase decrease
*Change not significant.
The percent figure in brackets next to each cause is
DALYs from that cause out of total DALYs.
†
COPD is chronic obstructive pulmonary disease.
‡
Sense organ diseases includes mainly hearing and vision loss.
§
Self-harm refers to suicide and the nonfatal outcomes of self-harm.
[1.11]
[0.27]
[0.3]
[0.44]
[0.53]
[0.59]
[0.67]
[0.78] [0.89]
[1.07]
[1.3]
[1.62]
[2.01]
[2.49]
[2.95]
[3.39]
[4.05]
[4.81]
The number in the bracket on top of each vertical bar is the ratio of percent DALYs to population for that age group.
The number in parentheses after each age group on the x-axis is the percent of population in that age group.
Communicable, maternal, neonatal, and nutritional diseases
Percent
of
total
DALYs
Age
Non-communicable diseases Injuries
What caused the most death and disability combined across age groups in 2016?
Percent of DALYs by age group, both sexes, 2016
U
n
d
e
r
5
(
8
%
)
5
t
o
9
(
6
%
)
1
0
t
o
1
4
(
6
%
)
1
5
t
o
1
9
(
7
%
)
2
0
t
o
2
4
(
8
%
)
2
5
t
o
2
9
(
9
%
)
3
0
t
o
3
4
(
9
%
)
3
5
t
o
3
9
(
8
%
)
4
0
t
o
4
4
(
7
%
)
4
5
t
o
4
9
(
7
%
)
5
0
t
o
5
4
(
6
%
)
5
5
t
o
5
9
(
6
%
)
6
0
t
o
6
4
(
4
%
)
6
5
t
o
6
9
(
3
%
)
7
0
t
o
7
4
(
2
%
)
7
5
t
o
7
9
(
1
%
)
8
0
t
o
8
4
(
1
%
)
8
5
+
(
<
1
%
)
0
2.5
5.0
7.5
10.0
How have the leading causes of death and disability combined changed from 1990 to 2016?
Change in top 15 causes of DALYs, both sexes, ranked by number of DALYs, 1990–2016
What caused the most death and disability combined across age groups in 2016?
Percent of DALYs by age group, both sexes, 2016
Proportion of total disease burden from:
CMNNDs: 17.6% | NCDs: 70.9% | Injuries: 11.5%](https://image.slidesharecdn.com/indiahealthofthenationsstatesreport2017-230818115250-fe055a08/85/India_Health_of_the_Nation-s_States_Report_2017-pdf-109-320.jpg)
![106 Goa
Risk factors 1990 Risk factors 2016
The percent figure in bracket next to each risk is DALYs from that risk out of total DALYs. *Malnutrition is child and maternal malnutrition.
†
WaSH is unsafe water, sanitation, and handwashing.
What risk factors are driving the most death and disability combined?
Contribution of top 10 risks to DALYs number, both sexes, ranked by number of DALYs, 19
same or increase decrease
Behavioural Environmental/occupational Metabolic
Malnutrition* [26.9%]
Air pollution [8.1%]
WaSH†
[7.0%]
Dietary risks [6.6%]
High blood pressure [6.2%]
Tobacco use [3.2%]
High fasting plasma glucose [3.2%]
High total cholesterol [2.8%]
Alcohol & drug use [2.5%]
Occupational risks [2.2%]
High blood pressure [11.0%]
Dietary risks [9.6%]
High fasting plasma glucose [9.0%]
Malnutrition* [7.3%]
High body-mass index [7.2%]
Air pollution [5.6%]
High total cholesterol [5.4%]
Alcohol & drug use [4.9%]
Impaired kidney function [3.7%]
Occupational risks [3.5%]
1
2
3
4
5
6
7
8
9
10
1
2
3
4
5
6
7
8
9
10
Impaired kidney function [2.1%] Tobacco use [3.1%]
11 11
High body-mass index [1.9%] WaSH
†
[1.0%]
12 14
Risk factors 1990 Risk factors 2016
The percent figure in bracket next to each risk is DALYs from that risk out of total DALYs. *Malnutrition is child and maternal malnutrition.
†
WaSH is unsafe water, sanitation, and handwashing.
What risk factors are driving the most death and disability combined?
Contribution of top 10 risks to DALYs number, both sexes, ranked by number of DALYs, 1990-2016
same or increase decrease
Behavioural Environmental/occupational Metabolic
Malnutrition* [32.2%]
WaSH†
[15.2%]
Air pollution [7.7%]
Tobacco use [3.6%]
Dietary risks [2.3%]
High blood pressure [2.2%]
Occupational risks [1.9%]
Alcohol & drug use [1.6%]
High fasting plasma glucose [1.4%]
Impaired kidney function [0.9%]
Malnutrition* [14.8%]
Air pollution [5.1%]
High blood pressure [5.0%]
Tobacco use [4.9%]
Dietary risks [4.7%]
High fasting plasma glucose [4.0%]
WaSH†
[3.9%]
Alcohol & drug use [3.9%]
Occupational risks [2.6%]
Impaired kidney function [2.0%]
1
2
3
4
5
6
7
8
9
10
1
2
3
4
5
6
7
8
9
10
Females
10 5 0 0 5 10
Occupational risks
Impaired kidney function
Alcohol & drug use
High total cholesterol
Air pollution
High body-mass index
Malnutrition*
High fasting plasma glucose
Dietary risks
High blood pressure
Males
Percent of years of life lost and years lived with disability Percent of years of life lost and years lived with disability
How did the risk factors differ by sex in 2016?
Percent of total DALYs attributable to top 10 risks, ranked by percent for both sexes combined, 2016
*Malnutrition is child and maternal malnutrition.
Behavioural Environmental/occupational Metabolic
What risk factors are driving the most death and disability combined?
Contribution of top 10 risks to DALYs number, both sexes, ranked by number of DALYs, 1990-2016](https://image.slidesharecdn.com/indiahealthofthenationsstatesreport2017-230818115250-fe055a08/85/India_Health_of_the_Nation-s_States_Report_2017-pdf-110-320.jpg)
![107
0
50
100
150
1990 1995 2000 2005 2010 2016
Year
Deaths
per
1,000
live
births
Gujarat under-5 rate India under-5 rate Comparative average rate globally for similar
Socio-demographic Index as Gujarat
39.2
37.1
28.5
How much did the under-5 mortality rate change from 1990 to 2016?
Under-5 mortality rate, both sexes combined, 1990-2016
2016 life expectancy
Females: 71.5 years Males: 67.3 years
1990 life expectancy
Females: 62.2 years Males: 59.8 years
Gujarat
1.3%
28.9%
4.3%
41.5%
1.4%
1.3%
1.2%
9.5%
1.2%
5.4%
3.9%
15.1%
7.6%
5.7%
14.7%
2.6%
3%4.1%
10.6%
9.8%
15.4%
11.5%
9.2%
6.2%
12.5%
36.6%
12%
2.7%
6.7%
2.6%
4.2%
2%
5.4% 4.5%
13.4%
5.8%
37.8%
17.1%
0.8%
1.5%
4.3%
7.9%
4.6%
2.2%
0−14 years [10.6% of total deaths] 15−39 years [11.9% of total deaths]
40−69 years [40.2% of total deaths] 70+ years [37.3% of total deaths]
What caused the most deaths in different age groups in 2016?
Percent contribution of top 10 causes of death by age group, both sexes, 2016
HIV/AIDS & tuberculosis
Diarrhoea/LRI*/other
NTDs†
& malaria
Maternal disorders
Neonatal disorders
Nutritional deficiencies
Other communicable diseases
Cancers
Cardiovascular diseases
Chronic respiratory diseases
Cirrhosis
Digestive diseases
Neurological disorders
Diabetes/urog‡
/blood/endo§
Other non-communicable
Transport injuries
Unintentional injuries
Suicide & violence
Other causes of death
*LRI is lower respiratory infections.
†
NTDs are neglected tropical diseases.
‡
Urog is urogenital diseases.
§
Endo is endocrine diseases.
How much did the under-5 mortality rate change from 1990 to 2016?
Under-5 mortality rate, both sexes combined, 1990-2016
What caused the most deaths in different age groups in 2016?
Percent contribution of top 10 causes of death by age group, both sexes, 2016
Gujarat](https://image.slidesharecdn.com/indiahealthofthenationsstatesreport2017-230818115250-fe055a08/85/India_Health_of_the_Nation-s_States_Report_2017-pdf-111-320.jpg)
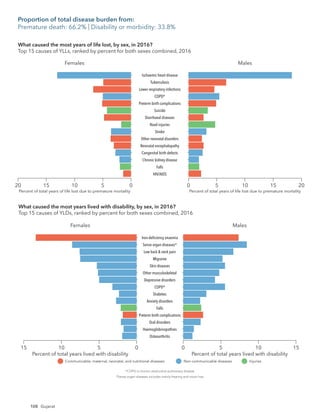
![109
Gujarat
Ischaemic heart disease [10.9%]
COPD†
[4.9%]
Tuberculosis [4.2%]
Preterm birth complications [4.1%]
Lower respiratory infections [3.7%]
Iron-deficiency anaemia [3.6%]
Sense organ diseases‡
[2.9%]
Diarrhoeal diseases [2.8%]
Road injuries [2.7%]
Self-harm§
[2.5%]
Low back & neck pain [2.4%]
Stroke [2.4%]
Migraine [2.2%]
Diabetes [2.1%]
Congenital birth defects [2.1%]*
Other neonatal disorders [2.0%]
Neonatal encephalopathy [1.9%]
Asthma [1.3%]*
Meningitis [1.0%]
Measles [0.3%]
Diarrhoeal diseases [11.3%]
Lower respiratory infections [9.1%]
Preterm birth complications [6.4%]
Tuberculosis [5.9%]
Ischaemic heart disease [4.6%]
Other neonatal disorders [4.1%]
Neonatal encephalopathy [4.0%]
Measles [3.4%]
COPD†
[3.4%]
Congenital birth defects [2.5%]
Iron-deficiency anaemia [2.3%]
Meningitis [1.8%]
Asthma [1.5%]
Self-harm§
[1.5%]
Sense organ diseases‡
[1.4%]
Stroke [1.4%]
Road injuries [1.4%]
Low back & neck pain [1.3%]
Migraine [1.2%]
Diabetes [0.7%]
1
2
3
4
5
6
7
8
9
10
11
12
13
14
15
1
2
3
4
5
6
7
8
9
10
11
12
13
14
15
18
24
25
19
20
23
17
19
64
37
Leading causes of DALYs 1990
How have the leading causes of death and disability combined changed from 1990 to 2016?
Change in top 15 causes of DALYs, both sexes, ranked by number of DALYs, 1990–2016
Leading causes of DALYs 2016
Communicable, maternal,
neonatal, and nutritional diseases
Non-communicable diseases Injuries same or increase decrease
*Change not significant.
The percent figure in brackets next to each cause is
DALYs from that cause out of total DALYs.
†
COPD is chronic obstructive pulmonary disease.
‡
Sense organ diseases includes mainly hearing and vision loss.
§
Self-harm refers to suicide and the nonfatal outcomes of self-harm.
The number in the bracket on top of each vertical bar is the ratio of percent DALYs to population for that age group.
The number in parentheses after each age group on the x-axis is the percent of population in that age group.
Communicable, maternal, neonatal, and nutritional diseases
Percent
of
total
DALYs
Age
Non-communicable diseases Injuries
What caused the most death and disability combined across age groups in 2016?
Percent of DALYs by age group, both sexes, 2016
[0.32] [0.32]
[0.45]
[0.55]
[0.6]
[0.68] [0.79]
[0.9]
[1.09]
[1.36] [1.69]
[2.09]
[2.6]
[3.12]
[3.53]
[4.09]
[4.55]
[2.07]
U
n
d
e
r
5
(
9
%
)
5
t
o
9
(
9
%
)
1
0
t
o
1
4
(
9
%
)
1
5
t
o
1
9
(
9
%
)
2
0
t
o
2
4
(
9
%
)
2
5
t
o
2
9
(
9
%
)
3
0
t
o
3
4
(
9
%
)
3
5
t
o
3
9
(
7
%
)
4
0
t
o
4
4
(
7
%
)
4
5
t
o
4
9
(
6
%
)
5
0
t
o
5
4
(
5
%
)
5
5
t
o
5
9
(
4
%
)
6
0
t
o
6
4
(
3
%
)
6
5
t
o
6
9
(
2
%
)
7
0
t
o
7
4
(
1
%
)
7
5
t
o
7
9
(
1
%
)
8
0
t
o
8
4
(
1
%
)
8
5
+
(
<
1
%
)
0
5
10
15
How have the leading causes of death and disability combined changed from 1990 to 2016?
Change in top 15 causes of DALYs, both sexes, ranked by number of DALYs, 1990–2016
What caused the most death and disability combined across age groups in 2016?
Percent of DALYs by age group, both sexes, 2016
Proportion of total disease burden from:
CMNNDs: 31.6% | NCDs: 56.7% | Injuries: 11.7%](https://image.slidesharecdn.com/indiahealthofthenationsstatesreport2017-230818115250-fe055a08/85/India_Health_of_the_Nation-s_States_Report_2017-pdf-113-320.jpg)
![110 Gujarat
Risk factors 1990 Risk factors 2016
The percent figure in bracket next to each risk is DALYs from that risk out of total DALYs. *Malnutrition is child and maternal malnutrition.
†
WaSH is unsafe water, sanitation, and handwashing.
What risk factors are driving the most death and disability combined?
Contribution of top 10 risks to DALYs number, both sexes, ranked by number of DALYs, 19
same or increase decrease
Behavioural Environmental/occupational Metabolic
Malnutrition* [36.1%]
WaSH†
[11.3%]
Air pollution [10.2%]
Dietary risks [4.7%]
Tobacco use [4.4%]
High blood pressure [4.0%]
High total cholesterol [2.2%]
High fasting plasma glucose [2.1%]
Alcohol & drug use [2.1%]
Occupational risks [2.1%]
Malnutrition* [14.6%]
Dietary risks [10.4%]
Air pollution [9.1%]
High blood pressure [9.0%]
Tobacco use [6.2%]
High fasting plasma glucose [5.8%]
High total cholesterol [5.4%]
Alcohol & drug use [4.0%]
Occupational risks [3.1%]
Impaired kidney function [2.7%]
1
2
3
4
5
6
7
8
9
10
1
2
3
4
5
6
7
8
9
10
Impaired kidney function [1.3%] WaSH†
[2.6%]
11 11
Risk factors 1990 Risk factors 2016
The percent figure in bracket next to each risk is DALYs from that risk out of total DALYs. *Malnutrition is child and maternal malnutrition.
†
WaSH is unsafe water, sanitation, and handwashing.
What risk factors are driving the most death and disability combined?
Contribution of top 10 risks to DALYs number, both sexes, ranked by number of DALYs, 1990-2016
same or increase decrease
Behavioural Environmental/occupational Metabolic
Malnutrition* [32.2%]
WaSH†
[15.2%]
Air pollution [7.7%]
Tobacco use [3.6%]
Dietary risks [2.3%]
High blood pressure [2.2%]
Occupational risks [1.9%]
Alcohol & drug use [1.6%]
High fasting plasma glucose [1.4%]
Impaired kidney function [0.9%]
Malnutrition* [14.8%]
Air pollution [5.1%]
High blood pressure [5.0%]
Tobacco use [4.9%]
Dietary risks [4.7%]
High fasting plasma glucose [4.0%]
WaSH†
[3.9%]
Alcohol & drug use [3.9%]
Occupational risks [2.6%]
Impaired kidney function [2.0%]
1
2
3
4
5
6
7
8
9
10
1
2
3
4
5
6
7
8
9
10
Females
10 5 0 0
Impaired kidney function
Occupational risks
Alcohol & drug use
High total cholesterol
High fasting plasma glucose
Tobacco use
High blood pressure
Air pollution
Dietary risks
Malnutrition*
Males
15 10 15
5
Percent of years of life lost and years lived with disability Percent of years of life lost and years lived with disability
How did the risk factors differ by sex in 2016?
Percent of total DALYs attributable to top 10 risks, ranked by percent for both sexes combined, 2016
*Malnutrition is child and maternal malnutrition.
Behavioural Environmental/occupational Metabolic
What risk factors are driving the most death and disability combined?
Contribution of top 10 risks to DALYs number, both sexes, ranked by number of DALYs, 1990-2016](https://image.slidesharecdn.com/indiahealthofthenationsstatesreport2017-230818115250-fe055a08/85/India_Health_of_the_Nation-s_States_Report_2017-pdf-114-320.jpg)
![111
0
50
100
150
1990 1995 2000 2005 2010 2016
Year
Deaths
per
1,000
live
births
Haryana under-5 rate India under-5 rate Comparative average rate globally for similar
Socio-demographic Index as Haryana
39.2
34.6
22.9
How much did the under-5 mortality rate change from 1990 to 2016?
Under-5 mortality rate, both sexes combined, 1990-2016
2016 life expectancy
Females: 71.3 years Males: 65.0 years
1990 life expectancy
Females: 62.1 years Males: 60.1 years
Haryana
1.2%
35%
3.1% 37.3%
2.9%
1.4%
1.1%
7.4%
1.7%
4.8%
4.1%
9.5%
8.5%
6.9%
15.8%
2.6%
2.9%
4.3%
16.2%
9.1%
13%
11.1%
6.6%
6%
14.2%
35.3%
13.2%
2.9%
2.2%
7.2%
3.8%
3.6%
5.1%
3.4%
14.6%
7.7%
34.1%
18.9%
1.8%
4.2%
8.3%
1.1%
3.6%
2.5%
0−14 years [8.3% of total deaths] 15−39 years [12.5% of total deaths]
40−69 years [40.7% of total deaths] 70+ years [38.5% of total deaths]
What caused the most deaths in different age groups in 2016?
Percent contribution of top 10 causes of death by age group, both sexes, 2016
HIV/AIDS & tuberculosis
Diarrhoea/LRI*/other
NTDs†
& malaria
Maternal disorders
Neonatal disorders
Nutritional deficiencies
Other communicable diseases
Cancers
Cardiovascular diseases
Chronic respiratory diseases
Cirrhosis
Digestive diseases
Neurological disorders
Diabetes/urog‡
/blood/endo§
Other non-communicable
Transport injuries
Unintentional injuries
Suicide & violence
Other causes of death
*LRI is lower respiratory infections.
†
NTDs are neglected tropical diseases.
‡
Urog is urogenital diseases.
§
Endo is endocrine diseases.
How much did the under-5 mortality rate change from 1990 to 2016?
Under-5 mortality rate, both sexes combined, 1990-2016
What caused the most deaths in different age groups in 2016?
Percent contribution of top 10 causes of death by age group, both sexes, 2016
Haryana](https://image.slidesharecdn.com/indiahealthofthenationsstatesreport2017-230818115250-fe055a08/85/India_Health_of_the_Nation-s_States_Report_2017-pdf-115-320.jpg)
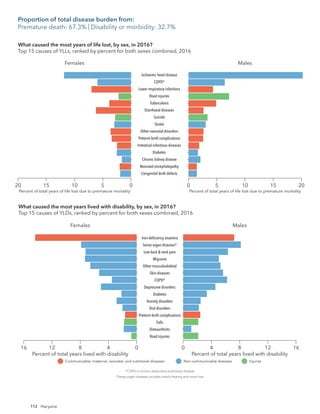
![113
Haryana
Diarrhoeal diseases [15.0%]
Lower respiratory infections [7.8%]
COPD†
[4.7%]
Ischaemic heart disease [4.6%]
Other neonatal disorders [4.4%]
Preterm birth complications [4.4%]
Tuberculosis [4.3%]
Neonatal encephalopathy [2.8%]
Iron-deficiency anaemia [2.5%]
Measles [2.5%]
Intestinal infectious diseases [2.5%]
Road injuries [2.0%]
Congenital birth defects [1.8%]
Asthma [1.7%]
Self-harm§
[1.6%]
Sense organ diseases‡
[1.5%]
Stroke [1.4%]
Low back & neck pain [1.3%]
Migraine [1.1%]
Diabetes [0.7%]
Ischaemic heart disease [11.7%]
COPD†
[5.8%]
Road injuries [4.1%]
Lower respiratory infections [3.6%]
Iron-deficiency anaemia [3.6%]
Tuberculosis [3.2%]*
Diarrhoeal diseases [3.1%]
Sense organ diseases‡
[2.6%]
Preterm birth complications [2.6%]
Diabetes [2.3%]
Stroke [2.3%]
Low back & neck pain [2.2%]
Self-harm§
[2.2%]
Other neonatal disorders [2.1%]
Migraine [2.0%]
Intestinal infectious diseases [1.4%]
Congenital birth defects [1.4%]*
Asthma [1.3%]*
Neonatal encephalopathy [1.2%]
Measles [0.3%]
1
2
3
4
5
6
7
8
9
10
11
12
13
14
15
1
2
3
4
5
6
7
8
9
10
11
12
13
14
15
21
23
24
22
19
23
16
18
72
31
Leading causes of DALYs 1990
How have the leading causes of death and disability combined changed from 1990 to 2016?
Change in top 15 causes of DALYs, both sexes, ranked by number of DALYs, 1990–2016
Leading causes of DALYs 2016
Communicable, maternal,
neonatal, and nutritional diseases
Non-communicable diseases Injuries same or increase decrease
*Change not significant.
The percent figure in brackets next to each cause is
DALYs from that cause out of total DALYs.
†
COPD is chronic obstructive pulmonary disease.
‡
Sense organ diseases includes mainly hearing and vision loss.
§
Self-harm refers to suicide and the nonfatal outcomes of self-harm.
The number in the bracket on top of each vertical bar is the ratio of percent DALYs to population for that age group.
The number in parentheses after each age group on the x-axis is the percent of population in that age group.
Communicable, maternal, neonatal, and nutritional diseases
Percent
of
total
DALYs
Age
Non-communicable diseases Injuries
What caused the most death and disability combined across age groups in 2016?
Percent of DALYs by age group, both sexes, 2016
[1.81]
[0.3] [0.31]
[0.46]
[0.57] [0.62] [0.7] [0.84]
[0.97] [1.18]
[1.45]
[1.8]
[2.2]
[2.75]
[3.29]
[3.71]
[4.22]
[4.58]
U
n
d
e
r
5
(
8
%
)
5
t
o
9
(
9
%
)
1
0
t
o
1
4
(
9
%
)
1
5
t
o
1
9
(
1
0
%
)
2
0
t
o
2
4
(
1
0
%
)
2
5
t
o
2
9
(
9
%
)
3
0
t
o
3
4
(
8
%
)
3
5
t
o
3
9
(
7
%
)
4
0
t
o
4
4
(
6
%
)
4
5
t
o
4
9
(
5
%
)
5
0
t
o
5
4
(
5
%
)
5
5
t
o
5
9
(
4
%
)
6
0
t
o
6
4
(
3
%
)
6
5
t
o
6
9
(
2
%
)
7
0
t
o
7
4
(
1
%
)
7
5
t
o
7
9
(
1
%
)
8
0
t
o
8
4
(
1
%
)
8
5
+
(
<
1
%
)
0
4
8
12
16
How have the leading causes of death and disability combined changed from 1990 to 2016?
Change in top 15 causes of DALYs, both sexes, ranked by number of DALYs, 1990–2016
What caused the most death and disability combined across age groups in 2016?
Percent of DALYs by age group, both sexes, 2016
Proportion of total disease burden from:
CMNNDs: 28.5% | NCDs: 58.8% | Injuries: 12.7%](https://image.slidesharecdn.com/indiahealthofthenationsstatesreport2017-230818115250-fe055a08/85/India_Health_of_the_Nation-s_States_Report_2017-pdf-117-320.jpg)
![114 Haryana
Risk factors 1990 Risk factors 2016
The percent figure in bracket next to each risk is DALYs from that risk out of total DALYs. *Malnutrition is child and maternal malnutrition.
†
WaSH is unsafe water, sanitation, and handwashing.
What risk factors are driving the most death and disability combined?
Contribution of top 10 risks to DALYs number, both sexes, ranked by number of DALYs, 19
same or increase decrease
Behavioural Environmental/occupational Metabolic
Malnutrition* [33.8%]
WaSH†
[15.0%]
Air pollution [11.5%]
Tobacco use [5.1%]
Dietary risks [4.7%]
High blood pressure [3.3%]
High total cholesterol [2.2%]
Occupational risks [2.2%]
High fasting plasma glucose [2.1%]
Alcohol & drug use [1.9%]
Malnutrition* [12.7%]
Air pollution [10.9%]
Dietary risks [9.9%]
High blood pressure [9.1%]
Tobacco use [8.4%]
High total cholesterol [6.3%]
High fasting plasma glucose [6.1%]
High body-mass index [4.7%]
Alcohol & drug use [4.6%]
Occupational risks [3.2%]
1
2
3
4
5
6
7
8
9
10
1
2
3
4
5
6
7
8
9
10
High body-mass index [1.0%] WaSH†
[2.7%]
12 12
Risk factors 1990 Risk factors 2016
The percent figure in bracket next to each risk is DALYs from that risk out of total DALYs. *Malnutrition is child and maternal malnutrition.
†
WaSH is unsafe water, sanitation, and handwashing.
What risk factors are driving the most death and disability combined?
Contribution of top 10 risks to DALYs number, both sexes, ranked by number of DALYs, 1990-2016
same or increase decrease
Behavioural Environmental/occupational Metabolic
Malnutrition* [32.2%]
WaSH†
[15.2%]
Air pollution [7.7%]
Tobacco use [3.6%]
Dietary risks [2.3%]
High blood pressure [2.2%]
Occupational risks [1.9%]
Alcohol & drug use [1.6%]
High fasting plasma glucose [1.4%]
Impaired kidney function [0.9%]
Malnutrition* [14.8%]
Air pollution [5.1%]
High blood pressure [5.0%]
Tobacco use [4.9%]
Dietary risks [4.7%]
High fasting plasma glucose [4.0%]
WaSH†
[3.9%]
Alcohol & drug use [3.9%]
Occupational risks [2.6%]
Impaired kidney function [2.0%]
1
2
3
4
5
6
7
8
9
10
1
2
3
4
5
6
7
8
9
10
Females
10 5 0 0
Occupational risks
Alcohol & drug use
High body-mass index
High fasting plasma glucose
High total cholesterol
Tobacco use
High blood pressure
Dietary risks
Air pollution
Malnutrition*
Males
15 10 15
5
Percent of years of life lost and years lived with disability Percent of years of life lost and years lived with disability
How did the risk factors differ by sex in 2016?
Percent of total DALYs attributable to top 10 risks, ranked by percent for both sexes combined, 2016
*Malnutrition is child and maternal malnutrition.
Behavioural Environmental/occupational Metabolic
What risk factors are driving the most death and disability combined?
Contribution of top 10 risks to DALYs number, both sexes, ranked by number of DALYs, 1990-2016](https://image.slidesharecdn.com/indiahealthofthenationsstatesreport2017-230818115250-fe055a08/85/India_Health_of_the_Nation-s_States_Report_2017-pdf-118-320.jpg)
![115
0
50
100
150
1990 1995 2000 2005 2010 2016
Year
Deaths
per
1,000
live
births
Himachal Pradesh under-5 rate India under-5 rate Comparative average rate globally for similar
Socio-demographic Index as Himachal Pradesh
39.2
27.2
20.9
How much did the under-5 mortality rate change from 1990 to 2016?
Under-5 mortality rate, both sexes combined, 1990-2016
2016 life expectancy
Females: 76.9 years Males: 71.0 years
1990 life expectancy
Females: 65.4 years Males: 64.2 years
Himachal Pradesh
1.2%
30.6%
2.4%
40.6%
1.4%
1.6%
0.9%
8.9%
1.8%
6.3%
4.4%
11.5%
8%
8.2%
11.8%
3%
2.8%
3.9%
14.4%
9.9%
15.4%
11.1%
5.8%
6.1%
16.4%
30.4%
16.2%
2.7%
2.9%
6.1%
3.1%
4.8%
5.5%
2.6%
13.4%
7.7%
28.4%
25.8%
2.1%
6%
6.2%
0.8%
5%
2.1%
0−14 years [6.1% of total deaths] 15−39 years [9.2% of total deaths]
40−69 years [35.5% of total deaths] 70+ years [49.3% of total deaths]
What caused the most deaths in different age groups in 2016?
Percent contribution of top 10 causes of death by age group, both sexes, 2016
HIV/AIDS & tuberculosis
Diarrhoea/LRI*/other
NTDs†
& malaria
Maternal disorders
Neonatal disorders
Nutritional deficiencies
Other communicable diseases
Cancers
Cardiovascular diseases
Chronic respiratory diseases
Cirrhosis
Digestive diseases
Neurological disorders
Diabetes/urog‡
/blood/endo§
Other non-communicable
Transport injuries
Unintentional injuries
Suicide & violence
Other causes of death
*LRI is lower respiratory infections.
†
NTDs are neglected tropical diseases.
‡
Urog is urogenital diseases.
§
Endo is endocrine diseases.
How much did the under-5 mortality rate change from 1990 to 2016?
Under-5 mortality rate, both sexes combined, 1990-2016
What caused the most deaths in different age groups in 2016?
Percent contribution of top 10 causes of death by age group, both sexes, 2016
Himachal Pradesh](https://image.slidesharecdn.com/indiahealthofthenationsstatesreport2017-230818115250-fe055a08/85/India_Health_of_the_Nation-s_States_Report_2017-pdf-119-320.jpg)
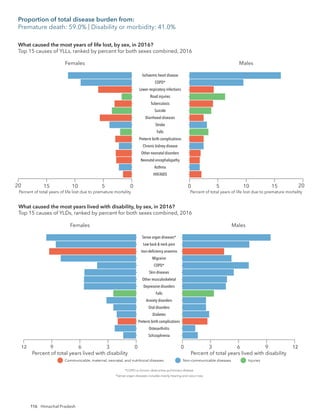
![117
Himachal Pradesh
Diarrhoeal diseases [15.0%]
Lower respiratory infections [7.0%]
COPD†
[5.3%]
Tuberculosis [4.8%]
Ischaemic heart disease [4.3%]
Preterm birth complications [4.1%]
Neonatal encephalopathy [3.9%]
Other neonatal disorders [3.2%]
Iron-deficiency anaemia [2.0%]
Sense organ diseases‡
[1.9%]
Stroke [1.8%]
Measles [1.8%]
Congenital birth defects [1.8%]
Asthma [1.7%]
Low back & neck pain [1.7%]
Falls [1.7%]
Road injuries [1.6%]
Self-harm§
[1.6%]
Skin diseases [1.5%]
Migraine [1.5%]
Ischaemic heart disease [8.7%]
COPD†
[7.7%]
Sense organ diseases‡
[3.9%]
Low back & neck pain [3.2%]
Road injuries [3.2%]
Lower respiratory infections [2.9%]
Iron-deficiency anaemia [2.9%]
Falls [2.8%]
Migraine [2.7%]
Diarrhoeal diseases [2.7%]
Preterm birth complications [2.5%]
Skin diseases [2.4%]
Tuberculosis [2.4%]
Stroke [2.3%]*
Self-harm§
[2.2%]*
Asthma [1.6%]
Other neonatal disorders [1.4%]
Congenital birth defects [1.4%]
Neonatal encephalopathy [1.3%]
Measles [0.1%]
1
2
3
4
5
6
7
8
9
10
11
12
13
14
15
1
2
3
4
5
6
7
8
9
10
11
12
13
14
15
20
22
23
21
18
19
16
17
97
20
Leading causes of DALYs 1990
How have the leading causes of death and disability combined changed from 1990 to 2016?
Change in top 15 causes of DALYs, both sexes, ranked by number of DALYs, 1990–2016
Leading causes of DALYs 2016
Communicable, maternal,
neonatal, and nutritional diseases
Non-communicable diseases Injuries same or increase decrease
*Change not significant.
The percent figure in brackets next to each cause is
DALYs from that cause out of total DALYs.
†
COPD is chronic obstructive pulmonary disease.
‡
Sense organ diseases includes mainly hearing and vision loss.
§
Self-harm refers to suicide and the nonfatal outcomes of self-harm.
[1.69]
[0.32]
[0.32]
[0.45]
[0.54]
[0.6]
[0.68] [0.78] [0.89]
[1.07]
[1.3]
[1.62]
[2.0]
[2.49]
[2.94]
[3.38]
[4.02]
[4.67]
The number in the bracket on top of each vertical bar is the ratio of percent DALYs to population for that age group.
The number in parentheses after each age group on the x-axis is the percent of population in that age group.
Communicable, maternal, neonatal, and nutritional diseases
Percent
of
total
DALYs
Age
Non-communicable diseases Injuries
What caused the most death and disability combined across age groups in 2016?
Percent of DALYs by age group, both sexes, 2016
U
n
d
e
r
5
(
6
%
)
5
t
o
9
(
8
%
)
1
0
t
o
1
4
(
8
%
)
1
5
t
o
1
9
(
9
%
)
2
0
t
o
2
4
(
9
%
)
2
5
t
o
2
9
(
9
%
)
3
0
t
o
3
4
(
9
%
)
3
5
t
o
3
9
(
8
%
)
4
0
t
o
4
4
(
7
%
)
4
5
t
o
4
9
(
6
%
)
5
0
t
o
5
4
(
6
%
)
5
5
t
o
5
9
(
5
%
)
6
0
t
o
6
4
(
4
%
)
6
5
t
o
6
9
(
2
%
)
7
0
t
o
7
4
(
2
%
)
7
5
t
o
7
9
(
1
%
)
8
0
t
o
8
4
(
1
%
)
8
5
+
(
1
%
)
0
2.5
5.0
7.5
10.0
12.5
How have the leading causes of death and disability combined changed from 1990 to 2016?
Change in top 15 causes of DALYs, both sexes, ranked by number of DALYs, 1990–2016
What caused the most death and disability combined across age groups in 2016?
Percent of DALYs by age group, both sexes, 2016
Proportion of total disease burden from:
CMNNDs: 23.1% | NCDs: 64.5% | Injuries: 12.4%](https://image.slidesharecdn.com/indiahealthofthenationsstatesreport2017-230818115250-fe055a08/85/India_Health_of_the_Nation-s_States_Report_2017-pdf-121-320.jpg)
![118 Himachal Pradesh
Risk factors 1990 Risk factors 2016
The percent figure in bracket next to each risk is DALYs from that risk out of total DALYs. *Malnutrition is child and maternal malnutrition.
†
WaSH is unsafe water, sanitation, and handwashing.
What risk factors are driving the most death and disability combined?
Contribution of top 10 risks to DALYs number, both sexes, ranked by number of DALYs, 19
same or increase decrease
Behavioural Environmental/occupational Metabolic
Malnutrition* [30.0%]
WaSH†
[14.9%]
Air pollution [10.5%]
Dietary risks [4.9%]
Tobacco use [4.9%]
High blood pressure [4.7%]
Occupational risks [2.7%]
High total cholesterol [2.0%]
Alcohol & drug use [1.9%]
High fasting plasma glucose [1.9%]
Malnutrition* [9.2%]
High blood pressure [8.7%]
Air pollution [8.2%]
Dietary risks [8.0%]
Tobacco use [6.5%]
High fasting plasma glucose [4.7%]
High total cholesterol [4.4%]
Alcohol & drug use [4.1%]
Occupational risks [4.0%]
High body-mass index [3.4%]
1
2
3
4
5
6
7
8
9
10
1
2
3
4
5
6
7
8
9
10
High body-mass index [0.8%] WaSH†
[2.4%]
12 12
Risk factors 1990 Risk factors 2016
The percent figure in bracket next to each risk is DALYs from that risk out of total DALYs. *Malnutrition is child and maternal malnutrition.
†
WaSH is unsafe water, sanitation, and handwashing.
What risk factors are driving the most death and disability combined?
Contribution of top 10 risks to DALYs number, both sexes, ranked by number of DALYs, 1990-2016
same or increase decrease
Behavioural Environmental/occupational Metabolic
Malnutrition* [32.2%]
WaSH†
[15.2%]
Air pollution [7.7%]
Tobacco use [3.6%]
Dietary risks [2.3%]
High blood pressure [2.2%]
Occupational risks [1.9%]
Alcohol & drug use [1.6%]
High fasting plasma glucose [1.4%]
Impaired kidney function [0.9%]
Malnutrition* [14.8%]
Air pollution [5.1%]
High blood pressure [5.0%]
Tobacco use [4.9%]
Dietary risks [4.7%]
High fasting plasma glucose [4.0%]
WaSH†
[3.9%]
Alcohol & drug use [3.9%]
Occupational risks [2.6%]
Impaired kidney function [2.0%]
1
2
3
4
5
6
7
8
9
10
1
2
3
4
5
6
7
8
9
10
Females
5 2.5 0 0
High body-mass index
Occupational risks
Alcohol & drug use
High total cholesterol
High fasting plasma glucose
Tobacco use
Dietary risks
Air pollution
High blood pressure
Malnutrition*
Males
7.5 5 7.5 10
2.5
10
12.5 12.5
Percent of years of life lost and years lived with disability Percent of years of life lost and years lived with disability
How did the risk factors differ by sex in 2016?
Percent of total DALYs attributable to top 10 risks, ranked by percent for both sexes combined, 2016
*Malnutrition is child and maternal malnutrition.
Behavioural Environmental/occupational Metabolic
What risk factors are driving the most death and disability combined?
Contribution of top 10 risks to DALYs number, both sexes, ranked by number of DALYs, 1990-2016](https://image.slidesharecdn.com/indiahealthofthenationsstatesreport2017-230818115250-fe055a08/85/India_Health_of_the_Nation-s_States_Report_2017-pdf-122-320.jpg)
![119
0
50
100
150
1990 1995 2000 2005 2010 2016
Year
Deaths
per
1,000
live
births
Jammu and Kashmir under-5 rate India under-5 rate Comparative average rate globally for similar
Socio-demographic Index as Jammu and Kashmir
39.2
32.1
31
How much did the under-5 mortality rate change from 1990 to 2016?
Under-5 mortality rate, both sexes combined, 1990-2016
2016 life expectancy
Females: 71.8 years Males: 68.3 years
1990 life expectancy
Females: 60.9 years Males: 60.2 years
Jammu and Kashmir
32%
2.5%
36.4%
1.2%
2.8%
1.7%
1%
8.9%
2.8%
6.6%
4.2% 6.5%
7.5%
3.2%
7.6%
15.4%
2.6%
4.9%
20.9%
9.9%
10.2%
11.2%
3.9%
6.3%
14.9%
36%
14.4%
2.2%
2%
7.3%
4.9%
3.8%
4.5%
2.3%
14.2%
7.5%
37.4%
19.2%
1.5%
4.1%
7.6%
1.1%
3.2%
1.9%
0−14 years [8% of total deaths] 15−39 years [12.1% of total deaths]
40−69 years [37.8% of total deaths] 70+ years [42.1% of total deaths]
What caused the most deaths in different age groups in 2016?
Percent contribution of top 10 causes of death by age group, both sexes, 2016
HIV/AIDS & tuberculosis
Diarrhoea/LRI*/other
NTDs†
& malaria
Maternal disorders
Neonatal disorders
Nutritional deficiencies
Other communicable diseases
Cancers
Cardiovascular diseases
Chronic respiratory diseases
Cirrhosis
Digestive diseases
Neurological disorders
Diabetes/urog‡
/blood/endo§
Other non-communicable
Transport injuries
Unintentional injuries
Suicide & violence
Other causes of death
*LRI is lower respiratory infections.
†
NTDs are neglected tropical diseases.
‡
Urog is urogenital diseases.
§
Endo is endocrine diseases.
How much did the under-5 mortality rate change from 1990 to 2016?
Under-5 mortality rate, both sexes combined, 1990-2016
What caused the most deaths in different age groups in 2016?
Percent contribution of top 10 causes of death by age group, both sexes, 2016
Jammu and Kashmir](https://image.slidesharecdn.com/indiahealthofthenationsstatesreport2017-230818115250-fe055a08/85/India_Health_of_the_Nation-s_States_Report_2017-pdf-123-320.jpg)
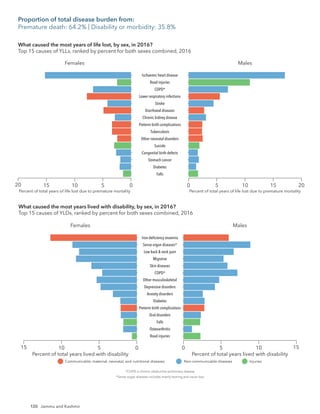
![121
Jammu and Kashmir
Ischaemic heart disease [10.7%]
COPD†
[6.5%]
Road injuries [5.3%]
Lower respiratory infections [4.2%]
Iron-deficiency anaemia [3.1%]
Sense organ diseases‡
[3.1%]
Stroke [3.0%]*
Diarrhoeal diseases [2.7%]
Preterm birth complications [2.7%]
Low back & neck pain [2.6%]
Migraine [2.4%]
Chronic kidney disease [2.3%]
Skin diseases [2.2%]
Diabetes [1.9%]
Tuberculosis [1.9%]
Congenital birth defects [1.7%]
Other neonatal disorders [1.6%]
Neonatal encephalopathy [1.0%]
Neonatal haemolytic disease [0.5%]
Measles [0.2%]
Diarrhoeal diseases [11.3%]
Lower respiratory infections [9.9%]
Ischaemic heart disease [5.2%]
Preterm birth complications [4.5%]
COPD†
[4.2%]
Tuberculosis [4.0%]
Road injuries [3.4%]
Other neonatal disorders [3.0%]
Measles [2.8%]
Neonatal encephalopathy [2.6%]
Stroke [2.2%]
Congenital birth defects [2.1%]
Iron-deficiency anaemia [2.0%]
Neonatal haemolytic disease [1.6%]
Sense organ diseases‡
[1.5%]
Low back & neck pain [1.4%]
Chronic kidney disease [1.3%]
Skin diseases [1.2%]
Migraine [1.2%]
Diabetes [0.6%]
1
2
3
4
5
6
7
8
9
10
11
12
13
14
15
1
2
3
4
5
6
7
8
9
10
11
12
13
14
15
18
25
42
20
20
21
16
19
73
40
Leading causes of DALYs 1990
How have the leading causes of death and disability combined changed from 1990 to 2016?
Change in top 15 causes of DALYs, both sexes, ranked by number of DALYs, 1990–2016
Leading causes of DALYs 2016
Communicable, maternal,
neonatal, and nutritional diseases
Non-communicable diseases Injuries same or increase decrease
*Change not significant.
The percent figure in brackets next to each cause is
DALYs from that cause out of total DALYs.
†
COPD is chronic obstructive pulmonary disease.
‡
Sense organ diseases includes mainly hearing and vision loss.
§
Self-harm refers to suicide and the nonfatal outcomes of self-harm.
[1.88]
[0.33] [0.34]
[0.49]
[0.59]
[0.65]
[0.72] [0.85] [0.98] [1.2]
[1.5] [1.86] [2.33]
[2.9]
[3.51]
[3.98]
[4.62]
[5.15]
The number in the bracket on top of each vertical bar is the ratio of percent DALYs to population for that age group.
The number in parentheses after each age group on the x-axis is the percent of population in that age group.
Communicable, maternal, neonatal, and nutritional diseases
Percent
of
total
DALYs
Age
Non-communicable diseases Injuries
What caused the most death and disability combined across age groups in 2016?
Percent of DALYs by age group, both sexes, 2016
U
n
d
e
r
5
(
7
%
)
5
t
o
9
(
1
1
%
)
1
0
t
o
1
4
(
1
1
%
)
1
5
t
o
1
9
(
1
0
%
)
2
0
t
o
2
4
(
9
%
)
2
5
t
o
2
9
(
9
%
)
3
0
t
o
3
4
(
8
%
)
3
5
t
o
3
9
(
7
%
)
4
0
t
o
4
4
(
6
%
)
4
5
t
o
4
9
(
5
%
)
5
0
t
o
5
4
(
5
%
)
5
5
t
o
5
9
(
4
%
)
6
0
t
o
6
4
(
3
%
)
6
5
t
o
6
9
(
2
%
)
7
0
t
o
7
4
(
1
%
)
7
5
t
o
7
9
(
1
%
)
8
0
t
o
8
4
(
1
%
)
8
5
+
(
<
1
%
)
0
5
10
How have the leading causes of death and disability combined changed from 1990 to 2016?
Change in top 15 causes of DALYs, both sexes, ranked by number of DALYs, 1990–2016
What caused the most death and disability combined across age groups in 2016?
Percent of DALYs by age group, both sexes, 2016
Proportion of total disease burden from:
CMNNDs: 25.3% | NCDs: 61.3% | Injuries: 13.4%](https://image.slidesharecdn.com/indiahealthofthenationsstatesreport2017-230818115250-fe055a08/85/India_Health_of_the_Nation-s_States_Report_2017-pdf-125-320.jpg)
![122 Jammu and Kashmir
Risk factors 1990 Risk factors 2016
The percent figure in bracket next to each risk is DALYs from that risk out of total DALYs. *Malnutrition is child and maternal malnutrition.
†
WaSH is unsafe water, sanitation, and handwashing.
What risk factors are driving the most death and disability combined?
Contribution of top 10 risks to DALYs number, both sexes, ranked by number of DALYs, 19
same or increase decrease
Behavioural Environmental/occupational Metabolic
Malnutrition* [30.6%]
Air pollution [12.4%]
WaSH†
[11.7%]
Tobacco use [7.2%]
Dietary risks [6.0%]
High blood pressure [4.8%]
Occupational risks [2.4%]
High total cholesterol [2.3%]
High fasting plasma glucose [2.1%]
Impaired kidney function [2.0%]
Malnutrition* [10.9%]
Dietary risks [10.4%]
Tobacco use [10.0%]
Air pollution [10.0%]
High blood pressure [9.9%]
High fasting plasma glucose [5.4%]
High body-mass index [5.2%]
High total cholesterol [5.1%]
Occupational risks [3.5%]
Impaired kidney function [3.5%]
1
2
3
4
5
6
7
8
9
10
1
2
3
4
5
6
7
8
9
10
High body-mass index [1.3%] WaSH†
[2.6%]
12 12
Risk factors 1990 Risk factors 2016
The percent figure in bracket next to each risk is DALYs from that risk out of total DALYs. *Malnutrition is child and maternal malnutrition.
†
WaSH is unsafe water, sanitation, and handwashing.
What risk factors are driving the most death and disability combined?
Contribution of top 10 risks to DALYs number, both sexes, ranked by number of DALYs, 1990-2016
same or increase decrease
Behavioural Environmental/occupational Metabolic
Malnutrition* [32.2%]
WaSH†
[15.2%]
Air pollution [7.7%]
Tobacco use [3.6%]
Dietary risks [2.3%]
High blood pressure [2.2%]
Occupational risks [1.9%]
Alcohol & drug use [1.6%]
High fasting plasma glucose [1.4%]
Impaired kidney function [0.9%]
Malnutrition* [14.8%]
Air pollution [5.1%]
High blood pressure [5.0%]
Tobacco use [4.9%]
Dietary risks [4.7%]
High fasting plasma glucose [4.0%]
WaSH†
[3.9%]
Alcohol & drug use [3.9%]
Occupational risks [2.6%]
Impaired kidney function [2.0%]
1
2
3
4
5
6
7
8
9
10
1
2
3
4
5
6
7
8
9
10
Females
5 0 0
Impaired kidney function
Occupational risks
High total cholesterol
High body-mass index
High fasting plasma glucose
High blood pressure
Air pollution
Tobacco use
Dietary risks
Malnutrition*
Males
10
5
10
Percent of years of life lost and years lived with disability Percent of years of life lost and years lived with disability
How did the risk factors differ by sex in 2016?
Percent of total DALYs attributable to top 10 risks, ranked by percent for both sexes combined, 2016
*Malnutrition is child and maternal malnutrition.
Behavioural Environmental/occupational Metabolic
What risk factors are driving the most death and disability combined?
Contribution of top 10 risks to DALYs number, both sexes, ranked by number of DALYs, 1990-2016](https://image.slidesharecdn.com/indiahealthofthenationsstatesreport2017-230818115250-fe055a08/85/India_Health_of_the_Nation-s_States_Report_2017-pdf-126-320.jpg)
![123
0
50
100
150
1990 1995 2000 2005 2010 2016
Year
Deaths
per
1,000
live
births
Jharkhand under-5 rate India under-5 rate Comparative average rate globally for similar
Socio-demographic Index as Jharkhand
39.2
43.1
45
How much did the under-5 mortality rate change from 1990 to 2016?
Under-5 mortality rate, both sexes combined, 1990-2016
2016 life expectancy
Females: 67.8 years Males: 67.0 years
1990 life expectancy
Females: 57.7 years Males: 57.2 years
Jharkhand
1.3%
39.4%
4.8%
32.8%
2%
1.6%
1%
5.9%
1.4%
6.2%
3.7%
14.1%
15%
4.3%
5.4%
9.8%
4.1%
3.7%
11%
10.3%
9%
13.4%
8.4%
16.1%
11%
28.9%
8.6%
3.9%
4.1%
6.6%
2.9%
4.4%
5.3% 4.1%
33.2%
5.6%
27.2%
10.1%
1.1%
2.7%
3.4%
6.5%
3.6%
2.4%
0−14 years [13% of total deaths] 15−39 years [12.3% of total deaths]
40−69 years [41.2% of total deaths] 70+ years [33.5% of total deaths]
What caused the most deaths in different age groups in 2016?
Percent contribution of top 10 causes of death by age group, both sexes, 2016
HIV/AIDS & tuberculosis
Diarrhoea/LRI*/other
NTDs†
& malaria
Maternal disorders
Neonatal disorders
Nutritional deficiencies
Other communicable diseases
Cancers
Cardiovascular diseases
Chronic respiratory diseases
Cirrhosis
Digestive diseases
Neurological disorders
Diabetes/urog‡
/blood/endo§
Other non-communicable
Transport injuries
Unintentional injuries
Suicide & violence
Other causes of death
*LRI is lower respiratory infections.
†
NTDs are neglected tropical diseases.
‡
Urog is urogenital diseases.
§
Endo is endocrine diseases.
How much did the under-5 mortality rate change from 1990 to 2016?
Under-5 mortality rate, both sexes combined, 1990-2016
What caused the most deaths in different age groups in 2016?
Percent contribution of top 10 causes of death by age group, both sexes, 2016
Jharkhand](https://image.slidesharecdn.com/indiahealthofthenationsstatesreport2017-230818115250-fe055a08/85/India_Health_of_the_Nation-s_States_Report_2017-pdf-127-320.jpg)
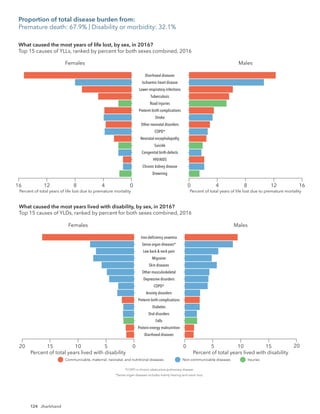
![125
Jharkhand
Diarrhoeal diseases [9.8%]
Ischaemic heart disease [6.6%]
Lower respiratory infections [4.5%]
Iron-deficiency anaemia [4.2%]
Tuberculosis [3.8%]
Preterm birth complications [3.3%]
COPD†
[3.3%]
Road injuries [2.9%]
Stroke [2.7%]
Sense organ diseases‡
[2.6%]
Other neonatal disorders [2.3%]
Low back & neck pain [2.0%]
Skin diseases [1.9%]
Migraine [1.9%]
Diabetes [1.8%]
Neonatal encephalopathy [1.7%]
Congenital birth defects [1.6%]*
Drowning [1.1%]
Malaria [0.9%]*
Measles [0.5%]
Leishmaniasis [0.4%]
Tetanus [0.1%]
Diarrhoeal diseases [13.5%]
Lower respiratory infections [10.5%]
Measles [5.5%]
Tuberculosis [5.2%]
Preterm birth complications [4.8%]
Other neonatal disorders [3.9%]
Tetanus [3.1%]
Neonatal encephalopathy [2.9%]
Ischaemic heart disease [2.7%]
Iron-deficiency anaemia [2.2%]
Malaria [1.7%]
Leishmaniasis [1.7%]
Drowning [1.7%]
Stroke [1.6%]
Congenital birth defects [1.6%]
Road injuries [1.5%]
COPD†
[1.5%]
Sense organ diseases‡
[1.2%]
Low back & neck pain [1.0%]
Skin diseases [1.0%]
Migraine [0.9%]
Diabetes [0.6%]
1
2
3
4
5
6
7
8
9
10
11
12
13
14
15
1
2
3
4
5
6
7
8
9
10
11
12
13
14
15
16
24
29
17
20
24
16
17
44
26
28
38
57
99
Leading causes of DALYs 1990
How have the leading causes of death and disability combined changed from 1990 to 2016?
Change in top 15 causes of DALYs, both sexes, ranked by number of DALYs, 1990–2016
Leading causes of DALYs 2016
Communicable, maternal,
neonatal, and nutritional diseases
Non-communicable diseases Injuries same or increase decrease
*Change not significant.
The percent figure in brackets next to each cause is
DALYs from that cause out of total DALYs.
†
COPD is chronic obstructive pulmonary disease.
‡
Sense organ diseases includes mainly hearing and vision loss.
§
Self-harm refers to suicide and the nonfatal outcomes of self-harm.
[2.25]
[0.35]
[0.34] [0.48]
[0.59]
[0.64]
[0.71] [0.83] [0.95] [1.15]
[1.43]
[1.76]
[2.21]
[2.79]
[3.38]
[3.85]
[4.38]
[4.77]
The number in the bracket on top of each vertical bar is the ratio of percent DALYs to population for that age group.
The number in parentheses after each age group on the x-axis is the percent of population in that age group.
Communicable, maternal, neonatal, and nutritional diseases
Percent
of
total
DALYs
Age
Non-communicable diseases Injuries
What caused the most death and disability combined across age groups in 2016?
Percent of DALYs by age group, both sexes, 2016
U
n
d
e
r
5
(
9
%
)
5
t
o
9
(
1
4
%
)
1
0
t
o
1
4
(
1
2
%
)
1
5
t
o
1
9
(
9
%
)
2
0
t
o
2
4
(
8
%
)
2
5
t
o
2
9
(
8
%
)
3
0
t
o
3
4
(
8
%
)
3
5
t
o
3
9
(
7
%
)
4
0
t
o
4
4
(
5
%
)
4
5
t
o
4
9
(
5
%
)
5
0
t
o
5
4
(
4
%
)
5
5
t
o
5
9
(
4
%
)
6
0
t
o
6
4
(
3
%
)
6
5
t
o
6
9
(
2
%
)
7
0
t
o
7
4
(
1
%
)
7
5
t
o
7
9
(
1
%
)
8
0
t
o
8
4
(
<
1
%
)
8
5
+
(
<
1
%
)
0
5
15
20
10
How have the leading causes of death and disability combined changed from 1990 to 2016?
Change in top 15 causes of DALYs, both sexes, ranked by number of DALYs, 1990–2016
What caused the most death and disability combined across age groups in 2016?
Percent of DALYs by age group, both sexes, 2016
Proportion of total disease burden from:
CMNNDs: 40.8% | NCDs: 48.3% | Injuries: 10.9%](https://image.slidesharecdn.com/indiahealthofthenationsstatesreport2017-230818115250-fe055a08/85/India_Health_of_the_Nation-s_States_Report_2017-pdf-129-320.jpg)
![126 Jharkhand
Risk factors 1990 Risk factors 2016
The percent figure in bracket next to each risk is DALYs from that risk out of total DALYs. *Malnutrition is child and maternal malnutrition.
†
WaSH is unsafe water, sanitation, and handwashing.
What risk factors are driving the most death and disability combined?
Contribution of top 10 risks to DALYs number, both sexes, ranked by number of DALYs, 19
same or increase decrease
Behavioural Environmental/occupational Metabolic
Malnutrition* [37.7%]
WaSH†
[14.1%]
Air pollution [10.3%]
Dietary risks [3.5%]
High blood pressure [3.3%]
Tobacco use [3.0%]
High fasting plasma glucose [1.8%]
Occupational risks [1.6%]
Alcohol & drug use [1.2%]
Impaired kidney function [1.1%]
Malnutrition* [17.1%]
WaSH†
[9.5%]
Air pollution [8.9%]
Dietary risks [6.9%]
High blood pressure [6.9%]
High fasting plasma glucose [4.5%]
Tobacco use [2.9%]
Occupational risks [2.6%]
Alcohol & drug use [2.6%]
High body-mass index [2.4%]
1
2
3
4
5
6
7
8
9
10
1
2
3
4
5
6
7
8
9
10
High body-mass index [0.5%] Impaired kidney function [2.2%]
12 12
Risk factors 1990 Risk factors 2016
The percent figure in bracket next to each risk is DALYs from that risk out of total DALYs. *Malnutrition is child and maternal malnutrition.
†
WaSH is unsafe water, sanitation, and handwashing.
What risk factors are driving the most death and disability combined?
Contribution of top 10 risks to DALYs number, both sexes, ranked by number of DALYs, 1990-2016
same or increase decrease
Behavioural Environmental/occupational Metabolic
Malnutrition* [32.2%]
WaSH†
[15.2%]
Air pollution [7.7%]
Tobacco use [3.6%]
Dietary risks [2.3%]
High blood pressure [2.2%]
Occupational risks [1.9%]
Alcohol & drug use [1.6%]
High fasting plasma glucose [1.4%]
Impaired kidney function [0.9%]
Malnutrition* [14.8%]
Air pollution [5.1%]
High blood pressure [5.0%]
Tobacco use [4.9%]
Dietary risks [4.7%]
High fasting plasma glucose [4.0%]
WaSH†
[3.9%]
Alcohol & drug use [3.9%]
Occupational risks [2.6%]
Impaired kidney function [2.0%]
1
2
3
4
5
6
7
8
9
10
1
2
3
4
5
6
7
8
9
10
Females
5
10 0
High body-mass index
Alcohol & drug use
Occupational risks
Tobacco use
High fasting plasma glucose
High blood pressure
Dietary risks
Air pollution
WaSH†
Malnutrition*
Males
15
20 15
10 20
5
0
Percent of years of life lost and years lived with disability Percent of years of life lost and years lived with disability
How did the risk factors differ by sex in 2016?
Percent of total DALYs attributable to top 10 risks, ranked by percent for both sexes combined, 2016
Behavioural Environmental/occupational Metabolic
*Malnutrition is child and maternal malnutrition.
†
WaSH is unsafe water, sanitation, and handwashing.
What risk factors are driving the most death and disability combined?
Contribution of top 10 risks to DALYs number, both sexes, ranked by number of DALYs, 1990-2016](https://image.slidesharecdn.com/indiahealthofthenationsstatesreport2017-230818115250-fe055a08/85/India_Health_of_the_Nation-s_States_Report_2017-pdf-130-320.jpg)
![127
0
50
100
150
1990 1995 2000 2005 2010 2016
Year
Deaths
per
1,000
live
births
Karnataka under-5 rate India under-5 rate Comparative average rate globally for similar
Socio-demographic Index as Karnataka
39.2
32.2
28.5
How much did the under-5 mortality rate change from 1990 to 2016?
Under-5 mortality rate, both sexes combined, 1990-2016
2016 life expectancy
Females: 71.1 years Males: 67.1 years
1990 life expectancy
Females: 62.5 years Males: 59.0 years
Karnataka
1.2%
23.7%
2.2%
44.9%
1.3%
1.2%
1.3%
12.3%
1.4%
5.7%
4.6%
9.9%
7.4%
2.3%
6.5%
13.9%
4.3%
4.5%
10.1%
8.2%
22.9%
9.8%
4.8%
6.7%
13.7%
37.2%
10.6%
4%
8.8%
2.5%
3.5%
3.4%
4.8%
1.7%
16.1%
7%
36.8%
13.9%
1.1%
1.3%
3.9%
11.9%
3.9%
2.3%
0−14 years [7% of total deaths] 15−39 years [11.4% of total deaths]
40−69 years [41.6% of total deaths] 70+ years [40% of total deaths]
What caused the most deaths in different age groups in 2016?
Percent contribution of top 10 causes of death by age group, both sexes, 2016
HIV/AIDS & tuberculosis
Diarrhoea/LRI*/other
NTDs†
& malaria
Maternal disorders
Neonatal disorders
Nutritional deficiencies
Other communicable diseases
Cancers
Cardiovascular diseases
Chronic respiratory diseases
Cirrhosis
Digestive diseases
Neurological disorders
Diabetes/urog‡
/blood/endo§
Other non-communicable
Transport injuries
Unintentional injuries
Suicide & violence
Other causes of death
*LRI is lower respiratory infections.
†
NTDs are neglected tropical diseases.
‡
Urog is urogenital diseases.
§
Endo is endocrine diseases.
How much did the under-5 mortality rate change from 1990 to 2016?
Under-5 mortality rate, both sexes combined, 1990-2016
What caused the most deaths in different age groups in 2016?
Percent contribution of top 10 causes of death by age group, both sexes, 2016
Karnataka](https://image.slidesharecdn.com/indiahealthofthenationsstatesreport2017-230818115250-fe055a08/85/India_Health_of_the_Nation-s_States_Report_2017-pdf-131-320.jpg)
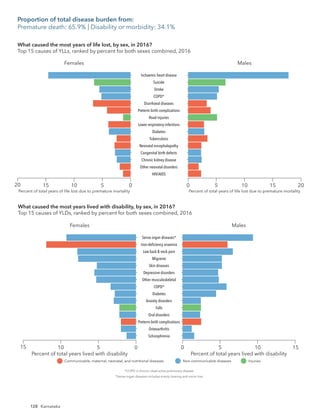
![129
Karnataka
Diarrhoeal diseases [11.7%]
Preterm birth complications [7.9%]
Lower respiratory infections [6.6%]
Ischaemic heart disease [4.8%]
Other neonatal disorders [4.0%]
Tuberculosis [3.8%]
Measles [3.8%]
Neonatal encephalopathy [3.6%]
COPD†
[3.6%]
Congenital birth defects [3.0%]
Self-harm§
[2.9%]
Stroke [2.3%]
Iron-deficiency anaemia [2.1%]
Sense organ diseases‡
[1.6%]
Asthma [1.5%]
Low back & neck pain [1.4%]
Road injuries [1.3%]
Migraine [1.2%]
Diabetes [1.1%]
Ischaemic heart disease [11.0%]
COPD†
[4.9%]
Self-harm§
[4.3%]
Stroke [3.8%]
Diarrhoeal diseases [3.5%]
Preterm birth complications [3.4%]
Diabetes [3.4%]
Sense organ diseases‡
[3.2%]
Iron-deficiency anaemia [3.1%]
Road injuries [2.7%]
Low back & neck pain [2.5%]
Migraine [2.2%]
Lower respiratory infections [2.2%]
Tuberculosis [2.1%]
Congenital birth defects [2.0%]
Neonatal encephalopathy [1.7%]
Other neonatal disorders [1.3%]
Asthma [1.3%]
Measles [0.2%]
1
2
3
4
5
6
7
8
9
10
11
12
13
14
15
1
2
3
4
5
6
7
8
9
10
11
12
13
14
15
21
24
74
23
21
23
17
18
Leading causes of DALYs 1990
How have the leading causes of death and disability combined changed from 1990 to 2016?
Change in top 15 causes of DALYs, both sexes, ranked by number of DALYs, 1990–2016
Leading causes of DALYs 2016
Communicable, maternal,
neonatal, and nutritional diseases
Non-communicable diseases Injuries same or increase decrease
*Change not significant.
The percent figure in brackets next to each cause is
DALYs from that cause out of total DALYs.
†
COPD is chronic obstructive pulmonary disease.
‡
Sense organ diseases includes mainly hearing and vision loss.
§
Self-harm refers to suicide and the nonfatal outcomes of self-harm.
[1.73]
[0.29] [0.3]
[0.44]
[0.54]
[0.6] [0.68]
[0.8] [0.92]
[1.11]
[1.36]
[1.7] [2.1]
[2.65]
[3.17]
[3.6]
[4.12]
[4.58]
The number in the bracket on top of each vertical bar is the ratio of percent DALYs to population for that age group.
The number in parentheses after each age group on the x-axis is the percent of population in that age group.
Communicable, maternal, neonatal, and nutritional diseases
Percent
of
total
DALYs
Age
Non-communicable diseases Injuries
What caused the most death and disability combined across age groups in 2016?
Percent of DALYs by age group, both sexes, 2016
U
n
d
e
r
5
(
7
%
)
5
t
o
9
(
8
%
)
1
0
t
o
1
4
(
8
%
)
1
5
t
o
1
9
(
9
%
)
2
0
t
o
2
4
(
1
0
%
)
2
5
t
o
2
9
(
1
0
%
)
3
0
t
o
3
4
(
8
%
)
3
5
t
o
3
9
(
8
%
)
4
0
t
o
4
4
(
7
%
)
4
5
t
o
4
9
(
6
%
)
5
0
t
o
5
4
(
5
%
)
5
5
t
o
5
9
(
4
%
)
6
0
t
o
6
4
(
4
%
)
6
5
t
o
6
9
(
3
%
)
7
0
t
o
7
4
(
2
%
)
7
5
t
o
7
9
(
1
%
)
8
0
t
o
8
4
(
1
%
)
8
5
+
(
<
1
%
)
0
5
10
How have the leading causes of death and disability combined changed from 1990 to 2016?
Change in top 15 causes of DALYs, both sexes, ranked by number of DALYs, 1990–2016
What caused the most death and disability combined across age groups in 2016?
Percent of DALYs by age group, both sexes, 2016
Proportion of total disease burden from:
CMNNDs: 25.1% | NCDs: 62.0% | Injuries: 12.9%](https://image.slidesharecdn.com/indiahealthofthenationsstatesreport2017-230818115250-fe055a08/85/India_Health_of_the_Nation-s_States_Report_2017-pdf-133-320.jpg)
![130 Karnataka
Risk factors 1990 Risk factors 2016
The percent figure in brackets next to each risk is DALYs from that risk out of total DALYs. *Malnutrition is child and maternal malnutrition.
†
WaSH is unsafe water, sanitation, and handwashing.
What risk factors are driving the most death and disability combined?
Contribution of top 10 risks to DALYs number, both sexes, ranked by number of DALYs, 19
same or increase decrease
Behavioural Environmental/occupational Metabolic
Malnutrition* [34.3%]
WaSH†
[11.7%]
Air pollution [9.1%]
Dietary risks [5.2%]
High blood pressure [4.7%]
Tobacco use [4.1%]
High fasting plasma glucose [3.2%]
Occupational risks [2.3%]
High total cholesterol [2.2%]
Alcohol & drug use [1.8%]
Malnutrition* [10.7%]
High blood pressure [10.5%]
Dietary risks [9.6%]
High fasting plasma glucose [8.3%]
Air pollution [8.2%]
Tobacco use [5.5%]
High total cholesterol [5.4%]
Alcohol & drug use [4.1%]
Occupational risks [3.3%]
Impaired kidney function [3.3%]
1
2
3
4
5
6
7
8
9
10
1
2
3
4
5
6
7
8
9
10
Impaired kidney function [1.6%] WaSH†
[3.3%]
11 11
Risk factors 1990 Risk factors 2016
The percent figure in bracket next to each risk is DALYs from that risk out of total DALYs. *Malnutrition is child and maternal malnutrition.
†
WaSH is unsafe water, sanitation, and handwashing.
What risk factors are driving the most death and disability combined?
Contribution of top 10 risks to DALYs number, both sexes, ranked by number of DALYs, 1990-2016
same or increase decrease
Behavioural Environmental/occupational Metabolic
Malnutrition* [32.2%]
WaSH†
[15.2%]
Air pollution [7.7%]
Tobacco use [3.6%]
Dietary risks [2.3%]
High blood pressure [2.2%]
Occupational risks [1.9%]
Alcohol & drug use [1.6%]
High fasting plasma glucose [1.4%]
Impaired kidney function [0.9%]
Malnutrition* [14.8%]
Air pollution [5.1%]
High blood pressure [5.0%]
Tobacco use [4.9%]
Dietary risks [4.7%]
High fasting plasma glucose [4.0%]
WaSH†
[3.9%]
Alcohol & drug use [3.9%]
Occupational risks [2.6%]
Impaired kidney function [2.0%]
1
2
3
4
5
6
7
8
9
10
1
2
3
4
5
6
7
8
9
10
Females
5
10 0
Impaired kidney function
Occupational risks
Alcohol & drug use
High total cholesterol
Tobacco use
Air pollution
High fasting plasma glucose
Dietary risks
High blood pressure
Malnutrition*
Males
5
0 10
Percent of years of life lost and years lived with disability Percent of years of life lost and years lived with disability
How did the risk factors differ by sex in 2016?
Percent of total DALYs attributable to top 10 risks, ranked by percent for both sexes combined, 2016
Behavioural Environmental/occupational Metabolic
*Malnutrition is child and maternal malnutrition.
What risk factors are driving the most death and disability combined?
Contribution of top 10 risks to DALYs number, both sexes, ranked by number of DALYs, 1990-2016](https://image.slidesharecdn.com/indiahealthofthenationsstatesreport2017-230818115250-fe055a08/85/India_Health_of_the_Nation-s_States_Report_2017-pdf-134-320.jpg)
![131
0
50
100
150
1990 1995 2000 2005 2010 2016
Year
Deaths
per
1,000
live
births
Kerala under-5 rate India under-5 rate Comparative average rate globally for similar
Socio-demographic Index as Kerala
39.2
12.8
19.1
How much did the under-5 mortality rate change from 1990 to 2016?
Under-5 mortality rate, both sexes combined, 1990-2016
2016 life expectancy
Females: 78.7 years Males: 73.8 years
1990 life expectancy
Females: 74.5 years Males: 67.6 years
Kerala
1.5%
18.4%
2.5%
36.2%
1.7%
3.5%
21.2%
2%
6.9%
1.4%
4.7%
7.4%
4.6%
9.7%
14.8%
3.6%
1.8%
5.5% 12.6%
7.3%
24.4%
8.2%
2.6%
4.2%
21.5%
37.8%
6.4%
3.6%
9.6%
3%
3.3%
3.9%
4.2%
0.9%
8.3%
8.6%
45.7%
9.3%
1%
0.9%
6.9%
11.4%
4.5%
2.4%
0−14 years [2.7% of total deaths] 15−39 years [6.5% of total deaths]
40−69 years [38.4% of total deaths] 70+ years [52.4% of total deaths]
What caused the most deaths in different age groups in 2016?
Percent contribution of top 10 causes of death by age group, both sexes, 2016
HIV/AIDS & tuberculosis
Diarrhoea/LRI*/other
NTDs†
& malaria
Maternal disorders
Neonatal disorders
Nutritional deficiencies
Other communicable diseases
Cancers
Cardiovascular diseases
Chronic respiratory diseases
Cirrhosis
Digestive diseases
Neurological disorders
Diabetes/urog‡
/blood/endo§
Other non-communicable
Transport injuries
Unintentional injuries
Suicide & violence
Other causes of death
*LRI is lower respiratory infections.
†
NTDs are neglected tropical diseases.
‡
Urog is urogenital diseases.
§
Endo is endocrine diseases.
How much did the under-5 mortality rate change from 1990 to 2016?
Under-5 mortality rate, both sexes combined, 1990-2016
What caused the most deaths in different age groups in 2016?
Percent contribution of top 10 causes of death by age group, both sexes, 2016
Kerala](https://image.slidesharecdn.com/indiahealthofthenationsstatesreport2017-230818115250-fe055a08/85/India_Health_of_the_Nation-s_States_Report_2017-pdf-135-320.jpg)
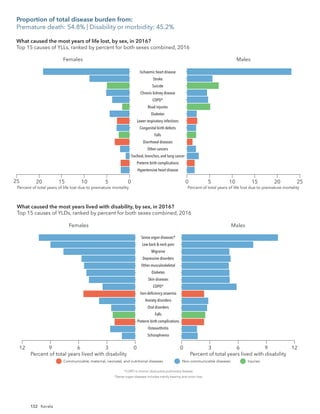
![133
Kerala
Ischaemic heart disease [12.2%]
Sense organ diseases‡
[4.6%]
COPD†
[4.4%]
Stroke [4.2%]
Diabetes [4.0%]
Low back & neck pain [3.8%]
Self-harm§
[3.4%]*
Chronic kidney disease [3.2%]
Migraine [2.9%]
Road injuries [2.6%]
Depressive disorders [2.5%]
Other musculoskeletal disorders [2.4%]
Skin diseases [2.4%]
Falls [2.3%]
Preterm birth complications [2.0%]
Congenital birth defects [1.7%]
Diarrhoeal diseases [1.6%]
Lower respiratory infections [1.4%]
Tuberculosis [0.8%]
Neonatal encephalopathy [0.5%]
Ischaemic heart disease [7.1%]
Congenital birth defects [6.1%]
Preterm birth complications [6.1%]
Lower respiratory infections [4.8%]
Self-harm§
[3.7%]
COPD†
[3.7%]
Stroke [3.5%]
Diarrhoeal diseases [3.0%]
Neonatal encephalopathy [2.8%]
Sense organ diseases‡
[2.7%]
Low back & neck pain [2.5%]
Tuberculosis [2.4%]
Migraine [2.1%]
Skin diseases [2.0%]
Road injuries [2.0%]
Diabetes [1.8%]
Depressive disorders [1.8%]
Chronic kidney disease [1.8%]
Falls [1.6%]
Other musculoskeletal disorders [1.6%]
1
2
3
4
5
6
7
8
9
10
11
12
13
14
15
1
2
3
4
5
6
7
8
9
10
11
12
13
14
15
17
42
22
20
30
18
19
21
17
18
Leading causes of DALYs 1990
How have the leading causes of death and disability combined changed from 1990 to 2016?
Change in top 15 causes of DALYs, both sexes, ranked by number of DALYs, 1990–2016
Leading causes of DALYs 2016
Communicable, maternal,
neonatal, and nutritional diseases
Non-communicable diseases Injuries same or increase decrease
*Change not significant.
The percent figure in brackets next to each cause is
DALYs from that cause out of total DALYs.
†
COPD is chronic obstructive pulmonary disease.
‡
Sense organ diseases includes mainly hearing and vision loss.
§
Self-harm refers to suicide and the nonfatal outcomes of self-harm.
[0.91]
[0.25]
[0.29]
[0.42]
[0.51]
[0.56]
[0.63]
[0.74]
[0.85]
[1.02]
[1.25]
[1.56]
[1.94]
[2.39]
[2.84]
[3.24]
[3.9]
[4.67]
The number in the bracket on top of each vertical bar is the ratio of percent DALYs to population for that age group.
The number in parentheses after each age group on the x-axis is the percent of population in that age group.
Communicable, maternal, neonatal, and nutritional diseases
Percent
of
total
DALYs
Age
Non-communicable diseases Injuries
What caused the most death and disability combined across age groups in 2016?
Percent of DALYs by age group, both sexes, 2016
U
n
d
e
r
5
(
6
%
)
5
t
o
9
(
7
%
)
1
0
t
o
1
4
(
7
%
)
1
5
t
o
1
9
(
7
%
)
2
0
t
o
2
4
(
8
%
)
2
5
t
o
2
9
(
8
%
)
3
0
t
o
3
4
(
8
%
)
3
5
t
o
3
9
(
8
%
)
4
0
t
o
4
4
(
7
%
)
4
5
t
o
4
9
(
7
%
)
5
0
t
o
5
4
(
7
%
)
5
5
t
o
5
9
(
7
%
)
6
0
t
o
6
4
(
5
%
)
6
5
t
o
6
9
(
3
%
)
7
0
t
o
7
4
(
2
%
)
7
5
t
o
7
9
(
2
%
)
8
0
t
o
8
4
(
1
%
)
8
5
+
(
1
%
)
0
3
9
12
6
How have the leading causes of death and disability combined changed from 1990 to 2016?
Change in top 15 causes of DALYs, both sexes, ranked by number of DALYs, 1990–2016
What caused the most death and disability combined across age groups in 2016?
Percent of DALYs by age group, both sexes, 2016
Proportion of total disease burden from:
CMNNDs: 13.6% | NCDs: 74.6% | Injuries: 11.8%](https://image.slidesharecdn.com/indiahealthofthenationsstatesreport2017-230818115250-fe055a08/85/India_Health_of_the_Nation-s_States_Report_2017-pdf-137-320.jpg)
![134 Kerala
Risk factors 1990 Risk factors 2016
The percent figure in bracket next to each risk is DALYs from that risk out of total DALYs. *Malnutrition is child and maternal malnutrition.
†
WaSH is unsafe water, sanitation, and handwashing.
What risk factors are driving the most death and disability combined?
Contribution of top 10 risks to DALYs number, both sexes, ranked by number of DALYs, 19
same or increase decrease
Behavioural Environmental/occupational Metabolic
Malnutrition* [17.4%]
Air pollution [9.3%]
Dietary risks [8.1%]
High blood pressure [7.9%]
Tobacco use [6.5%]
High fasting plasma glucose [5.9%]
High total cholesterol [4.0%]
WaSH†
[3.3%]
Occupational risks [3.0%]
Impaired kidney function [2.8%]
High blood pressure [13.4%]
Dietary risks [11.2%]
High fasting plasma glucose [11.1%]
High body-mass index [7.6%]
High total cholesterol [7.0%]
Tobacco use [6.9%]
Air pollution [6.2%]
Impaired kidney function [4.8%]
Malnutrition* [4.4%]
Occupational risks [3.7%]
1
2
3
4
5
6
7
8
9
10
1
2
3
4
5
6
7
8
9
10
High body-mass index [1.7%] WaSH†
[1.3%]
12 13
Risk factors 1990 Risk factors 2016
The percent figure in bracket next to each risk is DALYs from that risk out of total DALYs. *Malnutrition is child and maternal malnutrition.
†
WaSH is unsafe water, sanitation, and handwashing.
What risk factors are driving the most death and disability combined?
Contribution of top 10 risks to DALYs number, both sexes, ranked by number of DALYs, 1990-2016
same or increase decrease
Behavioural Environmental/occupational Metabolic
Malnutrition* [32.2%]
WaSH†
[15.2%]
Air pollution [7.7%]
Tobacco use [3.6%]
Dietary risks [2.3%]
High blood pressure [2.2%]
Occupational risks [1.9%]
Alcohol & drug use [1.6%]
High fasting plasma glucose [1.4%]
Impaired kidney function [0.9%]
Malnutrition* [14.8%]
Air pollution [5.1%]
High blood pressure [5.0%]
Tobacco use [4.9%]
Dietary risks [4.7%]
High fasting plasma glucose [4.0%]
WaSH†
[3.9%]
Alcohol & drug use [3.9%]
Occupational risks [2.6%]
Impaired kidney function [2.0%]
1
2
3
4
5
6
7
8
9
10
1
2
3
4
5
6
7
8
9
10
Females
Occupational risks
Malnutrition*
Impaired kidney function
Air pollution
Tobacco use
High total cholesterol
High body-mass index
High fasting plasma glucose
Dietary risks
High blood pressure
Males
8 12
4
0 16
8 4
12
16 0
Percent of years of life lost and years lived with disability Percent of years of life lost and years lived with disability
How did the risk factors differ by sex in 2016?
Percent of total DALYs attributable to top 10 risks, ranked by percent for both sexes combined, 2016
Behavioural Environmental/occupational Metabolic
*Malnutrition is child and maternal malnutrition.
What risk factors are driving the most death and disability combined?
Contribution of top 10 risks to DALYs number, both sexes, ranked by number of DALYs, 1990-2016](https://image.slidesharecdn.com/indiahealthofthenationsstatesreport2017-230818115250-fe055a08/85/India_Health_of_the_Nation-s_States_Report_2017-pdf-138-320.jpg)
![135
How much did the under-5 mortality rate change from 1990 to 2016?
Under-5 mortality rate, both sexes combined, 1990-2016
0
50
100
150
1990 1995 2000 2005 2010 2016
Year
Deaths
per
1,000
live
births
Madhya Pradesh under-5 rate India under-5 rate Comparative average rate globally for similar
Socio-demographic Index as Madhya Pradesh
39.2
45.2
43.9
2016 life expectancy
Females: 69.3 years Males: 65.3 years
1990 life expectancy
Females: 55.9 years Males: 55.6 years
Madhya Pradesh
1%
36.1%
3.7% 37%
3.4%
1.5%
0.8%
7%
1%
5.4%
3.3%
11.9%
11.7%
3.4%
5.9%
11.9%
3%
3.6%
11%
11.2%
15.6%
10.8%
7.8%
9.7%
13.2%
32.9%
11.5%
2.5%
3.2%
5.8%
3%
4.4%
5.9%
3.6%
22.6%
6.5%
32.9%
14.3%
0.7%
2.3%
3.7%
6.9%
3.8%
2.7%
0−14 years [13.2% of total deaths] 15−39 years [11.7% of total deaths]
40−69 years [37.7% of total deaths] 70+ years [37.3% of total deaths]
What caused the most deaths in different age groups in 2016?
Percent contribution of top 10 causes of death by age group, both sexes, 2016
HIV/AIDS & tuberculosis
Diarrhoea/LRI*/other
NTDs†
& malaria
Maternal disorders
Neonatal disorders
Nutritional deficiencies
Other communicable diseases
Cancers
Cardiovascular diseases
Chronic respiratory diseases
Cirrhosis
Digestive diseases
Neurological disorders
Diabetes/urog‡
/blood/endo§
Other non-communicable
Transport injuries
Unintentional injuries
Suicide & violence
Other causes of death
*LRI is lower respiratory infections.
†
NTDs are neglected tropical diseases.
‡
Urog is urogenital diseases.
§
Endo is endocrine diseases.
How much did the under-5 mortality rate change from 1990 to 2016?
Under-5 mortality rate, both sexes combined, 1990-2016
What caused the most deaths in different age groups in 2016?
Percent contribution of top 10 causes of death by age group, both sexes, 2016
Madhya Pradesh](https://image.slidesharecdn.com/indiahealthofthenationsstatesreport2017-230818115250-fe055a08/85/India_Health_of_the_Nation-s_States_Report_2017-pdf-139-320.jpg)
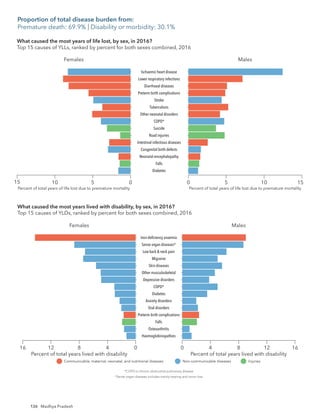
![137
Madhya Pradesh
Ischaemic heart disease [7.7%]
Lower respiratory infections [5.6%]
Diarrhoeal diseases [4.9%]
COPD†
[4.2%]
Preterm birth complications [4.2%]
Iron-deficiency anaemia [3.5%]
Tuberculosis [3.4%]
Stroke [3.4%]
Other neonatal disorders [3.2%]
Road injuries [2.6%]
Sense organ diseases‡
[2.6%]
Self-harm§
[2.4%]
Low back & neck pain [2.0%]
Diabetes [2.0%]
Intestinal infectious diseases [1.9%]
Congenital birth defects [1.9%]*
Neonatal encephalopathy [1.1%]
Protein-energy malnutrition [1.1%]
Meningitis [1.0%]
Measles [0.5%]
Lower respiratory infections [14.2%]
Diarrhoeal diseases [11.6%]
Preterm birth complications [6.1%]
Other neonatal disorders [5.3%]
Tuberculosis [4.9%]
Measles [4.8%]
Ischaemic heart disease [2.6%]
COPD†
[2.6%]
Intestinal infectious diseases [2.5%]
Neonatal encephalopathy [2.1%]
Protein-energy malnutrition [2.1%]
Iron-deficiency anaemia [1.9%]
Stroke [1.7%]
Congenital birth defects [1.6%]
Meningitis [1.6%]
Self-harm§
[1.2%]
Sense organ diseases‡
[1.1%]
Road injuries [1.0%]
Low back & neck pain [1.0%]
Diabetes [0.5%]
1
2
3
4
5
6
7
8
9
10
11
12
13
14
15
1
2
3
4
5
6
7
8
9
10
11
12
13
14
15
16
48
37
25
27
24
22
24
19
20
Leading causes of DALYs 1990
How have the leading causes of death and disability combined changed from 1990 to 2016?
Change in top 15 causes of DALYs, both sexes, ranked by number of DALYs, 1990–2016
Leading causes of DALYs 2016
Communicable, maternal,
neonatal, and nutritional diseases
Non-communicable diseases Injuries same or increase decrease
*Change not significant.
The percent figure in brackets next to each cause is
DALYs from that cause out of total DALYs.
†
COPD is chronic obstructive pulmonary disease.
‡
Sense organ diseases includes mainly hearing and vision loss.
§
Self-harm refers to suicide and the nonfatal outcomes of self-harm.
[2.24]
[0.32] [0.31]
[0.44]
[0.54] [0.6]
[0.67] [0.78] [0.9] [1.1] [1.36] [1.68] [2.08]
[2.59]
[3.13]
[3.54]
[4.03]
[4.4]
The number in the bracket on top of each vertical bar is the ratio of percent DALYs to population for that age group.
The number in parentheses after each age group on the x-axis is the percent of population in that age group.
Communicable, maternal, neonatal, and nutritional diseases
Percent
of
total
DALYs
Age
Non-communicable diseases Injuries
What caused the most death and disability combined across age groups in 2016?
Percent of DALYs by age group, both sexes, 2016
U
n
d
e
r
5
(
1
0
%
)
5
t
o
9
(
1
0
%
)
1
0
t
o
1
4
(
1
0
%
)
1
5
t
o
1
9
(
1
0
%
)
2
0
t
o
2
4
(
9
%
)
2
5
t
o
2
9
(
8
%
)
3
0
t
o
3
4
(
8
%
)
3
5
t
o
3
9
(
7
%
)
4
0
t
o
4
4
(
6
%
)
4
5
t
o
4
9
(
5
%
)
5
0
t
o
5
4
(
4
%
)
5
5
t
o
5
9
(
4
%
)
6
0
t
o
6
4
(
3
%
)
6
5
t
o
6
9
(
2
%
)
7
0
t
o
7
4
(
2
%
)
7
5
t
o
7
9
(
1
%
)
8
0
t
o
8
4
(
1
%
)
8
5
+
(
<
1
%
)
0
5
15
20
10
How have the leading causes of death and disability combined changed from 1990 to 2016?
Change in top 15 causes of DALYs, both sexes, ranked by number of DALYs, 1990–2016
What caused the most death and disability combined across age groups in 2016?
Percent of DALYs by age group, both sexes, 2016
Proportion of total disease burden from:
CMNNDs: 37.5% | NCDs: 50.5% | Injuries: 12.0%](https://image.slidesharecdn.com/indiahealthofthenationsstatesreport2017-230818115250-fe055a08/85/India_Health_of_the_Nation-s_States_Report_2017-pdf-141-320.jpg)
![138 Madhya Pradesh
Risk factors 1990 Risk factors 2016
The percent figure in bracket next to each risk is DALYs from that risk out of total DALYs. *Malnutrition is child and maternal malnutrition.
†
WaSH is unsafe water, sanitation, and handwashing.
What risk factors are driving the most death and disability combined?
Contribution of top 10 risks to DALYs number, both sexes, ranked by number of DALYs, 19
same or increase decrease
Behavioural Environmental/occupational Metabolic
Malnutrition* [42.1%]
Air pollution [13.0%]
WaSH†
[12.7%]
Tobacco use [4.6%]
Dietary risks [3.3%]
High blood pressure [3.0%]
High fasting plasma glucose [1.8%]
Occupational risks [1.7%]
Alcohol & drug use [1.4%]
High total cholesterol [1.2%]
Malnutrition* [17.7%]
Air pollution [10.1%]
Dietary risks [7.7%]
High blood pressure [7.3%]
Tobacco use [5.9%]
High fasting plasma glucose [5.7%]
WaSH†
[5.0%]
High total cholesterol [3.7%]
Alcohol & drug use [3.4%]
Occupational risks [2.8%]
1
2
3
4
5
6
7
8
9
10
1
2
3
4
5
6
7
8
9
10
Risk factors 1990 Risk factors 2016
The percent figure in bracket next to each risk is DALYs from that risk out of total DALYs. *Malnutrition is child and maternal malnutrition.
†
WaSH is unsafe water, sanitation, and handwashing.
What risk factors are driving the most death and disability combined?
Contribution of top 10 risks to DALYs number, both sexes, ranked by number of DALYs, 1990-2016
same or increase decrease
Behavioural Environmental/occupational Metabolic
Malnutrition* [32.2%]
WaSH†
[15.2%]
Air pollution [7.7%]
Tobacco use [3.6%]
Dietary risks [2.3%]
High blood pressure [2.2%]
Occupational risks [1.9%]
Alcohol & drug use [1.6%]
High fasting plasma glucose [1.4%]
Impaired kidney function [0.9%]
Malnutrition* [14.8%]
Air pollution [5.1%]
High blood pressure [5.0%]
Tobacco use [4.9%]
Dietary risks [4.7%]
High fasting plasma glucose [4.0%]
WaSH†
[3.9%]
Alcohol & drug use [3.9%]
Occupational risks [2.6%]
Impaired kidney function [2.0%]
1
2
3
4
5
6
7
8
9
10
1
2
3
4
5
6
7
8
9
10
Females
Occupational risks
Alcohol & drug use
High total cholesterol
WaSH†
High fasting plasma glucose
Tobacco use
High blood pressure
Dietary risks
Air pollution
Malnutrition*
Males
10 15
5
0 20
10 5
15
20 0
Percent of years of life lost and years lived with disability Percent of years of life lost and years lived with disability
How did the risk factors differ by sex in 2016?
Percent of total DALYs attributable to top 10 risks, ranked by percent for both sexes combined, 2016
Behavioural Environmental/occupational Metabolic
*Malnutrition is child and maternal malnutrition.
†
WaSH is unsafe water, sanitation, and handwashing.
What risk factors are driving the most death and disability combined?
Contribution of top 10 risks to DALYs number, both sexes, ranked by number of DALYs, 1990-2016](https://image.slidesharecdn.com/indiahealthofthenationsstatesreport2017-230818115250-fe055a08/85/India_Health_of_the_Nation-s_States_Report_2017-pdf-142-320.jpg)
![139
0
50
100
150
1990 1995 2000 2005 2010 2016
Year
Deaths
per
1,000
live
births
Maharashtra under-5 rate India under-5 rate Comparative average rate globally for similar
Socio-demographic Index as Maharashtra
39.2
27.5
21.6
How much did the under-5 mortality rate change from 1990 to 2016?
Under-5 mortality rate, both sexes combined, 1990-2016
2016 life expectancy
Females: 69.3 years Males: 65.3 years
1990 life expectancy
Females: 55.9 years Males: 55.6 years
Maharashtra
26.1%
2.9%
45.4%
1.8%
1.3%
1.4%
0.8%
8.8%
1.5%
5.8%
4.2%
10.7%
7.6%
5.5%
13.9%
2.1%
6.1%
4.5%
12.3%
10.2%
16.2%
11%
5.4%
6.7%
11.5%
37.8%
10%
5.7%
7.5%
2.9%
4.3%
2.4%
5.8%
2.2%
14.8%
5.6%
39.7%
15.4%
1.5%
1.5%
4.3%
7.9%
4.6%
2.6%
0−14 years [6% of total deaths] 15−39 years [10.7% of total deaths]
40−69 years [40.7% of total deaths] 70+ years [42.5% of total deaths]
What caused the most deaths in different age groups in 2016?
Percent contribution of top 10 causes of death by age group, both sexes, 2016
HIV/AIDS & tuberculosis
Diarrhoea/LRI*/other
NTDs†
& malaria
Maternal disorders
Neonatal disorders
Nutritional deficiencies
Other communicable diseases
Cancers
Cardiovascular diseases
Chronic respiratory diseases
Cirrhosis
Digestive diseases
Neurological disorders
Diabetes/urog‡
/blood/endo§
Other non-communicable
Transport injuries
Unintentional injuries
Suicide & violence
Other causes of death
*LRI is lower respiratory infections.
†
NTDs are neglected tropical diseases.
‡
Urog is urogenital diseases.
§
Endo is endocrine diseases.
How much did the under-5 mortality rate change from 1990 to 2016?
Under-5 mortality rate, both sexes combined, 1990-2016
What caused the most deaths in different age groups in 2016?
Percent contribution of top 10 causes of death by age group, both sexes, 2016
Maharashtra](https://image.slidesharecdn.com/indiahealthofthenationsstatesreport2017-230818115250-fe055a08/85/India_Health_of_the_Nation-s_States_Report_2017-pdf-143-320.jpg)
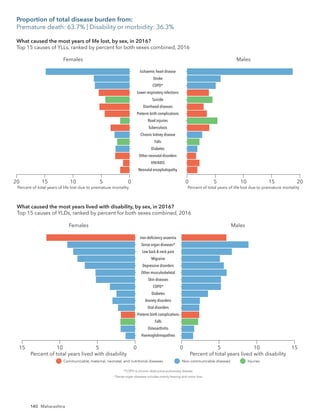
![141
Maharashtra
Ischaemic heart disease [11.2%]
COPD†
[5.0%]*
Stroke [4.1%]
Iron-deficiency anaemia [3.3%]
Sense organ diseases‡
[3.3%]
Preterm birth complications [3.2%]
Lower respiratory infections [2.9%]
Diarrhoeal diseases [2.8%]
Self-harm§
[2.8%]
Road injuries [2.8%]
Low back & neck pain [2.7%]
Tuberculosis [2.5%]
Diabetes [2.4%]
Migraine [2.3%]
Depressive disorders [2.2%]
Congenital birth defects [1.4%]
Other neonatal disorders [1.3%]
Asthma [1.2%]
Neonatal encephalopathy [1.1%]
Measles [0.1%]
Diarrhoeal diseases [8.9%]
Preterm birth complications [7.3%]
Lower respiratory infections [7.2%]
Tuberculosis [6.4%]
Ischaemic heart disease [5.2%]
COPD†
[4.1%]
Other neonatal disorders [3.4%]
Neonatal encephalopathy [2.6%]
Measles [2.6%]
Stroke [2.6%]
Iron-deficiency anaemia [2.3%]
Congenital birth defects [2.1%]
Road injuries [2.0%]
Self-harm§
[2.0%]
Asthma [1.6%]
Sense organ diseases‡
[1.6%]
Low back & neck pain [1.4%]
Migraine [1.3%]
Depressive disorders [1.2%]
Diabetes [0.9%]
1
2
3
4
5
6
7
8
9
10
11
12
13
14
15
1
2
3
4
5
6
7
8
9
10
11
12
13
14
15
20
1
04
29
23
24
21
19
23
16
17
Leading causes of DALYs 1990
How have the leading causes of death and disability combined changed from 1990 to 2016?
Change in top 15 causes of DALYs, both sexes, ranked by number of DALYs, 1990–2016
Leading causes of DALYs 2016
Communicable, maternal,
neonatal, and nutritional diseases
Non-communicable diseases Injuries same or increase decrease
*Change not significant.
The percent figure in brackets next to each cause is
DALYs from that cause out of total DALYs.
†
COPD is chronic obstructive pulmonary disease.
‡
Sense organ diseases includes mainly hearing and vision loss.
§
Self-harm refers to suicide and the nonfatal outcomes of self-harm.
[1.6]
[0.29]
[0.31]
[0.45]
[0.54]
[0.6]
[0.68] [0.81]
[0.92] [1.11]
[1.36]
[1.69] [2.08]
[2.61]
[3.14]
[3.61]
[4.15]
[4.66]
The number in the bracket on top of each vertical bar is the ratio of percent DALYs to population for that age group.
The number in parentheses after each age group on the x-axis is the percent of population in that age group.
Communicable, maternal, neonatal, and nutritional diseases
Percent
of
total
DALYs
Age
Non-communicable diseases Injuries
What caused the most death and disability combined across age groups in 2016?
Percent of DALYs by age group, both sexes, 2016
U
n
d
e
r
5
(
7
%
)
5
t
o
9
(
8
%
)
1
0
t
o
1
4
(
8
%
)
1
5
t
o
1
9
(
9
%
)
2
0
t
o
2
4
(
1
0
%
)
2
5
t
o
2
9
(
9
%
)
3
0
t
o
3
4
(
9
%
)
3
5
t
o
3
9
(
7
%
)
4
0
t
o
4
4
(
7
%
)
4
5
t
o
4
9
(
6
%
)
5
0
t
o
5
4
(
5
%
)
5
5
t
o
5
9
(
4
%
)
6
0
t
o
6
4
(
4
%
)
6
5
t
o
6
9
(
3
%
)
7
0
t
o
7
4
(
2
%
)
7
5
t
o
7
9
(
1
%
)
8
0
t
o
8
4
(
1
%
)
8
5
+
(
<
1
%
)
0
2.5
7.5
10.0
12.5
5.0
How have the leading causes of death and disability combined changed from 1990 to 2016?
Change in top 15 causes of DALYs, both sexes, ranked by number of DALYs, 1990–2016
What caused the most death and disability combined across age groups in 2016?
Percent of DALYs by age group, both sexes, 2016
Proportion of total disease burden from:
CMNNDs: 24.6% | NCDs: 63.1% | Injuries: 12.3%](https://image.slidesharecdn.com/indiahealthofthenationsstatesreport2017-230818115250-fe055a08/85/India_Health_of_the_Nation-s_States_Report_2017-pdf-145-320.jpg)
![142 Maharashtra
What risk factors are driving the most death and disability combined?
Contribution of top 10 risks to DALYs number, both sexes, ranked by number of DALYs, 19
Risk factors 1990 Risk factors 2016
The percent figure in bracket next to each risk is DALYs from that risk out of total DALYs. *Malnutrition is child and maternal malnutrition.
†
WaSH is unsafe water, sanitation, and handwashing.
same or increase decrease
Behavioural Environmental/occupational Metabolic
Malnutrition* [30.1%]
Air pollution [9.8%]
WaSH†
[8.9%]
Dietary risks [6.3%]
High blood pressure [5.1%]
Tobacco use [4.6%]
High fasting plasma glucose [3.2%]
Alcohol & drug use [2.7%]
High total cholesterol [2.4%]
Occupational risks [2.2%]
Dietary risks [11.5%]
High blood pressure [10.4%]
Malnutrition* [10.3%]
Air pollution [8.6%]
High fasting plasma glucose [7.1%]
High total cholesterol [5.3%]
Tobacco use [4.8%]
Alcohol & drug use [4.6%]
High body-mass index [4.5%]
Impaired kidney function [3.6%]
1
2
3
4
5
6
7
8
9
10
1
2
3
4
5
6
7
8
9
10
Impaired kidney function [1.9%] Occupational risks [3.2%]
11 11
High body-mass index [0.9%] WaSH†
[2.6%]
12 12
Risk factors 1990 Risk factors 2016
The percent figure in bracket next to each risk is DALYs from that risk out of total DALYs. *Malnutrition is child and maternal malnutrition.
†
WaSH is unsafe water, sanitation, and handwashing.
What risk factors are driving the most death and disability combined?
Contribution of top 10 risks to DALYs number, both sexes, ranked by number of DALYs, 1990-2016
same or increase decrease
Behavioural Environmental/occupational Metabolic
Malnutrition* [32.2%]
WaSH†
[15.2%]
Air pollution [7.7%]
Tobacco use [3.6%]
Dietary risks [2.3%]
High blood pressure [2.2%]
Occupational risks [1.9%]
Alcohol & drug use [1.6%]
High fasting plasma glucose [1.4%]
Impaired kidney function [0.9%]
Malnutrition* [14.8%]
Air pollution [5.1%]
High blood pressure [5.0%]
Tobacco use [4.9%]
Dietary risks [4.7%]
High fasting plasma glucose [4.0%]
WaSH†
[3.9%]
Alcohol & drug use [3.9%]
Occupational risks [2.6%]
Impaired kidney function [2.0%]
1
2
3
4
5
6
7
8
9
10
1
2
3
4
5
6
7
8
9
10
Females
Impaired kidney function
High body-mass index
Alcohol & drug use
Tobacco use
High total cholesterol
High fasting plasma glucose
Air pollution
Malnutrition*
High blood pressure
Dietary risks
Males
10
5
0 15
10 5
15 0
Percent of years of life lost and years lived with disability Percent of years of life lost and years lived with disability
How did the risk factors differ by sex in 2016?
Percent of total DALYs attributable to top 10 risks, ranked by percent for both sexes combined, 2016
Behavioural Environmental/occupational Metabolic
*Malnutrition is child and maternal malnutrition.
What risk factors are driving the most death and disability combined?
Contribution of top 10 risks to DALYs number, both sexes, ranked by number of DALYs, 1990-2016](https://image.slidesharecdn.com/indiahealthofthenationsstatesreport2017-230818115250-fe055a08/85/India_Health_of_the_Nation-s_States_Report_2017-pdf-146-320.jpg)
![143
0
50
100
150
1990 1995 2000 2005 2010 2016
Year
Deaths
per
1,000
live
births
Manipur under-5 rate India under-5 rate Comparative average rate globally for similar
Socio-demographic Index as Manipur
39.2
24.8
29.3
How much did the under-5 mortality rate change from 1990 to 2016?
Under-5 mortality rate, both sexes combined, 1990-2016
2016 life expectancy
Females: 72.8 years Males: 68.0 years
1990 life expectancy
Females: 65.0 years Males: 62.9 years
Manipur
2.2%
37%
3.3%
36.1%
1.5%
1.2%
5.9%
1.9%
5.7%
0.9%
4.2%
18.1%
10.8%
1.9% 4.6%
9.6%
8.2% 4.8%
12.2%
5.7%
15.1%
9.1%
9.4%
9.5%
12.3%
28.7%
5.7%
10.2%
10.1%
3.8%
2.4%
2.7%
5.3% 4.9%
24.1%
6.4%
29.1%
9.2%
3%
1.5%
4.7%
11.9%
2.3%
2.8%
0−14 years [7.1% of total deaths] 15−39 years [13.3% of total deaths]
40−69 years [39.6% of total deaths] 70+ years [40% of total deaths]
What caused the most deaths in different age groups in 2016?
Percent contribution of top 10 causes of death by age group, both sexes, 2016
HIV/AIDS & tuberculosis
Diarrhoea/LRI*/other
NTDs†
& malaria
Maternal disorders
Neonatal disorders
Nutritional deficiencies
Other communicable diseases
Cancers
Cardiovascular diseases
Chronic respiratory diseases
Cirrhosis
Digestive diseases
Neurological disorders
Diabetes/urog‡
/blood/endo§
Other non-communicable
Transport injuries
Unintentional injuries
Suicide & violence
Other causes of death
*LRI is lower respiratory infections.
†
NTDs are neglected tropical diseases.
‡
Urog is urogenital diseases.
§
Endo is endocrine diseases.
How much did the under-5 mortality rate change from 1990 to 2016?
Under-5 mortality rate, both sexes combined, 1990-2016
What caused the most deaths in different age groups in 2016?
Percent contribution of top 10 causes of death by age group, both sexes, 2016
Manipur](https://image.slidesharecdn.com/indiahealthofthenationsstatesreport2017-230818115250-fe055a08/85/India_Health_of_the_Nation-s_States_Report_2017-pdf-147-320.jpg)
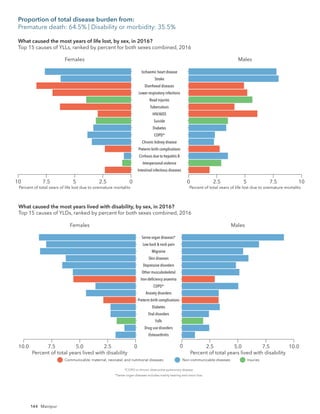
![145
Manipur
Ischaemic heart disease [5.2%]
Stroke [5.0%]
Diarrhoeal diseases [4.5%]
Lower respiratory infections [3.9%]
Road injuries [3.7%]
Tuberculosis [3.4%]
COPD†
[3.4%]
HIV/AIDS [3.4%]
Sense organ diseases‡
[3.1%]
Diabetes [3.1%]
Preterm birth complications [2.8%]*
Low back & neck pain [2.6%]
Migraine [2.5%]
Skin diseases [2.2%]
Self-harm§
[2.2%]
Intestinal infectious diseases [1.3%]
Neonatal encephalopathy [1.2%]
Other neonatal disorders [1.1%]
Measles [0.3%]
Whooping cough [0.2%]*
Tetanus [0.1%]
Diarrhoeal diseases [11.9%]
Lower respiratory infections [9.6%]
Tuberculosis [5.4%]
Preterm birth complications [4.0%]
Measles [3.7%]
Stroke [2.7%]
Other neonatal disorders [2.6%]
Ischaemic heart disease [2.6%]
Neonatal encephalopathy [2.6%]
Tetanus [2.5%]
COPD†
[2.2%]
Intestinal infectious diseases [2.1%]
Road injuries [1.9%]
Sense organ diseases‡
[1.7%]
Whooping cough [1.6%]
Low back & neck pain [1.5%]
Skin diseases [1.4%]
Migraine [1.4%]
Self-harm§
[1.4%]
Diabetes [1.2%]
HIV/AIDS [0.1%]
1
2
3
4
5
6
7
8
9
10
11
12
13
14
15
1
2
3
4
5
6
7
8
9
10
11
12
13
14
15
23
93
74
25
28
70
24
20
21
17
18
101
Leading causes of DALYs 1990
How have the leading causes of death and disability combined changed from 1990 to 2016?
Change in top 15 causes of DALYs, both sexes, ranked by number of DALYs, 1990–2016
Leading causes of DALYs 2016
Communicable, maternal,
neonatal, and nutritional diseases
Non-communicable diseases Injuries same or increase decrease
*Change not significant.
The percent figure in brackets next to each cause is
DALYs from that cause out of total DALYs.
†
COPD is chronic obstructive pulmonary disease.
‡
Sense organ diseases includes mainly hearing and vision loss.
§
Self-harm refers to suicide and the nonfatal outcomes of self-harm.
[1.53]
[0.28]
[0.31]
[0.49]
[0.6]
[0.67] [0.76] [0.9] [1.03]
[1.24]
[1.52] [1.89]
[2.34]
[2.93]
[3.51] [4.02]
[4.64]
[5.18]
The number in the bracket on top of each vertical bar is the ratio of percent DALYs to population for that age group.
The number in parentheses after each age group on the x-axis is the percent of population in that age group.
Communicable, maternal, neonatal, and nutritional diseases
Percent
of
total
DALYs
Age
Non-communicable diseases Injuries
What caused the most death and disability combined across age groups in 2016?
Percent of DALYs by age group, both sexes, 2016
U
n
d
e
r
5
(
8
%
)
5
t
o
9
(
9
%
)
1
0
t
o
1
4
(
1
0
%
)
1
5
t
o
1
9
(
1
0
%
)
2
0
t
o
2
4
(
1
0
%
)
2
5
t
o
2
9
(
1
0
%
)
3
0
t
o
3
4
(
9
%
)
3
5
t
o
3
9
(
7
%
)
4
0
t
o
4
4
(
6
%
)
4
5
t
o
4
9
(
5
%
)
5
0
t
o
5
4
(
5
%
)
5
5
t
o
5
9
(
4
%
)
6
0
t
o
6
4
(
3
%
)
6
5
t
o
6
9
(
2
%
)
7
0
t
o
7
4
(
1
%
)
7
5
t
o
7
9
(
1
%
)
8
0
t
o
8
4
(
1
%
)
8
5
+
(
<
1
%
)
0
10
5
How have the leading causes of death and disability combined changed from 1990 to 2016?
Change in top 15 causes of DALYs, both sexes, ranked by number of DALYs, 1990–2016
What caused the most death and disability combined across age groups in 2016?
Percent of DALYs by age group, both sexes, 2016
Proportion of total disease burden from:
CMNNDs: 29.5% | NCDs: 58.5% | Injuries: 12.0%](https://image.slidesharecdn.com/indiahealthofthenationsstatesreport2017-230818115250-fe055a08/85/India_Health_of_the_Nation-s_States_Report_2017-pdf-149-320.jpg)
![146 Manipur
What risk factors are driving the most death and disability combined?
Contribution of top 10 risks to DALYs number, both sexes, ranked by number of DALYs, 19
Risk factors 1990 Risk factors 2016
The percent figure in bracket next to each risk is DALYs from that risk out of total DALYs. *Malnutrition is child and maternal malnutrition.
†
WaSH is unsafe water, sanitation, and handwashing.
same or increase decrease
Behavioural Environmental/occupational Metabolic
Malnutrition* [27.4%]
WaSH†
[12.1%]
Air pollution [9.1%]
Tobacco use [5.5%]
Dietary risks [4.4%]
High blood pressure [4.0%]
High fasting plasma glucose [2.9%]
Alcohol & drug use [2.2%]
Occupational risks [2.1%]
Impaired kidney function [1.7%]
Malnutrition* [8.3%]
High blood pressure [7.9%]
Tobacco use [7.7%]
Dietary risks [7.5%]
High fasting plasma glucose [6.6%]
Air pollution [6.1%]
Alcohol & drug use [4.9%]
WaSH†
[4.3%]
Impaired kidney function [3.0%]
High body-mass index [3.0%]
1
2
3
4
5
6
7
8
9
10
1
2
3
4
5
6
7
8
9
10
High body-mass index [0.9%] Occupational risks [3.0%]
12 11
Risk factors 1990 Risk factors 2016
The percent figure in bracket next to each risk is DALYs from that risk out of total DALYs. *Malnutrition is child and maternal malnutrition.
†
WaSH is unsafe water, sanitation, and handwashing.
What risk factors are driving the most death and disability combined?
Contribution of top 10 risks to DALYs number, both sexes, ranked by number of DALYs, 1990-2016
same or increase decrease
Behavioural Environmental/occupational Metabolic
Malnutrition* [32.2%]
WaSH†
[15.2%]
Air pollution [7.7%]
Tobacco use [3.6%]
Dietary risks [2.3%]
High blood pressure [2.2%]
Occupational risks [1.9%]
Alcohol & drug use [1.6%]
High fasting plasma glucose [1.4%]
Impaired kidney function [0.9%]
Malnutrition* [14.8%]
Air pollution [5.1%]
High blood pressure [5.0%]
Tobacco use [4.9%]
Dietary risks [4.7%]
High fasting plasma glucose [4.0%]
WaSH†
[3.9%]
Alcohol & drug use [3.9%]
Occupational risks [2.6%]
Impaired kidney function [2.0%]
1
2
3
4
5
6
7
8
9
10
1
2
3
4
5
6
7
8
9
10
Females
High body-mass index
Impaired kidney function
WaSH†
Alcohol & drug use
Air pollution
High fasting plasma glucose
Dietary risks
Tobacco use
High blood pressure
Malnutrition*
Males
7.5
2.5
0 10
5
2.5
7.5
10 0
5
Percent of years of life lost and years lived with disability Percent of years of life lost and years lived with disability
How did the risk factors differ by sex in 2016?
Percent of total DALYs attributable to top 10 risks, ranked by percent for both sexes combined, 2016
Behavioural Environmental/occupational Metabolic
*Malnutrition is child and maternal malnutrition.
†
WaSH is unsafe water, sanitation, and handwashing.
What risk factors are driving the most death and disability combined?
Contribution of top 10 risks to DALYs number, both sexes, ranked by number of DALYs, 1990-2016](https://image.slidesharecdn.com/indiahealthofthenationsstatesreport2017-230818115250-fe055a08/85/India_Health_of_the_Nation-s_States_Report_2017-pdf-150-320.jpg)
![147
0
50
100
150
1990 1995 2000 2005 2010 2016
Year
Deaths
per
1,000
live
births
Meghalaya under-5 rate India under-5 rate Comparative average rate globally for similar
Socio-demographic Index as Meghalaya
39.2
36.3
33.3
How much did the under-5 mortality rate change from 1990 to 2016?
Under-5 mortality rate, both sexes combined, 1990-2016
2016 life expectancy
Females: 72.4 years Males: 66.8 years
1990 life expectancy
Females: 63.1 years Males: 59.8 years
Meghalaya
1.5%
38.4%
11.2%
30.4%
0.9%
1.7%
1%
1.2%
6.4%
3.5%
3.8%
12.8%
13.5%
4.7%
7.7%
8.8%
9%
5%
7%
7.3%
10.1%
14.1%
9.4%
9.4%
24.9%
20.6%
6.1%
8.2%
5%
6.5%
1.7%
2.7%
5.5% 6.1%
23.4%
10.3%
25.7%
9.6%
2.5%
3.9%
5.1%
8.3%
2.9%
2.3%
0−14 years [15.3% of total deaths] 15−39 years [15.7% of total deaths]
40−69 years [37.6% of total deaths] 70+ years [31.5% of total deaths]
What caused the most deaths in different age groups in 2016?
Percent contribution of top 10 causes of death by age group, both sexes, 2016
HIV/AIDS & tuberculosis
Diarrhoea/LRI*/other
NTDs†
& malaria
Maternal disorders
Neonatal disorders
Nutritional deficiencies
Other communicable diseases
Cancers
Cardiovascular diseases
Chronic respiratory diseases
Cirrhosis
Digestive diseases
Neurological disorders
Diabetes/urog‡
/blood/endo§
Other non-communicable
Transport injuries
Unintentional injuries
Suicide & violence
Other causes of death
*LRI is lower respiratory infections.
†
NTDs are neglected tropical diseases.
‡
Urog is urogenital diseases.
§
Endo is endocrine diseases.
How much did the under-5 mortality rate change from 1990 to 2016?
Under-5 mortality rate, both sexes combined, 1990-2016
What caused the most deaths in different age groups in 2016?
Percent contribution of top 10 causes of death by age group, both sexes, 2016
Meghalaya](https://image.slidesharecdn.com/indiahealthofthenationsstatesreport2017-230818115250-fe055a08/85/India_Health_of_the_Nation-s_States_Report_2017-pdf-151-320.jpg)
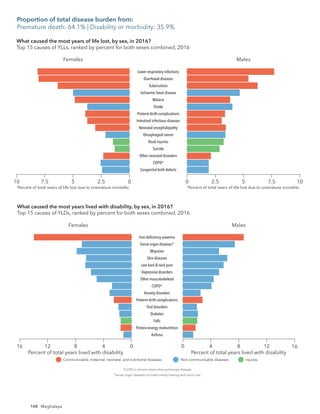
![149
Meghalaya
Lower respiratory infections [5.1%]
Diarrhoeal diseases [4.6%]
Tuberculosis [4.3%]
Iron-deficiency anaemia [4.1%]
Preterm birth complications [3.3%]*
Ischaemic heart disease [3.3%]
Malaria [2.8%]
Stroke [2.7%]
Sense organ diseases‡
[2.6%]
COPD†
[2.6%]
Skin diseases [2.4%]
Migraine [2.4%]
Low back & neck pain [2.2%]
Neonatal encephalopathy [2.2%]*
Intestinal infectious diseases [2.2%]
Congenital birth defects [1.8%]*
Other neonatal disorders [1.5%]*
Neonatal sepsis [0.9%]*
Measles [0.4%]
Tetanus [0.1%]
Diarrhoeal diseases [12.6%]
Lower respiratory infections [10.5%]
Malaria [7.3%]
Tuberculosis [5.9%]
Preterm birth complications [4.4%]
Neonatal encephalopathy [3.5%]
Measles [3.1%]
Intestinal infectious diseases [2.7%]
Iron-deficiency anaemia [2.4%]
Other neonatal disorders [2.1%]
COPD†
[1.8%]
Congenital birth defects [1.6%]
Tetanus [1.5%]
Stroke [1.5%]
Neonatal sepsis [1.4%]
Ischaemic heart disease [1.4%]
Sense organ diseases‡
[1.4%]
Skin diseases [1.3%]
Low back & neck pain [1.2%]
Migraine [1.2%]
1
2
3
4
5
6
7
8
9
10
11
12
13
14
15
1
2
3
4
5
6
7
8
9
10
11
12
13
14
15
19
118
22
31
56
24
19
21
17
18
Leading causes of DALYs 1990
How have the leading causes of death and disability combined changed from 1990 to 2016?
Change in top 15 causes of DALYs, both sexes, ranked by number of DALYs, 1990–2016
Leading causes of DALYs 2016
Communicable, maternal,
neonatal, and nutritional diseases
Non-communicable diseases Injuries same or increase decrease
*Change not significant.
The percent figure in brackets next to each cause is
DALYs from that cause out of total DALYs.
†
COPD is chronic obstructive pulmonary disease.
‡
Sense organ diseases includes mainly hearing and vision loss.
§
Self-harm refers to suicide and the nonfatal outcomes of self-harm.
[2.27]
[0.38] [0.37]
[0.54] [0.65] [0.69]
[0.77] [0.91]
[1.04]
[1.28] [1.58]
[1.98]
[2.44]
[3.05]
[3.63]
[4.14]
[4.75]
[5.32]
The number in the bracket on top of each vertical bar is the ratio of percent DALYs to population for that age group.
The number in parentheses after each age group on the x-axis is the percent of population in that age group.
Communicable, maternal, neonatal, and nutritional diseases
Percent
of
total
DALYs
Age
Non-communicable diseases Injuries
What caused the most death and disability combined across age groups in 2016?
Percent of DALYs by age group, both sexes, 2016
U
n
d
e
r
5
(
9
%
)
5
t
o
9
(
1
3
%
)
1
0
t
o
1
4
(
1
2
%
)
1
5
t
o
1
9
(
1
1
%
)
2
0
t
o
2
4
(
1
0
%
)
2
5
t
o
2
9
(
9
%
)
3
0
t
o
3
4
(
8
%
)
3
5
t
o
3
9
(
6
%
)
4
0
t
o
4
4
(
5
%
)
4
5
t
o
4
9
(
5
%
)
5
0
t
o
5
4
(
4
%
)
5
5
t
o
5
9
(
3
%
)
6
0
t
o
6
4
(
2
%
)
6
5
t
o
6
9
(
1
%
)
7
0
t
o
7
4
(
1
%
)
7
5
t
o
7
9
(
1
%
)
8
0
t
o
8
4
(
<
1
%
)
8
5
+
(
<
1
%
)
0
15
20
5
10
How have the leading causes of death and disability combined changed from 1990 to 2016?
Change in top 15 causes of DALYs, both sexes, ranked by number of DALYs, 1990–2016
What caused the most death and disability combined across age groups in 2016?
Percent of DALYs by age group, both sexes, 2016
Proportion of total disease burden from:
CMNNDs: 39.1% | NCDs: 52.3% | Injuries: 8.6%](https://image.slidesharecdn.com/indiahealthofthenationsstatesreport2017-230818115250-fe055a08/85/India_Health_of_the_Nation-s_States_Report_2017-pdf-153-320.jpg)
![150 Meghalaya
What risk factors are driving the most death and disability combined?
Contribution of top 10 risks to DALYs number, both sexes, ranked by number of DALYs, 19
Risk factors 1990 Risk factors 2016
The percent figure in bracket next to each risk is DALYs from that risk out of total DALYs. *Malnutrition is child and maternal malnutrition.
†
WaSH is unsafe water, sanitation, and handwashing.
same or increase decrease
Behavioural Environmental/occupational Metabolic
Malnutrition* [31.9%]
WaSH†
[12.9%]
Air pollution [8.9%]
Tobacco use [4.4%]
Dietary risks [2.6%]
High blood pressure [2.2%]
Alcohol & drug use [1.9%]
Occupational risks [1.7%]
High fasting plasma glucose [1.5%]
Impaired kidney function [1.0%]
Malnutrition* [16.0%]
Tobacco use [6.4%]
Air pollution [6.1%]
High blood pressure [4.9%]
Dietary risks [4.8%]
Alcohol & drug use [4.5%]
WaSH†
[4.4%]
High fasting plasma glucose [3.6%]
Occupational risks [2.5%]
Impaired kidney function [2.0%]
1
2
3
4
5
6
7
8
9
10
1
2
3
4
5
6
7
8
9
10
Risk factors 1990 Risk factors 2016
The percent figure in bracket next to each risk is DALYs from that risk out of total DALYs. *Malnutrition is child and maternal malnutrition.
†
WaSH is unsafe water, sanitation, and handwashing.
What risk factors are driving the most death and disability combined?
Contribution of top 10 risks to DALYs number, both sexes, ranked by number of DALYs, 1990-2016
same or increase decrease
Behavioural Environmental/occupational Metabolic
Malnutrition* [32.2%]
WaSH†
[15.2%]
Air pollution [7.7%]
Tobacco use [3.6%]
Dietary risks [2.3%]
High blood pressure [2.2%]
Occupational risks [1.9%]
Alcohol & drug use [1.6%]
High fasting plasma glucose [1.4%]
Impaired kidney function [0.9%]
Malnutrition* [14.8%]
Air pollution [5.1%]
High blood pressure [5.0%]
Tobacco use [4.9%]
Dietary risks [4.7%]
High fasting plasma glucose [4.0%]
WaSH†
[3.9%]
Alcohol & drug use [3.9%]
Occupational risks [2.6%]
Impaired kidney function [2.0%]
1
2
3
4
5
6
7
8
9
10
1
2
3
4
5
6
7
8
9
10
Females
Impaired kidney function
Occupational risks
High fasting plasma glucose
WaSH†
Alcohol & drug use
Dietary risks
High blood pressure
Air pollution
Tobacco use
Malnutrition*
Males
5
0 15
10
5
15 0
10
Percent of years of life lost and years lived with disability Percent of years of life lost and years lived with disability
How did the risk factors differ by sex in 2016?
Percent of total DALYs attributable to top 10 risks, ranked by percent for both sexes combined, 2016
Behavioural Environmental/occupational Metabolic
*Malnutrition is child and maternal malnutrition.
†
WaSH is unsafe water, sanitation, and handwashing.
What risk factors are driving the most death and disability combined?
Contribution of top 10 risks to DALYs number, both sexes, ranked by number of DALYs, 1990-2016](https://image.slidesharecdn.com/indiahealthofthenationsstatesreport2017-230818115250-fe055a08/85/India_Health_of_the_Nation-s_States_Report_2017-pdf-154-320.jpg)
![151
0
50
100
150
1990 1995 2000 2005 2010 2016
Year
Deaths
per
1,000
live
births
Mizoram under-5 rate India under-5 rate Comparative average rate globally for similar
Socio-demographic Index as Mizoram
39.2
30.6
26.2
How much did the under-5 mortality rate change from 1990 to 2016?
Under-5 mortality rate, both sexes combined, 1990-2016
2016 life expectancy
Females: 73.8 years Males: 68.3 years
1990 life expectancy
Females: 66.7 years Males: 64.0 years
Mizoram
30.6%
15.8%
34%
0.9%
1.3%
1.3%
0.9%
6.6%
1%
3.8%
3.7%
13.8%
13.8%
5.5%
10.3%
4.6% 5.7% 4.4%
11.7%
6.7%
7.8%
15.7%
5.9%
8.9%
30%
11.8%
12.3%
5.9%
4.7%
6.6%
3.3%
3.2%
7.3%
2.9%
19.9%
15%
14.1%
21%
2%
3.9%
5.3%
8.2%
4%
3.6%
0−14 years [12% of total deaths] 15−39 years [13.7% of total deaths]
40−69 years [37.8% of total deaths] 70+ years [36.6% of total deaths]
What caused the most deaths in different age groups in 2016?
Percent contribution of top 10 causes of death by age group, both sexes, 2016
HIV/AIDS & tuberculosis
Diarrhoea/LRI*/other
NTDs†
& malaria
Maternal disorders
Neonatal disorders
Nutritional deficiencies
Other communicable diseases
Cancers
Cardiovascular diseases
Chronic respiratory diseases
Cirrhosis
Digestive diseases
Neurological disorders
Diabetes/urog‡
/blood/endo§
Other non-communicable
Transport injuries
Unintentional injuries
Suicide & violence
Other causes of death
*LRI is lower respiratory infections.
†
NTDs are neglected tropical diseases.
‡
Urog is urogenital diseases.
§
Endo is endocrine diseases.
How much did the under-5 mortality rate change from 1990 to 2016?
Under-5 mortality rate, both sexes combined, 1990-2016
What caused the most deaths in different age groups in 2016?
Percent contribution of top 10 causes of death by age group, both sexes, 2016
Mizoram](https://image.slidesharecdn.com/indiahealthofthenationsstatesreport2017-230818115250-fe055a08/85/India_Health_of_the_Nation-s_States_Report_2017-pdf-155-320.jpg)
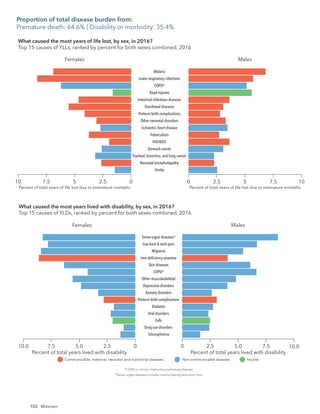
![153
Mizoram
Lower respiratory infections [9.9%]
Diarrhoeal diseases [6.7%]
Malaria [5.1%]
Intestinal infectious diseases [4.6%]
Tuberculosis [4.1%]
Preterm birth complications [3.7%]
COPD†
[3.2%]
Other neonatal disorders [3.1%]
Neonatal encephalopathy [2.6%]
Road injuries [2.2%]
Congenital birth defects [2.1%]
Sense organ diseases‡
[1.8%]
Skin diseases [1.8%]
Low back & neck pain [1.7%]
Iron-deficiency anaemia [1.7%]
Migraine [1.7%]
Ischaemic heart disease [1.3%]
COPD†
[5.5%]
Malaria [4.7%]*
Lower respiratory infections [4.4%]
Preterm birth complications [3.2%]*
Diarrhoeal diseases [3.1%]
Road injuries [3.0%]
Sense organ diseases‡
[3.0%]
Intestinal infectious diseases [2.6%]
Low back & neck pain [2.6%]
Migraine [2.5%]
Skin diseases [2.3%]
Iron-deficiency anaemia [2.3%]
Ischaemic heart disease [2.2%]
Tuberculosis [2.2%]
Other neonatal disorders [2.1%]*
Congenital birth defects [1.7%]*
Neonatal encephalopathy [1.6%]*
1
2
3
4
5
6
7
8
9
10
11
12
13
14
15
1
2
3
4
5
6
7
8
9
10
11
12
13
14
15
22
23
16
20
Leading causes of DALYs 1990
How have the leading causes of death and disability combined changed from 1990 to 2016?
Change in top 15 causes of DALYs, both sexes, ranked by number of DALYs, 1990–2016
Leading causes of DALYs 2016
Communicable, maternal,
neonatal, and nutritional diseases
Non-communicable diseases Injuries same or increase decrease
*Change not significant.
The percent figure in brackets next to each cause is
DALYs from that cause out of total DALYs.
†
COPD is chronic obstructive pulmonary disease.
‡
Sense organ diseases includes mainly hearing and vision loss.
§
Self-harm refers to suicide and the nonfatal outcomes of self-harm.
[1.95]
[0.32] [0.33]
[0.48]
[0.58] [0.65]
[0.73]
[0.86] [0.97]
[1.18]
[1.45]
[1.83]
[2.25]
[2.81]
[3.37] [3.85]
[4.46]
[5.02]
The number in the bracket on top of each vertical bar is the ratio of percent DALYs to population for that age group.
The number in parentheses after each age group on the x-axis is the percent of population in that age group.
Communicable, maternal, neonatal, and nutritional diseases
Percent
of
total
DALYs
Age
Non-communicable diseases Injuries
What caused the most death and disability combined across age groups in 2016?
Percent of DALYs by age group, both sexes, 2016
U
n
d
e
r
5
(
9
%
)
5
t
o
9
(
1
0
%
)
1
0
t
o
1
4
(
9
%
)
1
5
t
o
1
9
(
1
0
%
)
2
0
t
o
2
4
(
1
0
%
)
2
5
t
o
2
9
(
9
%
)
3
0
t
o
3
4
(
9
%
)
3
5
t
o
3
9
(
7
%
)
4
0
t
o
4
4
(
6
%
)
4
5
t
o
4
9
(
5
%
)
5
0
t
o
5
4
(
5
%
)
5
5
t
o
5
9
(
4
%
)
6
0
t
o
6
4
(
2
%
)
6
5
t
o
6
9
(
2
%
)
7
0
t
o
7
4
(
1
%
)
7
5
t
o
7
9
(
1
%
)
8
0
t
o
8
4
(
<
1
%
)
8
5
+
(
<
1
%
)
0
15
20
5
10
How have the leading causes of death and disability combined changed from 1990 to 2016?
Change in top 15 causes of DALYs, both sexes, ranked by number of DALYs, 1990–2016
What caused the most death and disability combined across age groups in 2016?
Percent of DALYs by age group, both sexes, 2016
Proportion of total disease burden from:
CMNNDs: 34.6% | NCDs: 55.5% | Injuries: 9.8%](https://image.slidesharecdn.com/indiahealthofthenationsstatesreport2017-230818115250-fe055a08/85/India_Health_of_the_Nation-s_States_Report_2017-pdf-157-320.jpg)
![154 Mizoram
What risk factors are driving the most death and disability combined?
Contribution of top 10 risks to DALYs number, both sexes, ranked by number of DALYs, 19
Risk factors 1990 Risk factors 2016
The percent figure in bracket next to each risk is DALYs from that risk out of total DALYs. *Malnutrition is child and maternal malnutrition.
†
WaSH is unsafe water, sanitation, and handwashing.
same or increase decrease
Behavioural Environmental/occupational Metabolic
Malnutrition* [22.4%]
Air pollution [8.3%]
Tobacco use [7.3%]
WaSH†
[7.3%]
Dietary risks [2.5%]
Alcohol & drug use [2.4%]
Occupational risks [2.4%]
High blood pressure [2.2%]
High fasting plasma glucose [1.8%]
Impaired kidney function [1.3%]
Malnutrition* [11.5%]
Tobacco use [11.0%]
Air pollution [5.4%]
Alcohol & drug use [4.1%]
Dietary risks [3.6%]
High fasting plasma glucose [3.5%]
High blood pressure [3.3%]
Occupational risks [3.0%]
WaSH†
[2.9%]
Impaired kidney function [1.9%]
1
2
3
4
5
6
7
8
9
10
1
2
3
4
5
6
7
8
9
10
Risk factors 1990 Risk factors 2016
The percent figure in bracket next to each risk is DALYs from that risk out of total DALYs. *Malnutrition is child and maternal malnutrition.
†
WaSH is unsafe water, sanitation, and handwashing.
What risk factors are driving the most death and disability combined?
Contribution of top 10 risks to DALYs number, both sexes, ranked by number of DALYs, 1990-2016
same or increase decrease
Behavioural Environmental/occupational Metabolic
Malnutrition* [32.2%]
WaSH†
[15.2%]
Air pollution [7.7%]
Tobacco use [3.6%]
Dietary risks [2.3%]
High blood pressure [2.2%]
Occupational risks [1.9%]
Alcohol & drug use [1.6%]
High fasting plasma glucose [1.4%]
Impaired kidney function [0.9%]
Malnutrition* [14.8%]
Air pollution [5.1%]
High blood pressure [5.0%]
Tobacco use [4.9%]
Dietary risks [4.7%]
High fasting plasma glucose [4.0%]
WaSH†
[3.9%]
Alcohol & drug use [3.9%]
Occupational risks [2.6%]
Impaired kidney function [2.0%]
1
2
3
4
5
6
7
8
9
10
1
2
3
4
5
6
7
8
9
10
Females
Unsafe sex
WaSH†
Occupational risks
High blood pressure
High fasting plasma glucose
Dietary risks
Alcohol & drug use
Air pollution
Tobacco use
Malnutrition*
Males
5
0 15
10
5
15 0
10
Percent of years of life lost and years lived with disability Percent of years of life lost and years lived with disability
How did the risk factors differ by sex in 2016?
Percent of total DALYs attributable to top 10 risks, ranked by percent for both sexes combined, 2016
Behavioural Environmental/occupational Metabolic
*Malnutrition is child and maternal malnutrition.
†WaSH is unsafe water, sanitation, and handwashing.
What risk factors are driving the most death and disability combined?
Contribution of top 10 risks to DALYs number, both sexes, ranked by number of DALYs, 1990-2016](https://image.slidesharecdn.com/indiahealthofthenationsstatesreport2017-230818115250-fe055a08/85/India_Health_of_the_Nation-s_States_Report_2017-pdf-158-320.jpg)
![155
0
50
100
150
1990 1995 2000 2005 2010 2016
Year
Deaths
per
1,000
live
births
Nagaland under-5 rate India under-5 rate Comparative average rate globally for similar
Socio-demographic Index as Nagaland
39.2
28.9
22.1
How much did the under-5 mortality rate change from 1990 to 2016?
Under-5 mortality rate, both sexes combined, 1990-2016
2016 life expectancy
Females: 74.5 years Males: 69.1 years
1990 life expectancy
Females: 64.9 years Males: 63.1 years
Nagaland
3.8%
36.5%
5.7%
31.8%
3.6%
1.3%
1%
5.4%
1.3%
5.4%
4.2%
8%
17.1%
10%
4%
6.8%
10% 4.3%
9.2%
9.1%
7.7%
13.8%
8.8%
6.5%
18.9%
27.9%
5.1%
9.2%
3.5%
6.8%
2.9%
3.8%
6.7%
3.9%
16.2%
9.2%
34.9%
8.8%
2.5%
3%
5.7%
8.5%
4%
3.3%
0−14 years [11% of total deaths] 15−39 years [16.4% of total deaths]
40−69 years [37.8% of total deaths] 70+ years [34.8% of total deaths]
What caused the most deaths in different age groups in 2016?
Percent contribution of top 10 causes of death by age group, both sexes, 2016
HIV/AIDS & tuberculosis
Diarrhoea/LRI*/other
NTDs†
& malaria
Maternal disorders
Neonatal disorders
Nutritional deficiencies
Other communicable diseases
Cancers
Cardiovascular diseases
Chronic respiratory diseases
Cirrhosis
Digestive diseases
Neurological disorders
Diabetes/urog‡
/blood/endo§
Other non-communicable
Transport injuries
Unintentional injuries
Suicide & violence
Other causes of death
*LRI is lower respiratory infections.
†
NTDs are neglected tropical diseases.
‡
Urog is urogenital diseases.
§
Endo is endocrine diseases.
How much did the under-5 mortality rate change from 1990 to 2016?
Under-5 mortality rate, both sexes combined, 1990-2016
What caused the most deaths in different age groups in 2016?
Percent contribution of top 10 causes of death by age group, both sexes, 2016
Nagaland](https://image.slidesharecdn.com/indiahealthofthenationsstatesreport2017-230818115250-fe055a08/85/India_Health_of_the_Nation-s_States_Report_2017-pdf-159-320.jpg)
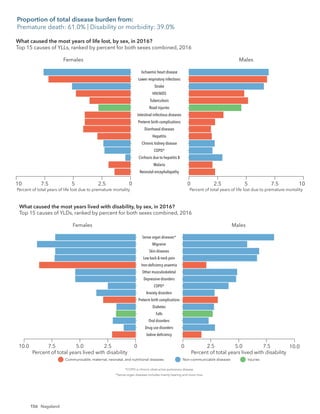
![157
Nagaland
Ischaemic heart disease [4.6%]
Lower respiratory infections [4.3%]
Stroke [3.9%]
HIV/AIDS [3.1%]
Sense organ diseases‡
[3.0%]
Tuberculosis [3.0%]
Preterm birth complications [2.9%]*
Skin diseases [2.9%]
Migraine [2.8%]
Road injuries [2.8%]
Low back & neck pain [2.7%]
COPD†
[2.6%]
Iron-deficiency anaemia [2.1%]
Intestinal infectious diseases [2.1%]
Diarrhoeal diseases [2.1%]
Hepatitis [1.5%]
Neonatal encephalopathy [1.4%]*
Malaria [1.3%]*
Other neonatal disorders [1.0%]*
Neonatal haemolytic disease [0.6%]
Measles [0.5%]
Tetanus [0.1%]
Lower respiratory infections [11.3%]
Diarrhoeal diseases [7.9%]
Tuberculosis [4.8%]
Preterm birth complications [4.1%]
Measles [3.7%]
Intestinal infectious diseases [2.9%]
Hepatitis [2.6%]
Stroke [2.5%]
Ischaemic heart disease [2.5%]
Malaria [2.4%]
Neonatal encephalopathy [2.4%]
Tetanus [2.4%]
Neonatal haemolytic disease [1.9%]
COPD†
[1.8%]
Other neonatal disorders [1.7%]
Road injuries [1.7%]
Sense organ diseases‡
[1.6%]
Skin diseases [1.5%]
Low back & neck pain [1.5%]
Migraine [1.4%]
Iron-deficiency anaemia [1.2%]
HIV/AIDS [0.1%]
1
2
3
4
5
6
7
8
9
10
11
12
13
14
15
1
2
3
4
5
6
7
8
9
10
11
12
13
14
15
21
22
24
30
44
59
103
21
22
24
26
94
16
17
Leading causes of DALYs 1990
How have the leading causes of death and disability combined changed from 1990 to 2016?
Change in top 15 causes of DALYs, both sexes, ranked by number of DALYs, 1990–2016
Leading causes of DALYs 2016
Communicable, maternal,
neonatal, and nutritional diseases
Non-communicable diseases Injuries same or increase decrease
*Change not significant.
The percent figure in brackets next to each cause is
DALYs from that cause out of total DALYs.
†
COPD is chronic obstructive pulmonary disease.
‡
Sense organ diseases includes mainly hearing and vision loss.
§
Self-harm refers to suicide and the nonfatal outcomes of self-harm.
[2.16]
[0.35]
[0.37]
[0.55]
[0.66] [0.74] [0.84]
[0.98] [1.11]
[1.34] [1.65]
[2.07]
[2.55]
[3.17]
[3.81] [4.35]
[5.12]
[5.8]
The number in the bracket on top of each vertical bar is the ratio of percent DALYs to population for that age group.
The number in parentheses after each age group on the x-axis is the percent of population in that age group.
Communicable, maternal, neonatal, and nutritional diseases
Percent
of
total
DALYs
Age
Non-communicable diseases Injuries
What caused the most death and disability combined across age groups in 2016?
Percent of DALYs by age group, both sexes, 2016
U
n
d
e
r
5
(
6
%
)
5
t
o
9
(
1
2
%
)
1
0
t
o
1
4
(
1
2
%
)
1
5
t
o
1
9
(
1
2
%
)
2
0
t
o
2
4
(
1
1
%
)
2
5
t
o
2
9
(
9
%
)
3
0
t
o
3
4
(
8
%
)
3
5
t
o
3
9
(
7
%
)
4
0
t
o
4
4
(
6
%
)
4
5
t
o
4
9
(
5
%
)
5
0
t
o
5
4
(
4
%
)
5
5
t
o
5
9
(
3
%
)
6
0
t
o
6
4
(
2
%
)
6
5
t
o
6
9
(
1
%
)
7
0
t
o
7
4
(
1
%
)
7
5
t
o
7
9
(
1
%
)
8
0
t
o
8
4
(
<
1
%
)
8
5
+
(
<
1
%
)
0
12
16
4
8
How have the leading causes of death and disability combined changed from 1990 to 2016?
Change in top 15 causes of DALYs, both sexes, ranked by number of DALYs, 1990–2016
What caused the most death and disability combined across age groups in 2016?
Percent of DALYs by age group, both sexes, 2016
Proportion of total disease burden from:
CMNNDs: 32.2% | NCDs: 57.2% | Injuries: 10.6%](https://image.slidesharecdn.com/indiahealthofthenationsstatesreport2017-230818115250-fe055a08/85/India_Health_of_the_Nation-s_States_Report_2017-pdf-161-320.jpg)
![158 Nagaland
What risk factors are driving the most death and disability combined?
Contribution of top 10 risks to DALYs number, both sexes, ranked by number of DALYs, 19
Risk factors 1990 Risk factors 2016
The percent figure in bracket next to each risk is DALYs from that risk out of total DALYs. *Malnutrition is child and maternal malnutrition.
†
WaSH is unsafe water, sanitation, and handwashing.
Risk factors 1990 Risk factors 2016
same or increase decrease
Behavioural Environmental/occupational Metabolic
Malnutrition* [27.3%]
Air pollution [10.0%]
WaSH†
[8.1%]
High blood pressure [4.1%]
Dietary risks [3.9%]
Tobacco use [3.7%]
Alcohol & drug use [2.3%]
Occupational risks [2.0%]
High fasting plasma glucose [1.6%]
Impaired kidney function [1.4%]
Malnutrition* [10.2%]
High blood pressure [7.5%]
Dietary risks [6.1%]
Air pollution [5.6%]
Alcohol & drug use [5.3%]
Tobacco use [4.4%]
High fasting plasma glucose [4.2%]
Occupational risks [2.7%]
High total cholesterol [2.6%]
Impaired kidney function [2.6%]
1
2
3
4
5
6
7
8
9
10
1
2
3
4
5
6
7
8
9
10
High total cholesterol [1.3%] WaSH†
[9.5%]
11 12
Risk factors 1990 Risk factors 2016
The percent figure in bracket next to each risk is DALYs from that risk out of total DALYs. *Malnutrition is child and maternal malnutrition.
†
WaSH is unsafe water, sanitation, and handwashing.
What risk factors are driving the most death and disability combined?
Contribution of top 10 risks to DALYs number, both sexes, ranked by number of DALYs, 1990-2016
same or increase decrease
Behavioural Environmental/occupational Metabolic
Malnutrition* [32.2%]
WaSH†
[15.2%]
Air pollution [7.7%]
Tobacco use [3.6%]
Dietary risks [2.3%]
High blood pressure [2.2%]
Occupational risks [1.9%]
Alcohol & drug use [1.6%]
High fasting plasma glucose [1.4%]
Impaired kidney function [0.9%]
Malnutrition* [14.8%]
Air pollution [5.1%]
High blood pressure [5.0%]
Tobacco use [4.9%]
Dietary risks [4.7%]
High fasting plasma glucose [4.0%]
WaSH†
[3.9%]
Alcohol & drug use [3.9%]
Occupational risks [2.6%]
Impaired kidney function [2.0%]
1
2
3
4
5
6
7
8
9
10
1
2
3
4
5
6
7
8
9
10
Females
Impaired kidney function
High total cholesterol
Occupational risks
High fasting plasma glucose
Tobacco use
Alcohol & drug use
Air pollution
Dietary risks
High blood pressure
Malnutrition*
Males
5
0 10
5 0
10
Percent of years of life lost and years lived with disability Percent of years of life lost and years lived with disability
How did the risk factors differ by sex in 2016?
Percent of total DALYs attributable to top 10 risks, ranked by percent for both sexes combined, 2016
Behavioural Environmental/occupational Metabolic
*Malnutrition is child and maternal malnutrition.
What risk factors are driving the most death and disability combined?
Contribution of top 10 risks to DALYs number, both sexes, ranked by number of DALYs, 1990-2016](https://image.slidesharecdn.com/indiahealthofthenationsstatesreport2017-230818115250-fe055a08/85/India_Health_of_the_Nation-s_States_Report_2017-pdf-162-320.jpg)
![159
0
50
100
150
1990 1995 2000 2005 2010 2016
Year
Deaths
per
1,000
live
births
Odisha under-5 rate India under-5 rate Comparative average rate globally for similar
Socio-demographic Index as Odisha
39.2
38.5
40.8
How much did the under-5 mortality rate change from 1990 to 2016?
Under-5 mortality rate, both sexes combined, 1990-2016
2016 life expectancy
Females: 68.6 years Males: 66.1 years
1990 life expectancy
Females: 55.3 years Males: 53.7 years
Odisha
1.4%
27.9%
12.7%
38.1%
1.9%
1.8%
1.1%
5.7%
0.8%
5%
3.5%
13%
12.4%
3.8%
3.8%
5.9%
9.9%
5.4%
9%
9.5%
12.3%
14.9%
8.3%
14.6%
12.3%
27.9%
5.6%
2.4%
5%
8.2%
2.6%
5.1%
7.8%
3.6%
31.5%
0.8%
6.3%
26.5%
8.1%
3.5%
3.7%
7.7%
5%
3.4%
0−14 years [9% of total deaths] 15−39 years [10.8% of total deaths]
40−69 years [41.3% of total deaths] 70+ years [38.9% of total deaths]
What caused the most deaths in different age groups in 2016?
Percent contribution of top 10 causes of death by age group, both sexes, 2016
HIV/AIDS & tuberculosis
Diarrhoea/LRI*/other
NTDs†
& malaria
Maternal disorders
Neonatal disorders
Nutritional deficiencies
Other communicable diseases
Cancers
Cardiovascular diseases
Chronic respiratory diseases
Cirrhosis
Digestive diseases
Neurological disorders
Diabetes/urog‡
/blood/endo§
Other non-communicable
Transport injuries
Unintentional injuries
Suicide & violence
Other causes of death
*LRI is lower respiratory infections.
†
NTDs are neglected tropical diseases.
‡
Urog is urogenital diseases.
§
Endo is endocrine diseases.
How much did the under-5 mortality rate change from 1990 to 2016?
Under-5 mortality rate, both sexes combined, 1990-2016
What caused the most deaths in different age groups in 2016?
Percent contribution of top 10 causes of death by age group, both sexes, 2016
Odisha](https://image.slidesharecdn.com/indiahealthofthenationsstatesreport2017-230818115250-fe055a08/85/India_Health_of_the_Nation-s_States_Report_2017-pdf-163-320.jpg)
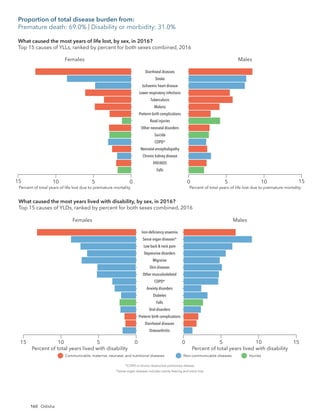
![161
Odisha
Diarrhoeal diseases [7.6%]
Stroke [5.8%]
Ischaemic heart disease [4.5%]
Lower respiratory infections [4.0%]
Tuberculosis [3.5%]
Iron-deficiency anaemia [3.2%]
Malaria [3.1%]*
COPD†
[3.0%]*
Sense organ diseases‡
[2.8%]
Preterm birth complications [2.5%]
Road injuries [2.3%]
Low back & neck pain [2.2%]
Falls [2.1%]
Chronic kidney disease [2.0%]
Other neonatal disorders [2.0%]
Neonatal encephalopathy [1.8%]
Congenital birth defects [1.2%]
Hepatitis [1.0%]
Measles [0.2%]
Tetanus [0.1%]
Diarrhoeal diseases [13.1%]
Lower respiratory infections [10.0%]
Tuberculosis [5.9%]
Measles [5.2%]
Malaria [4.4%]
Other neonatal disorders [4.2%]
Preterm birth complications [4.1%]
Neonatal encephalopathy [3.6%]
Stroke [2.7%]
COPD†
[2.2%]
Tetanus [1.8%]
Congenital birth defects [1.7%]
Iron-deficiency anaemia [1.7%]
Ischaemic heart disease [1.5%]
Hepatitis [1.4%]
Sense organ diseases‡
[1.1%]
Falls [1.0%]
Low back & neck pain [1.0%]
Road injuries [0.9%]
Chronic kidney disease [0.9%]
1
2
3
4
5
6
7
8
9
10
11
12
13
14
15
1
2
3
4
5
6
7
8
9
10
11
12
13
14
15
21
24
25
83
131
24
28
30
20
23
Leading causes of DALYs 1990
How have the leading causes of death and disability combined changed from 1990 to 2016?
Change in top 15 causes of DALYs, both sexes, ranked by number of DALYs, 1990–2016
Leading causes of DALYs 2016
Communicable, maternal,
neonatal, and nutritional diseases
Non-communicable diseases Injuries same or increase decrease
*Change not significant.
The percent figure in brackets next to each cause is
DALYs from that cause out of total DALYs.
†
COPD is chronic obstructive pulmonary disease.
‡
Sense organ diseases includes mainly hearing and vision loss.
§
Self-harm refers to suicide and the nonfatal outcomes of self-harm.
[1.8]
[0.3] [0.3]
[0.44]
[0.54]
[0.59] [0.65]
[0.78]
[0.89]
[1.08]
[1.33]
[1.65]
[2.05]
[2.58]
[3.13]
[3.55]
[4.03]
[4.37]
The number in the bracket on top of each vertical bar is the ratio of percent DALYs to population for that age group.
The number in parentheses after each age group on the x-axis is the percent of population in that age group.
Communicable, maternal, neonatal, and nutritional diseases
Percent
of
total
DALYs
Age
Non-communicable diseases Injuries
What caused the most death and disability combined across age groups in 2016?
Percent of DALYs by age group, both sexes, 2016
U
n
d
e
r
5
(
9
%
)
5
t
o
9
(
9
%
)
1
0
t
o
1
4
(
9
%
)
1
5
t
o
1
9
(
9
%
)
2
0
t
o
2
4
(
9
%
)
2
5
t
o
2
9
(
9
%
)
3
0
t
o
3
4
(
8
%
)
3
5
t
o
3
9
(
7
%
)
4
0
t
o
4
4
(
7
%
)
4
5
t
o
4
9
(
6
%
)
5
0
t
o
5
4
(
5
%
)
5
5
t
o
5
9
(
4
%
)
6
0
t
o
6
4
(
4
%
)
6
5
t
o
6
9
(
2
%
)
7
0
t
o
7
4
(
2
%
)
7
5
t
o
7
9
(
1
%
)
8
0
t
o
8
4
(
1
%
)
8
5
+
(
<
1
%
)
0
15
5
10
How have the leading causes of death and disability combined changed from 1990 to 2016?
Change in top 15 causes of DALYs, both sexes, ranked by number of DALYs, 1990–2016
What caused the most death and disability combined across age groups in 2016?
Percent of DALYs by age group, both sexes, 2016
Proportion of total disease burden from:
CMNNDs: 36.9% | NCDs: 52.1% | Injuries: 11.1%](https://image.slidesharecdn.com/indiahealthofthenationsstatesreport2017-230818115250-fe055a08/85/India_Health_of_the_Nation-s_States_Report_2017-pdf-165-320.jpg)
![162 Odisha
What risk factors are driving the most death and disability combined?
Contribution of top 10 risks to DALYs number, both sexes, ranked by number of DALYs, 19
Risk factors 1990 Risk factors 2016
The percent figure in bracket next to each risk is DALYs from that risk out of total DALYs. *Malnutrition is child and maternal malnutrition.
†
WaSH is unsafe water, sanitation, and handwashing.
Risk factors 1990 Risk factors 2016
same or increase decrease
Behavioural Environmental/occupational Metabolic
Malnutrition* [35.5%]
WaSH†
[13.7%]
Air pollution [10.0%]
Tobacco use [3.6%]
High blood pressure [3.2%]
Dietary risks [3.2%]
Alcohol & drug use [1.7%]
High fasting plasma glucose [1.6%]
Occupational risks [1.6%]
Impaired kidney function [1.3%]
Malnutrition* [12.7%]
Air pollution [8.2%]
High blood pressure [7.6%]
WaSH†
[7.4%]
Dietary risks [7.0%]
High fasting plasma glucose [5.2%]
Tobacco use [4.0%]
Alcohol & drug use [3.8%]
High body-mass index [3.2%]
Impaired kidney function [3.0%]
1
2
3
4
5
6
7
8
9
10
1
2
3
4
5
6
7
8
9
10
High body-mass index [0.5%] Occupational risks [2.5%]
12 11
Risk factors 1990 Risk factors 2016
The percent figure in bracket next to each risk is DALYs from that risk out of total DALYs. *Malnutrition is child and maternal malnutrition.
†
WaSH is unsafe water, sanitation, and handwashing.
What risk factors are driving the most death and disability combined?
Contribution of top 10 risks to DALYs number, both sexes, ranked by number of DALYs, 1990-2016
same or increase decrease
Behavioural Environmental/occupational Metabolic
Malnutrition* [32.2%]
WaSH†
[15.2%]
Air pollution [7.7%]
Tobacco use [3.6%]
Dietary risks [2.3%]
High blood pressure [2.2%]
Occupational risks [1.9%]
Alcohol & drug use [1.6%]
High fasting plasma glucose [1.4%]
Impaired kidney function [0.9%]
Malnutrition* [14.8%]
Air pollution [5.1%]
High blood pressure [5.0%]
Tobacco use [4.9%]
Dietary risks [4.7%]
High fasting plasma glucose [4.0%]
WaSH†
[3.9%]
Alcohol & drug use [3.9%]
Occupational risks [2.6%]
Impaired kidney function [2.0%]
1
2
3
4
5
6
7
8
9
10
1
2
3
4
5
6
7
8
9
10
Females
Impaired kidney function
High body-mass index
Alcohol & drug use
Tobacco use
High fasting plasma glucose
Dietary risks
WaSH†
High blood pressure
Air pollution
Malnutrition*
Males
4 0
12 8 8 12
0 4
Percent of years of life lost and years lived with disability Percent of years of life lost and years lived with disability
How did the risk factors differ by sex in 2016?
Percent of total DALYs attributable to top 10 risks, ranked by percent for both sexes combined, 2016
Behavioural Environmental/occupational Metabolic
*Malnutrition is child and maternal malnutrition.
†
WaSH is unsafe water, sanitation, and handwashing.
What risk factors are driving the most death and disability combined?
Contribution of top 10 risks to DALYs number, both sexes, ranked by number of DALYs, 1990-2016](https://image.slidesharecdn.com/indiahealthofthenationsstatesreport2017-230818115250-fe055a08/85/India_Health_of_the_Nation-s_States_Report_2017-pdf-166-320.jpg)
![163
0
50
100
150
1990 1995 2000 2005 2010 2016
Year
Deaths
per
1,000
live
births
Punjab under-5 rate India under-5 rate Comparative average rate globally for similar
Socio-demographic Index as Punjab
39.2
29.4
23.6
How much did the under-5 mortality rate change from 1990 to 2016?
Under-5 mortality rate, both sexes combined, 1990-2016
2016 life expectancy
Females: 72.2 years Males: 68.0 years
1990 life expectancy
Females: 64.2 years Males: 62.2 years
Punjab
32.7%
2%
38.2%
1.6%
1.4%
1.6%
1.2%
9.4%
2.1%
5.1%
4.7% 8.5%
8.2%
2.7%
5.7%
21.7%
3.1%
5.5%
16.2%
9.2%
9.3%
9.9%
4.2%
5.5%
11.5%
44.2%
6.9%
3%
1.8%
10.9%
4.1%
3.6%
4.4%
2.3%
12.2%
5.5%
46.6%
9.4%
1.3%
4.4%
11.6%
1%
3.5%
2.1%
0−14 years [5.2% of total deaths] 15−39 years [10.3% of total deaths]
40−69 years [39.1% of total deaths] 70+ years [45.4% of total deaths]
What caused the most deaths in different age groups in 2016?
Percent contribution of top 10 causes of death by age group, both sexes, 2016
HIV/AIDS & tuberculosis
Diarrhoea/LRI*/other
NTDs†
& malaria
Maternal disorders
Neonatal disorders
Nutritional deficiencies
Other communicable diseases
Cancers
Cardiovascular diseases
Chronic respiratory diseases
Cirrhosis
Digestive diseases
Neurological disorders
Diabetes/urog‡
/blood/endo§
Other non-communicable
Transport injuries
Unintentional injuries
Suicide & violence
Other causes of death
*LRI is lower respiratory infections.
†
NTDs are neglected tropical diseases.
‡
Urog is urogenital diseases.
§
Endo is endocrine diseases.
How much did the under-5 mortality rate change from 1990 to 2016?
Under-5 mortality rate, both sexes combined, 1990-2016
What caused the most deaths in different age groups in 2016?
Percent contribution of top 10 causes of death by age group, both sexes, 2016
Punjab](https://image.slidesharecdn.com/indiahealthofthenationsstatesreport2017-230818115250-fe055a08/85/India_Health_of_the_Nation-s_States_Report_2017-pdf-167-320.jpg)
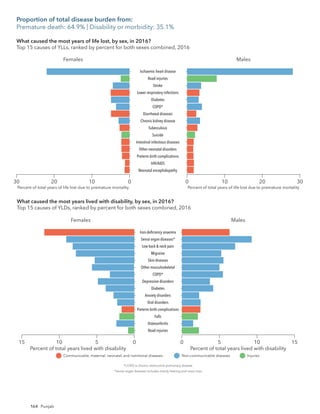
![165
Ischaemic heart disease [17.1%]
Road injuries [4.2%]
COPD†
[4.0%]*
Diabetes [3.9%]
Iron-deficiency anaemia [3.2%]
Sense organ diseases‡
[3.2%]
Stroke [2.9%]
Low back & neck pain [2.7%]
Lower respiratory infections [2.6%]
Diarrhoeal diseases [2.6%]
Chronic kidney disease [2.5%]
Migraine [2.3%]
Skin diseases [2.0%]
Tuberculosis [1.9%]
Preterm birth complications [1.9%]
Congenital birth defects [1.4%]
Intestinal infectious diseases [1.3%]
Other neonatal disorders [1.3%]
Neonatal encephalopathy [1.1%]
Meningitis [0.7%]
Diarrhoeal diseases [12.9%]
Ischaemic heart disease [8.2%]
Lower respiratory infections [6.5%]
Preterm birth complications [4.1%]
Tuberculosis [3.9%]
Neonatal encephalopathy [3.8%]
Other neonatal disorders [3.5%]
COPD†
[3.4%]
Congenital birth defects [2.7%]
Iron-deficiency anaemia [2.5%]
Intestinal infectious diseases [2.4%]
Road injuries [2.3%]
Stroke [2.1%]
Sense organ diseases‡
[1.7%]
Meningitis [1.7%]
Low back & neck pain [1.6%]
Chronic kidney disease [1.4%]
Skin diseases [1.4%]
Migraine [1.3%]
Diabetes [1.3%]
1
2
3
4
5
6
7
8
9
10
11
12
13
14
15
1
2
3
4
5
6
7
8
9
10
11
12
13
14
15
20
21
22
24
35
19
20
21
16
18
Leading causes of DALYs 1990
How have the leading causes of death and disability combined changed from 1990 to 2016?
Change in top 15 causes of DALYs, both sexes, ranked by number of DALYs, 1990–2016
Leading causes of DALYs 2016
Communicable, maternal,
neonatal, and nutritional diseases
Non-communicable diseases Injuries same or increase decrease
*Change not significant.
The percent figure in brackets next to each cause is
DALYs from that cause out of total DALYs.
†
COPD is chronic obstructive pulmonary disease.
‡
Sense organ diseases includes mainly hearing and vision loss.
§
Self-harm refers to suicide and the nonfatal outcomes of self-harm.
[1.58]
[0.29]
[0.3]
[0.44]
[0.55]
[0.6]
[0.68] [0.79]
[0.9]
[1.1]
[1.36] [1.68]
[2.08]
[2.61]
[3.15]
[3.57]
[4.12]
[4.61]
The number in the bracket on top of each vertical bar is the ratio of percent DALYs to population for that age group.
The number in parentheses after each age group on the x-axis is the percent of population in that age group.
Communicable, maternal, neonatal, and nutritional diseases
Percent
of
total
DALYs
Age
Non-communicable diseases Injuries
What caused the most death and disability combined across age groups in 2016?
Percent of DALYs by age group, both sexes, 2016
U
n
d
e
r
5
(
6
%
)
5
t
o
9
(
8
%
)
1
0
t
o
1
4
(
8
%
)
1
5
t
o
1
9
(
9
%
)
2
0
t
o
2
4
(
1
0
%
)
2
5
t
o
2
9
(
9
%
)
3
0
t
o
3
4
(
8
%
)
3
5
t
o
3
9
(
7
%
)
4
0
t
o
4
4
(
7
%
)
4
5
t
o
4
9
(
6
%
)
5
0
t
o
5
4
(
5
%
)
5
5
t
o
5
9
(
4
%
)
6
0
t
o
6
4
(
4
%
)
6
5
t
o
6
9
(
3
%
)
7
0
t
o
7
4
(
2
%
)
7
5
t
o
7
9
(
1
%
)
8
0
t
o
8
4
(
1
%
)
8
5
+
(
1
%
)
0
9
3
6
How have the leading causes of death and disability combined changed from 1990 to 2016?
Change in top 15 causes of DALYs, both sexes, ranked by number of DALYs, 1990–2016
What caused the most death and disability combined across age groups in 2016?
Percent of DALYs by age group, both sexes, 2016
Proportion of total disease burden from:
CMNNDs: 22.4% | NCDs: 66.0% | Injuries: 11.6%
Punjab](https://image.slidesharecdn.com/indiahealthofthenationsstatesreport2017-230818115250-fe055a08/85/India_Health_of_the_Nation-s_States_Report_2017-pdf-169-320.jpg)
![166 Punjab
Risk factors 1990 Risk factors 2016
The percent figure in bracket next to each risk is DALYs from that risk out of total DALYs. *Malnutrition is child and maternal malnutrition.
†
WaSH is unsafe water, sanitation, and handwashing.
What risk factors are driving the most death and disability combined?
Contribution of top 10 risks to DALYs number, both sexes, ranked by number of DALYs, 19
same or increase decrease
Behavioural Environmental/occupational Metabolic
Malnutrition* [29.7%]
WaSH†
[12.8%]
Air pollution [11.5%]
Dietary risks [8.3%]
High blood pressure [7.3%]
Tobacco use [4.0%]
High fasting plasma glucose [4.0%]
High total cholesterol [3.4%]
Occupational risks [2.4%]
High body-mass index [2.4%]
High blood pressure [15.3%]
Dietary risks [14.6%]
Air pollution [10.4%]
High fasting plasma glucose [10.0%]
Malnutrition* [8.9%]
High body-mass index [8.8%]
High total cholesterol [6.6%]
Tobacco use [4.8%]
Impaired kidney function [4.4%]
Alcohol & drug use [3.6%]
1
2
3
4
5
6
7
8
9
10
1
2
3
4
5
6
7
8
9
10
Impaired kidney function [2.3%] Occupational risks [3.6%]
11 11
Alcohol & drug use [1.8%] WaSH
†
[2.4%]
12 12
Risk factors 1990 Risk factors 2016
The percent figure in bracket next to each risk is DALYs from that risk out of total DALYs. *Malnutrition is child and maternal malnutrition.
†
WaSH is unsafe water, sanitation, and handwashing.
What risk factors are driving the most death and disability combined?
Contribution of top 10 risks to DALYs number, both sexes, ranked by number of DALYs, 1990-2016
same or increase decrease
Behavioural Environmental/occupational Metabolic
Malnutrition* [32.2%]
WaSH†
[15.2%]
Air pollution [7.7%]
Tobacco use [3.6%]
Dietary risks [2.3%]
High blood pressure [2.2%]
Occupational risks [1.9%]
Alcohol & drug use [1.6%]
High fasting plasma glucose [1.4%]
Impaired kidney function [0.9%]
Malnutrition* [14.8%]
Air pollution [5.1%]
High blood pressure [5.0%]
Tobacco use [4.9%]
Dietary risks [4.7%]
High fasting plasma glucose [4.0%]
WaSH†
[3.9%]
Alcohol & drug use [3.9%]
Occupational risks [2.6%]
Impaired kidney function [2.0%]
1
2
3
4
5
6
7
8
9
10
1
2
3
4
5
6
7
8
9
10
Females
Alcohol & drug use
Impaired kidney function
Tobacco use
High total cholesterol
High body-mass index
Malnutrition*
High fasting plasma glucose
Air pollution
Dietary risks
High blood pressure
Males
5 0
15 10 10 15
0 5
Percent of years of life lost and years lived with disability Percent of years of life lost and years lived with disability
How did the risk factors differ by sex in 2016?
Percent of total DALYs attributable to top 10 risks, ranked by percent for both sexes combined, 2016
Behavioural Environmental/occupational Metabolic
*Malnutrition is child and maternal malnutrition.
What risk factors are driving the most death and disability combined?
Contribution of top 10 risks to DALYs number, both sexes, ranked by number of DALYs, 1990-2016](https://image.slidesharecdn.com/indiahealthofthenationsstatesreport2017-230818115250-fe055a08/85/India_Health_of_the_Nation-s_States_Report_2017-pdf-170-320.jpg)
![167
0
50
100
150
1990 1995 2000 2005 2010 2016
Year
Deaths
per
1,000
live
births
Rajasthan under-5 rate India under-5 rate Comparative average rate globally for similar
Socio-demographic Index as Rajasthan
39.2
45
44
How much did the under-5 mortality rate change from 1990 to 2016?
Under-5 mortality rate, both sexes combined, 1990-2016
2016 life expectancy
Females: 70.1 years Males: 65.5 years
1990 life expectancy
Females: 59.4 years Males: 57.2 years
Rajasthan
1.1%
41.7%
2.9%
36.6%
2.3%
1.2%
0.7%
4.7%
1.1%
4.8%
2.9%
12.4%
12.4%
6.1%
6.4%
10.6%
3.6% 2.9%
14.2%
9.8%
10.9%
10.7%
8.8%
8.8%
13.5%
27.5%
20.4%
2.2%
2.1%
4.2%
3.4%
3.8%
5.1%
3.9%
18.4%
6.7%
24.1%
30.4%
1.6%
4%
4.6%
0.8%
3.3%
2.1%
0−14 years [14.9% of total deaths] 15−39 years [11.6% of total deaths]
40−69 years [36.9% of total deaths] 70+ years [36.6% of total deaths]
What caused the most deaths in different age groups in 2016?
Percent contribution of top 10 causes of death by age group, both sexes, 2016
HIV/AIDS & tuberculosis
Diarrhoea/LRI*/other
NTDs†
& malaria
Maternal disorders
Neonatal disorders
Nutritional deficiencies
Other communicable diseases
Cancers
Cardiovascular diseases
Chronic respiratory diseases
Cirrhosis
Digestive diseases
Neurological disorders
Diabetes/urog‡
/blood/endo§
Other non-communicable
Transport injuries
Unintentional injuries
Suicide & violence
Other causes of death
*LRI is lower respiratory infections.
†
NTDs are neglected tropical diseases.
‡
Urog is urogenital diseases.
§
Endo is endocrine diseases.
How much did the under-5 mortality rate change from 1990 to 2016?
Under-5 mortality rate, both sexes combined, 1990-2016
What caused the most deaths in different age groups in 2016?
Percent contribution of top 10 causes of death by age group, both sexes, 2016
Rajasthan](https://image.slidesharecdn.com/indiahealthofthenationsstatesreport2017-230818115250-fe055a08/85/India_Health_of_the_Nation-s_States_Report_2017-pdf-171-320.jpg)
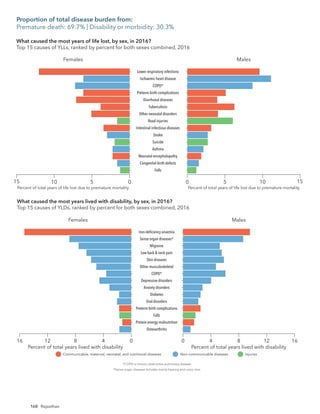
![169
Rajasthan
Lower respiratory infections [7.4%]
COPD†
[7.0%]
Ischaemic heart disease [6.4%]
Preterm birth complications [4.5%]*
Diarrhoeal diseases [4.1%]
Tuberculosis [3.8%]
Iron-deficiency anaemia [3.8%]
Road injuries [3.2%]
Other neonatal disorders [3.2%]*
Sense organ diseases‡
[2.6%]
Intestinal infectious diseases [2.3%]
Stroke [2.1%]
Migraine [1.9%]
Skin diseases [1.9%]
Asthma [1.9%]*
Neonatal encephalopathy [1.4%]*
Meningitis [0.9%]*
Measles [0.3%]
Tetanus [0.1%]
Lower respiratory infections [14.0%]
Diarrhoeal diseases [13.0%]
Tuberculosis [6.2%]
Preterm birth complications [5.0%]
Other neonatal disorders [4.0%]
Measles [3.5%]
COPD†
[3.4%]
Intestinal infectious diseases [3.1%]
Ischaemic heart disease [2.7%]
Iron-deficiency anaemia [2.3%]
Tetanus [2.2%]
Neonatal encephalopathy [2.0%]
Asthma [1.6%]
Road injuries [1.5%]
Meningitis [1.4%]
Sense organ diseases‡
[1.3%]
Stroke [1.2%]
Skin diseases [1.0%]
Migraine [1.0%]
1
2
3
4
5
6
7
8
9
10
11
12
13
14
15
1
2
3
4
5
6
7
8
9
10
11
12
13
14
15
19
28
55
109
21
22
16
18
Leading causes of DALYs 1990
How have the leading causes of death and disability combined changed from 1990 to 2016?
Change in top 15 causes of DALYs, both sexes, ranked by number of DALYs, 1990–2016
Leading causes of DALYs 2016
Communicable, maternal,
neonatal, and nutritional diseases
Non-communicable diseases Injuries same or increase decrease
*Change not significant.
The percent figure in brackets next to each cause is
DALYs from that cause out of total DALYs.
†
COPD is chronic obstructive pulmonary disease.
‡
Sense organ diseases includes mainly hearing and vision loss.
§
Self-harm refers to suicide and the nonfatal outcomes of self-harm.
[2.34]
[0.33] [0.32]
[0.45]
[0.54] [0.59] [0.66] [0.77] [0.89] [1.09]
[1.36] [1.68] [2.09]
[2.59]
[3.11]
[3.51]
[4.0]
[4.38]
The number in the bracket on top of each vertical bar is the ratio of percent DALYs to population for that age group.
.0The number in parentheses after each age group on the x-axis is the percent of population in that age group.
Communicable, maternal, neonatal, and nutritional diseases
Percent
of
total
DALYs
Age
Non-communicable diseases Injuries
What caused the most death and disability combined across age groups in 2016?
Percent of DALYs by age group, both sexes, 2016
U
n
d
e
r
5
(
1
0
%
)
5
t
o
9
(
1
1
%
)
1
0
t
o
1
4
(
1
1
%
)
1
5
t
o
1
9
(
1
0
%
)
2
0
t
o
2
4
(
9
%
)
2
5
t
o
2
9
(
8
%
)
3
0
t
o
3
4
(
8
%
)
3
5
t
o
3
9
(
6
%
)
4
0
t
o
4
4
(
6
%
)
4
5
t
o
4
9
(
5
%
)
5
0
t
o
5
4
(
4
%
)
5
5
t
o
5
9
(
4
%
)
6
0
t
o
6
4
(
3
%
)
6
5
t
o
6
9
(
2
%
)
7
0
t
o
7
4
(
1
%
)
7
5
t
o
7
9
(
1
%
)
8
0
t
o
8
4
(
1
%
)
8
5
+
(
<
1
%
)
0
20
25
5
10
15
How have the leading causes of death and disability combined changed from 1990 to 2016?
Change in top 15 causes of DALYs, both sexes, ranked by number of DALYs, 1990–2016
What caused the most death and disability combined across age groups in 2016?
Percent of DALYs by age group, both sexes, 2016
Proportion of total disease burden from:
CMNNDs: 39.9% | NCDs: 49.3% | Injuries: 10.8%](https://image.slidesharecdn.com/indiahealthofthenationsstatesreport2017-230818115250-fe055a08/85/India_Health_of_the_Nation-s_States_Report_2017-pdf-173-320.jpg)
![170 Rajasthan
What risk factors are driving the most death and disability combined?
Contribution of top 10 risks to DALYs number, both sexes, ranked by number of DALYs, 19
Risk factors 1990 Risk factors 2016
The percent figure in bracket next to each risk is DALYs from that risk out of total DALYs. *Malnutrition is child and maternal malnutrition.
†
WaSH is unsafe water, sanitation, and handwashing.
same or increase decrease
Behavioural Environmental/occupational Metabolic
Malnutrition* [38.7%]
WaSH†
[13.8%]
Air pollution [13.7%]
Tobacco use [4.9%]
Dietary risks [3.2%]
High blood pressure [2.7%]
Occupational risks [2.0%]
Alcohol & drug use [1.6%]
High total cholesterol [1.5%]
High fasting plasma glucose [1.5%]
Malnutrition* [20.1%]
Air pollution [12.4%]
Tobacco use [6.3%]
Dietary risks [6.3%]
High blood pressure [5.6%]
WaSH†
[4.3%]
High total cholesterol [3.6%
High fasting plasma glucose [3.5%]
Alcohol & drug use [3.2%]
Occupational risks [3.1%]
1
2
3
4
5
6
7
8
9
10
1
2
3
4
5
6
7
8
9
10
Risk factors 1990 Risk factors 2016
The percent figure in bracket next to each risk is DALYs from that risk out of total DALYs. *Malnutrition is child and maternal malnutrition.
†
WaSH is unsafe water, sanitation, and handwashing.
What risk factors are driving the most death and disability combined?
Contribution of top 10 risks to DALYs number, both sexes, ranked by number of DALYs, 1990-2016
same or increase decrease
Behavioural Environmental/occupational Metabolic
Malnutrition* [32.2%]
WaSH†
[15.2%]
Air pollution [7.7%]
Tobacco use [3.6%]
Dietary risks [2.3%]
High blood pressure [2.2%]
Occupational risks [1.9%]
Alcohol & drug use [1.6%]
High fasting plasma glucose [1.4%]
Impaired kidney function [0.9%]
Malnutrition* [14.8%]
Air pollution [5.1%]
High blood pressure [5.0%]
Tobacco use [4.9%]
Dietary risks [4.7%]
High fasting plasma glucose [4.0%]
WaSH†
[3.9%]
Alcohol & drug use [3.9%]
Occupational risks [2.6%]
Impaired kidney function [2.0%]
1
2
3
4
5
6
7
8
9
10
1
2
3
4
5
6
7
8
9
10
Females
Occupational risks
Alcohol & drug use
High fasting plasma glucose
High total cholesterol
WaSH†
High blood pressure
Dietary risks
Tobacco use
Air pollution
Malnutrition*
Males
10 20
0 5 15 25
15 5
25 20 10 0
Percent of years of life lost and years lived with disability Percent of years of life lost and years lived with disability
How did the risk factors differ by sex in 2016?
Percent of total DALYs attributable to top 10 risks, ranked by percent for both sexes combined, 2016
Behavioural Environmental/occupational Metabolic
*Malnutrition is child and maternal malnutrition.
†WaSH is unsafe water, sanitation, and handwashing.
What risk factors are driving the most death and disability combined?
Contribution of top 10 risks to DALYs number, both sexes, ranked by number of DALYs, 1990-2016](https://image.slidesharecdn.com/indiahealthofthenationsstatesreport2017-230818115250-fe055a08/85/India_Health_of_the_Nation-s_States_Report_2017-pdf-174-320.jpg)
![171
0
50
100
150
1990 1995 2000 2005 2010 2016
Year
Deaths
per
1,000
live
births
Sikkim under-5 rate India under-5 rate Comparative average rate globally for similar
Socio-demographic Index as Sikkim
39.2
22.5
26.2
How much did the under-5 mortality rate change from 1990 to 2016?
Under-5 mortality rate, both sexes combined, 1990-2016
2016 life expectancy
Females: 75.8 years Males: 70.5 years
1990 life expectancy
Females: 63.5 years Males: 61.9 years
Sikkim
1.3%
38.9%
2.7%
36.9%
1%
1.8%
1.6%
5.7%
1%
4.8%
4.2%
9%
9.7%
7.8%
9.8%
10.9%
3.1%
4.4%
10.5%
8.7%
14.6%
11.5%
5.7%
7.1%
18.9%
25.4%
7.8%
11.5%
3.2%
7.4%
2.6%
4.4%
6%
3.4%
15.9%
9.7%
29.1%
13.6%
3.3%
2.7%
5.4%
9.1%
5.2%
2.6%
0−14 years [11.9% of total deaths] 15−39 years [14.4% of total deaths]
40−69 years [38.1% of total deaths] 70+ years [35.7% of total deaths]
What caused the most deaths in different age groups in 2016?
Percent contribution of top 10 causes of death by age group, both sexes, 2016
HIV/AIDS & tuberculosis
Diarrhoea/LRI*/other
NTDs†
& malaria
Maternal disorders
Neonatal disorders
Nutritional deficiencies
Other communicable diseases
Cancers
Cardiovascular diseases
Chronic respiratory diseases
Cirrhosis
Digestive diseases
Neurological disorders
Diabetes/urog‡
/blood/endo§
Other non-communicable
Transport injuries
Unintentional injuries
Suicide & violence
Other causes of death
*LRI is lower respiratory infections.
†
NTDs are neglected tropical diseases.
‡
Urog is urogenital diseases.
§
Endo is endocrine diseases.
How much did the under-5 mortality rate change from 1990 to 2016?
Under-5 mortality rate, both sexes combined, 1990-2016
What caused the most deaths in different age groups in 2016?
Percent contribution of top 10 causes of death by age group, both sexes, 2016
Sikkim](https://image.slidesharecdn.com/indiahealthofthenationsstatesreport2017-230818115250-fe055a08/85/India_Health_of_the_Nation-s_States_Report_2017-pdf-175-320.jpg)
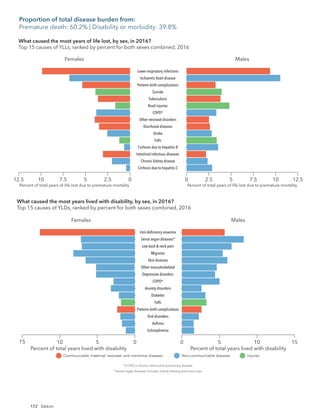
![173
Sikkim
Lower respiratory infections [5.8%]
Ischaemic heart disease [5.8%]
COPD†
[3.7%]
Iron-deficiency anaemia [3.6%]
Preterm birth complications [3.4%]
Sense organ diseases‡
[3.1%]
Low back & neck pain [2.7%]
Road injuries [2.7%]
Migraine [2.7%]
Falls [2.6%]
Skin diseases [2.6%]
Tuberculosis [2.5%]
Self-harm§
[2.4%]*
Diarrhoeal diseases [2.3%]
Diabetes [2.1%]
Other neonatal disorders [1.9%]
Intestinal infectious diseases [1.5%]
Neonatal encephalopathy [1.2%]
Hepatitis [1.0%]
Measles [0.2%]
Diarrhoeal diseases [12.2%]
Lower respiratory infections [11.7%]
Tuberculosis [5.6%]
Preterm birth complications [4.9%]
Other neonatal disorders [4.3%]
Ischaemic heart disease [3.0%]
COPD†
[2.3%]
Neonatal encephalopathy [2.2%]
Iron-deficiency anaemia [2.2%]
Hepatitis [2.0%]
Measles [1.8%]
Intestinal infectious diseases [1.8%]
Falls [1.6%]
Self-harm§
[1.5%]
Sense organ diseases‡
[1.5%]
Low back & neck pain [1.4%]
Skin diseases [1.3%]
Migraine [1.3%]
Road injuries [1.3%]
Diabetes [0.6%]
1
2
3
4
5
6
7
8
9
10
11
12
13
14
15
1
2
3
4
5
6
7
8
9
10
11
12
13
14
15
18
22
25
30
76
36
20
21
17
19
Leading causes of DALYs 1990
How have the leading causes of death and disability combined changed from 1990 to 2016?
Change in top 15 causes of DALYs, both sexes, ranked by number of DALYs, 1990–2016
Leading causes of DALYs 2016
Communicable, maternal,
neonatal, and nutritional diseases
Non-communicable diseases Injuries same or increase decrease
*Change not significant.
The percent figure in brackets next to each cause is
DALYs from that cause out of total DALYs.
†
COPD is chronic obstructive pulmonary disease.
‡
Sense organ diseases includes mainly hearing and vision loss.
§
Self-harm refers to suicide and the nonfatal outcomes of self-harm.
[0.34]
[0.36]
[0.52]
[0.62]
[0.67] [0.76]
[0.89]
[1.03] [1.25]
[1.54] [1.94]
[2.4] [2.99]
[3.58]
[4.1]
[4.85]
[5.5]
The number in the bracket on top of each vertical bar is the ratio of percent DALYs to population for that age group.
The number in parentheses after each age group on the x-axis is the percent of population in that age group.
Communicable, maternal, neonatal, and nutritional diseases
Percent
of
total
DALYs
Age
Non-communicable diseases Injuries
What caused the most death and disability combined across age groups in 2016?
Percent of DALYs by age group, both sexes, 2016
[1.65]
U
n
d
e
r
5
(
1
1
%
)
5
t
o
9
(
9
%
)
1
0
t
o
1
4
(
1
0
%
)
1
5
t
o
1
9
(
1
1
%
)
2
0
t
o
2
4
(
1
0
%
)
2
5
t
o
2
9
(
1
0
%
)
3
0
t
o
3
4
(
9
%
)
3
5
t
o
3
9
(
7
%
)
4
0
t
o
4
4
(
6
%
)
4
5
t
o
4
9
(
5
%
)
5
0
t
o
5
4
(
4
%
)
5
5
t
o
5
9
(
3
%
)
6
0
t
o
6
4
(
2
%
)
6
5
t
o
6
9
(
2
%
)
7
0
t
o
7
4
(
1
%
)
7
5
t
o
7
9
(
1
%
)
8
0
t
o
8
4
(
<
1
%
)
8
5
+
(
<
1
%
)
0
5
10
15
How have the leading causes of death and disability combined changed from 1990 to 2016?
Change in top 15 causes of DALYs, both sexes, ranked by number of DALYs, 1990–2016
What caused the most death and disability combined across age groups in 2016?
Percent of DALYs by age group, both sexes, 2016
Proportion of total disease burden from:
CMNNDs: 30.9% | NCDs: 57.5% | Injuries: 11.6%](https://image.slidesharecdn.com/indiahealthofthenationsstatesreport2017-230818115250-fe055a08/85/India_Health_of_the_Nation-s_States_Report_2017-pdf-177-320.jpg)
![174 Sikkim
What risk factors are driving the most death and disability combined?
Contribution of top 10 risks to DALYs number, both sexes, ranked by number of DALYs, 19
Risk factors 1990 Risk factors 2016
The percent figure in bracket next to each risk is DALYs from that risk out of total DALYs. *Malnutrition is child and maternal malnutrition.
†
WaSH is unsafe water, sanitation, and handwashing.
Risk factors 1990 Risk factors 2016
same or increase decrease
Behavioural Environmental/occupational Metabolic
Malnutrition* [33.9%]
WaSH†
[12.0%]
Air pollution [10.1%]
Tobacco use [5.0%]
High blood pressure [3.9%]
Dietary risks [3.7%]
Occupational risks [2.3%]
Alcohol & drug use [1.9%]
High fasting plasma glucose [1.8%]
High total cholesterol [1.4%]
Malnutrition* [14.1%]
High blood pressure [6.9%]
Air pollution [6.2%]
Dietary risks [5.6%]
Tobacco use [5.6%]
High fasting plasma glucose [4.7%]
Alcohol & drug use [4.2%]
High body-mass index [3.8%]
Occupational risks [3.2%]
High total cholesterol [2.8%]
1
2
3
4
5
6
7
8
9
10
1
2
3
4
5
6
7
8
9
10
High body-mass index [0.8%] WaSH†
[1.8%]
12 12
Risk factors 1990 Risk factors 2016
The percent figure in bracket next to each risk is DALYs from that risk out of total DALYs. *Malnutrition is child and maternal malnutrition.
†
WaSH is unsafe water, sanitation, and handwashing.
What risk factors are driving the most death and disability combined?
Contribution of top 10 risks to DALYs number, both sexes, ranked by number of DALYs, 1990-2016
same or increase decrease
Behavioural Environmental/occupational Metabolic
Malnutrition* [32.2%]
WaSH†
[15.2%]
Air pollution [7.7%]
Tobacco use [3.6%]
Dietary risks [2.3%]
High blood pressure [2.2%]
Occupational risks [1.9%]
Alcohol & drug use [1.6%]
High fasting plasma glucose [1.4%]
Impaired kidney function [0.9%]
Malnutrition* [14.8%]
Air pollution [5.1%]
High blood pressure [5.0%]
Tobacco use [4.9%]
Dietary risks [4.7%]
High fasting plasma glucose [4.0%]
WaSH†
[3.9%]
Alcohol & drug use [3.9%]
Occupational risks [2.6%]
Impaired kidney function [2.0%]
1
2
3
4
5
6
7
8
9
10
1
2
3
4
5
6
7
8
9
10
Females
High total cholesterol
Occupational risks
High body-mass index
Alcohol & drug use
High fasting plasma glucose
Tobacco use
Dietary risks
Air pollution
High blood pressure
Malnutrition*
Males
15
0 5 10
10 5
15 0
Percent of years of life lost and years lived with disability Percent of years of life lost and years lived with disability
How did the risk factors differ by sex in 2016?
Percent of total DALYs attributable to top 10 risks, ranked by percent for both sexes combined, 2016
Behavioural Environmental/occupational Metabolic
*Malnutrition is child and maternal malnutrition.
What risk factors are driving the most death and disability combined?
Contribution of top 10 risks to DALYs number, both sexes, ranked by number of DALYs, 1990-2016](https://image.slidesharecdn.com/indiahealthofthenationsstatesreport2017-230818115250-fe055a08/85/India_Health_of_the_Nation-s_States_Report_2017-pdf-178-320.jpg)
![175
How much did the under-5 mortality rate change from 1990 to 2016?
Under-5 mortality rate, both sexes combined, 1990-2016
0
50
100
150
1990 1995 2000 2005 2010 2016
Year
Deaths
per
1,000
live
births
Tamil Nadu under-5 rate India under-5 rate Comparative average rate globally for similar
Socio-demographic Index as Tamil Nadu
39.2
21.3
23.5
2016 life expectancy
Females: 73.5 years Males: 68.9 years
1990 life expectancy
Females: 61.9 years Males: 59.4 years
Tamil Nadu
27.1%
2.8%
39.7%
1%
1.1%
1.2%
13%
1.7%
7%
1.1%
4.3%
7.1%
6.9%
4.6%
16.6%
2.5%
1.8%
5.7%
13%
8.6%
25%
8.3%
4.6%
6.4%
10.9%
40.4%
6.4%
2.3%
12.2%
3.5%
4.9%
3.4%
4.9%
2.6%
14%
5.3%
39.6%
8.3%
1.4%
4.1%
14.8%
1%
6.5%
2.5%
0−14 years [4.1% of total deaths] 15−39 years [9.7% of total deaths]
40−69 years [43.2% of total deaths] 70+ years [43% of total deaths]
What caused the most deaths in different age groups in 2016?
Percent contribution of top 10 causes of death by age group, both sexes, 2016
HIV/AIDS & tuberculosis
Diarrhoea/LRI*/other
NTDs†
& malaria
Maternal disorders
Neonatal disorders
Nutritional deficiencies
Other communicable diseases
Cancers
Cardiovascular diseases
Chronic respiratory diseases
Cirrhosis
Digestive diseases
Neurological disorders
Diabetes/urog‡
/blood/endo§
Other non-communicable
Transport injuries
Unintentional injuries
Suicide & violence
Other causes of death
*LRI is lower respiratory infections.
†
NTDs are neglected tropical diseases.
‡
Urog is urogenital diseases.
§
Endo is endocrine diseases.
How much did the under-5 mortality rate change from 1990 to 2016?
Under-5 mortality rate, both sexes combined, 1990-2016
What caused the most deaths in different age groups in 2016?
Percent contribution of top 10 causes of death by age group, both sexes, 2016
Tamil Nadu](https://image.slidesharecdn.com/indiahealthofthenationsstatesreport2017-230818115250-fe055a08/85/India_Health_of_the_Nation-s_States_Report_2017-pdf-179-320.jpg)
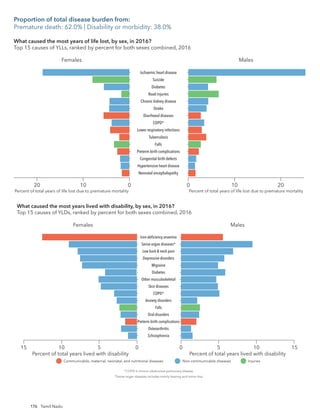
![177
Tamil Nadu
Ischaemic heart disease [14.3%]
Diabetes [4.9%]
Self-harm§
[4.3%]*
COPD†
[3.7%]*
Iron-deficiency anaemia [3.6%]
Sense organ diseases‡
[3.5%]
Road injuries [3.3%]
Chronic kidney disease [3.1%]
Low back & neck pain [2.8%]
Stroke [2.8%]*
Falls [2.7%]*
Diarrhoeal diseases [2.8%]
Depressive disorders [2.5%]
Migraine [2.3%]
Tuberculosis [2.3%]
Preterm birth complications [2.2%]
Lower respiratory infections [2.1%]
Congenital birth defects [1.4%]
Neonatal encephalopathy [1.0%]
Other neonatal disorders [0.5%]
Measles [0.1%]
Diarrhoeal diseases [10.8%]
Lower respiratory infections [6.9%]
Preterm birth complications [6.8%]
Ischaemic heart disease [6.6%]
Tuberculosis [4.9%]
Neonatal encephalopathy [4.6%]
Congenital birth defects [3.7%]
Self-harm§
[3.6%]
Measles [2.6%]
COPD†
[2.5%]
Iron-deficiency anaemia [2.4%]
Stroke [2.2%]
Other neonatal disorders [2.2%]
Road injuries [1.8%]
Chronic kidney disease [1.8%]
Falls [1.7%]
Sense organ diseases‡
[1.6%]
Low back & neck pain [1.4%]
Diabetes [1.4%]
Depressive disorders [1.2%]
Migraine [1.2%]
1
2
3
4
5
6
7
8
9
10
11
12
13
14
15
1
2
3
4
5
6
7
8
9
10
11
12
13
14
15
16
17
20
22
42
100
23
22
18
20
16
17
Leading causes of DALYs 1990
How have the leading causes of death and disability combined changed from 1990 to 2016?
Change in top 15 causes of DALYs, both sexes, ranked by number of DALYs, 1990–2016
Leading causes of DALYs 2016
Communicable, maternal,
neonatal, and nutritional diseases
Non-communicable diseases Injuries same or increase decrease
*Change not significant.
The percent figure in brackets next to each cause is
DALYs from that cause out of total DALYs.
†
COPD is chronic obstructive pulmonary disease.
‡
Sense organ diseases includes mainly hearing and vision loss.
§
Self-harm refers to suicide and the nonfatal outcomes of self-harm.
[1.2]
[0.27]
[0.29]
[0.44]
[0.53]
[0.58]
[0.66]
[0.78]
[0.91]
[1.1]
[1.35]
[1.68]
[2.08]
[2.59]
[3.12]
[3.58]
[4.14]
[4.64]
The number in the bracket on top of each vertical bar is the ratio of percent DALYs to population for that age group.
The number in parentheses after each age group on the x-axis is the percent of population in that age group.
Communicable, maternal, neonatal, and nutritional diseases
Percent
of
total
DALYs
Age
Non-communicable diseases Injuries
What caused the most death and disability combined across age groups in 2016?
Percent of DALYs by age group, both sexes, 2016
U
n
d
e
r
5
(
7
%
)
5
t
o
9
(
7
%
)
1
0
t
o
1
4
(
7
%
)
1
5
t
o
1
9
(
8
%
)
2
0
t
o
2
4
(
8
%
)
2
5
t
o
2
9
(
9
%
)
3
0
t
o
3
4
(
9
%
)
3
5
t
o
3
9
(
8
%
)
4
0
t
o
4
4
(
7
%
)
4
5
t
o
4
9
(
7
%
)
5
0
t
o
5
4
(
6
%
)
5
5
t
o
5
9
(
5
%
)
6
0
t
o
6
4
(
4
%
)
6
5
t
o
6
9
(
3
%
)
7
0
t
o
7
4
(
2
%
)
7
5
t
o
7
9
(
1
%
)
8
0
t
o
8
4
(
1
%
)
8
5
+
(
<
1
%
)
0
2.5
5.0
7.5
10.0
How have the leading causes of death and disability combined changed from 1990 to 2016?
Change in top 15 causes of DALYs, both sexes, ranked by number of DALYs, 1990–2016
What caused the most death and disability combined across age groups in 2016?
Percent of DALYs by age group, both sexes, 2016
Proportion of total disease burden from:
CMNNDs: 20.4% | NCDs: 65.3% | Injuries: 14.3%](https://image.slidesharecdn.com/indiahealthofthenationsstatesreport2017-230818115250-fe055a08/85/India_Health_of_the_Nation-s_States_Report_2017-pdf-181-320.jpg)
![178 Tamil Nadu
Risk factors 1990 Risk factors 2016
The percent figure in bracket next to each risk is DALYs from that risk out of total DALYs. *Malnutrition is child and maternal malnutrition.
†
WaSH is unsafe water, sanitation, and handwashing.
What risk factors are driving the most death and disability combined?
Contribution of top 10 risks to DALYs number, both sexes, ranked by number of DALYs, 19
same or increase decrease
Behavioural Environmental/occupational Metabolic
Malnutrition* [31.0%]
WaSH†
[10.9%]
Air pollution [9.6%]
Dietary risks [7.7%]
High blood pressure [5.9%]
Tobacco use [4.9%]
High fasting plasma glucose [4.9%]
High total cholesterol [3.2%]
Impaired kidney function [2.6%]
Occupational risks [2.0%]
Dietary risks [14.4%]
High fasting plasma glucose [12.9%]
High blood pressure [12.3%]
High body-mass index [8.1%]
Malnutrition* [8.0%]
Air pollution [7.2%]
High total cholesterol [7.2%]
Tobacco use [5.6%]
Impaired kidney function [4.7%]
Alcohol & drug use [3.8%]
1
2
3
4
5
6
7
8
9
10
1
2
3
4
5
6
7
8
9
10
Alcohol & drug use [1.8%] Occupational risks [3.2%]
11 11
High body-mass index [1.5%] WaSH
†
[2.6%]
12 12
Risk factors 1990 Risk factors 2016
The percent figure in bracket next to each risk is DALYs from that risk out of total DALYs. *Malnutrition is child and maternal malnutrition.
†
WaSH is unsafe water, sanitation, and handwashing.
What risk factors are driving the most death and disability combined?
Contribution of top 10 risks to DALYs number, both sexes, ranked by number of DALYs, 1990-2016
same or increase decrease
Behavioural Environmental/occupational Metabolic
Malnutrition* [32.2%]
WaSH†
[15.2%]
Air pollution [7.7%]
Tobacco use [3.6%]
Dietary risks [2.3%]
High blood pressure [2.2%]
Occupational risks [1.9%]
Alcohol & drug use [1.6%]
High fasting plasma glucose [1.4%]
Impaired kidney function [0.9%]
Malnutrition* [14.8%]
Air pollution [5.1%]
High blood pressure [5.0%]
Tobacco use [4.9%]
Dietary risks [4.7%]
High fasting plasma glucose [4.0%]
WaSH†
[3.9%]
Alcohol & drug use [3.9%]
Occupational risks [2.6%]
Impaired kidney function [2.0%]
1
2
3
4
5
6
7
8
9
10
1
2
3
4
5
6
7
8
9
10
Females
Alcohol & drug use
Impaired kidney function
Tobacco use
High total cholesterol
Air pollution
Malnutrition*
High body-mass index
High blood pressure
High fasting plasma glucose
Dietary risks
Males
15
0 5 10
10 5
15 0
Percent of years of life lost and years lived with disability Percent of years of life lost and years lived with disability
How did the risk factors differ by sex in 2016?
Percent of total DALYs attributable to top 10 risks, ranked by percent for both sexes combined, 2016
Behavioural Environmental/occupational Metabolic
*Malnutrition is child and maternal malnutrition.
What risk factors are driving the most death and disability combined?
Contribution of top 10 risks to DALYs number, both sexes, ranked by number of DALYs, 1990-2016](https://image.slidesharecdn.com/indiahealthofthenationsstatesreport2017-230818115250-fe055a08/85/India_Health_of_the_Nation-s_States_Report_2017-pdf-182-320.jpg)
![179
0
50
100
150
1990 1995 2000 2005 2010 2016
Year
Deaths
per
1,000
live
births
Telangana under-5 rate India under-5 rate Comparative average rate globally for similar
Socio-demographic Index as Telangana
39.2
30.6
29.3
How much did the under-5 mortality rate change from 1990 to 2016?
Under-5 mortality rate, both sexes combined, 1990-2016
2016 life expectancy
Females: 73.2 years Males: 69.4 years
1990 life expectancy
Females: 61.8 years Males: 60.2 years
Telangana
2.4%
30.5%
2.4%
42.5%
1.2%
1.6%
1%
8.7%
1.2%
5.1%
3.4%
13%
8.9%
2.5%
5.9%
13.5%
2.8%
3.3%
10.4%
9.1%
20.5%
10%
5.5%
8.5%
12.2%
38.1%
10%
2.9%
6.5%
2.8%
4.8%
3%
5.8%
2.3%
19%
6.6%
35.3%
14.3%
1%
1.5%
4.6%
7.3%
5.2%
2.9%
0−14 years [7.6% of total deaths] 15−39 years [11.4% of total deaths]
40−69 years [43.1% of total deaths] 70+ years [37.9% of total deaths]
What caused the most deaths in different age groups in 2016?
Percent contribution of top 10 causes of death by age group, both sexes, 2016
HIV/AIDS & tuberculosis
Diarrhoea/LRI*/other
NTDs†
& malaria
Maternal disorders
Neonatal disorders
Nutritional deficiencies
Other communicable diseases
Cancers
Cardiovascular diseases
Chronic respiratory diseases
Cirrhosis
Digestive diseases
Neurological disorders
Diabetes/urog‡
/blood/endo§
Other non-communicable
Transport injuries
Unintentional injuries
Suicide & violence
Other causes of death
*LRI is lower respiratory infections.
†
NTDs are neglected tropical diseases.
‡
Urog is urogenital diseases.
§
Endo is endocrine diseases.
How much did the under-5 mortality rate change from 1990 to 2016?
Under-5 mortality rate, both sexes combined, 1990-2016
What caused the most deaths in different age groups in 2016?
Percent contribution of top 10 causes of death by age group, both sexes, 2016
Telangana](https://image.slidesharecdn.com/indiahealthofthenationsstatesreport2017-230818115250-fe055a08/85/India_Health_of_the_Nation-s_States_Report_2017-pdf-183-320.jpg)
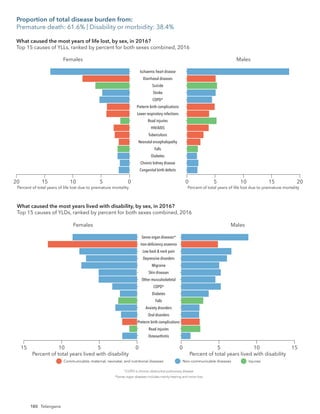
![181
Telangana
Ischaemic heart disease [10.3%]
COPD†
[4.6%]
Diarrhoeal diseases [4.4%]
Preterm birth complications [3.6%]
Self-harm§
[3.5%]*
Sense organ diseases‡
[3.4%]
Iron-deficiency anaemia [3.3%]
Stroke [3.3%]*
Road injuries [2.9%]
Low back & neck pain [2.8%]
Depressive disorders [2.5%]
Lower respiratory infections [2.5%]
Migraine [2.4%]
Diabetes [2.3%]
Falls [2.3%]
Tuberculosis [1.9%]
Congenital birth defects [1.5%]
Neonatal encephalopathy [1.4%]
Other neonatal disorders [0.9%]
Neonatal haemolytic disease [0.4%]
Measles [0.2%]
Diarrhoeal diseases [13.2%]
Lower respiratory infections [7.5%]
Preterm birth complications [7.2%]
Ischaemic heart disease [4.9%]
Measles [4.4%]
Neonatal encephalopathy [3.7%]
Tuberculosis [3.2%]
COPD†
[2.8%]
Self-harm§
[2.6%]
Iron-deficiency anaemia [2.2%]
Other neonatal disorders [2.2%]
Stroke [2.2%]
Congenital birth defects [2.1%]
Neonatal haemolytic disease [1.6%]
Sense organ diseases‡
[1.5%]
Road injuries [1.5%]
Low back & neck pain [1.4%]
Falls [1.3%]
Migraine [1.2%]
Depressive disorders [1.2%]
Diabetes [0.8%]
1
2
3
4
5
6
7
8
9
10
11
12
13
14
15
1
2
3
4
5
6
7
8
9
10
11
12
13
14
15
19
21
22
26
52
75
36
23
19
22
17
18
Leading causes of DALYs 1990
How have the leading causes of death and disability combined changed from 1990 to 2016?
Change in top 15 causes of DALYs, both sexes, ranked by number of DALYs, 1990–2016
Leading causes of DALYs 2016
Communicable, maternal,
neonatal, and nutritional diseases
Non-communicable diseases Injuries same or increase decrease
*Change not significant.
The percent figure in brackets next to each cause is
DALYs from that cause out of total DALYs.
†
COPD is chronic obstructive pulmonary disease.
‡
Sense organ diseases includes mainly hearing and vision loss.
§
Self-harm refers to suicide and the nonfatal outcomes of self-harm.
[1.69]
[0.31]
[0.32]
[0.46]
[0.55]
[0.61] [0.69]
[0.8] [0.92]
[1.1]
[1.35] [1.66]
[2.07]
[2.6]
[3.12]
[3.57]
[4.14]
[4.7]
The number in the bracket on top of each vertical bar is the ratio of percent DALYs to population for that age group.
The number in parentheses after each age group on the x-axis is the percent of population in that age group.
Communicable, maternal, neonatal, and nutritional diseases
Percent
of
total
DALYs
Age
Non-communicable diseases Injuries
What caused the most death and disability combined across age groups in 2016?
Percent of DALYs by age group, both sexes, 2016
U
n
d
e
r
5
(
7
%
)
5
t
o
9
(
8
%
)
1
0
t
o
1
4
(
8
%
)
1
5
t
o
1
9
(
9
%
)
2
0
t
o
2
4
(
9
%
)
2
5
t
o
2
9
(
9
%
)
3
0
t
o
3
4
(
9
%
)
3
5
t
o
3
9
(
8
%
)
4
0
t
o
4
4
(
7
%
)
4
5
t
o
4
9
(
6
%
)
5
0
t
o
5
4
(
5
%
)
5
5
t
o
5
9
(
4
%
)
6
0
t
o
6
4
(
4
%
)
6
5
t
o
6
9
(
3
%
)
7
0
t
o
7
4
(
2
%
)
7
5
t
o
7
9
(
1
%
)
8
0
t
o
8
4
(
1
%
)
8
5
+
(
<
1
%
)
0
5
10
How have the leading causes of death and disability combined changed from 1990 to 2016?
Change in top 15 causes of DALYs, both sexes, ranked by number of DALYs, 1990–2016
What caused the most death and disability combined across age groups in 2016?
Percent of DALYs by age group, both sexes, 2016
Proportion of total disease burden from:
CMNNDs: 27.6% | NCDs: 59.2% | Injuries: 13.2%](https://image.slidesharecdn.com/indiahealthofthenationsstatesreport2017-230818115250-fe055a08/85/India_Health_of_the_Nation-s_States_Report_2017-pdf-185-320.jpg)
![182 Telangana
What risk factors are driving the most death and disability combined?
Contribution of top 10 risks to DALYs number, both sexes, ranked by number of DALYs, 19
Risk factors 1990 Risk factors 2016
The percent figure in bracket next to each risk is DALYs from that risk out of total DALYs. *Malnutrition is child and maternal malnutrition.
†
WaSH is unsafe water, sanitation, and handwashing.
same or increase decrease
Behavioural Environmental/occupational Metabolic
Malnutrition* [35.1%]
WaSH†
[13.5%]
Air pollution [10.1%]
Dietary risks [5.7%]
High blood pressure [4.2%]
Tobacco use [4.0%]
High fasting plasma glucose [2.4%]
Occupational risks [2.3%]
High total cholesterol [2.3%]
High body-mass index [1.8%]
Malnutrition* [11.4%]
Dietary risks [9.9%]
High blood pressure [8.7%]
Air pollution [8.6%]
High fasting plasma glucose [5.9%]
High total cholesterol [5.1%]
Tobacco use [5.0%]
High body-mass index [4.6%]
WaSH†
[4.2%]
Occupational risks [3.4%]
1
2
3
4
5
6
7
8
9
10
1
2
3
4
5
6
7
8
9
10
Risk factors 1990 Risk factors 2016
The percent figure in bracket next to each risk is DALYs from that risk out of total DALYs. *Malnutrition is child and maternal malnutrition.
†
WaSH is unsafe water, sanitation, and handwashing.
What risk factors are driving the most death and disability combined?
Contribution of top 10 risks to DALYs number, both sexes, ranked by number of DALYs, 1990-2016
same or increase decrease
Behavioural Environmental/occupational Metabolic
Malnutrition* [32.2%]
WaSH†
[15.2%]
Air pollution [7.7%]
Tobacco use [3.6%]
Dietary risks [2.3%]
High blood pressure [2.2%]
Occupational risks [1.9%]
Alcohol & drug use [1.6%]
High fasting plasma glucose [1.4%]
Impaired kidney function [0.9%]
Malnutrition* [14.8%]
Air pollution [5.1%]
High blood pressure [5.0%]
Tobacco use [4.9%]
Dietary risks [4.7%]
High fasting plasma glucose [4.0%]
WaSH†
[3.9%]
Alcohol & drug use [3.9%]
Occupational risks [2.6%]
Impaired kidney function [2.0%]
1
2
3
4
5
6
7
8
9
10
1
2
3
4
5
6
7
8
9
10
Females
Occupational risks
WaSH†
High body-mass index
Tobacco use
High total cholesterol
High fasting plasma glucose
Air pollution
High blood pressure
Dietary risks
Malnutrition*
Males
10
0 5
5
10 0
Percent of years of life lost and years lived with disability Percent of years of life lost and years lived with disability
How did the risk factors differ by sex in 2016?
Percent of total DALYs attributable to top 10 risks, ranked by percent for both sexes combined, 2016
Behavioural Environmental/occupational Metabolic
*Malnutrition is child and maternal malnutrition.
†
WaSH is unsafe water, sanitation, and handwashing.
What risk factors are driving the most death and disability combined?
Contribution of top 10 risks to DALYs number, both sexes, ranked by number of DALYs, 1990-2016](https://image.slidesharecdn.com/indiahealthofthenationsstatesreport2017-230818115250-fe055a08/85/India_Health_of_the_Nation-s_States_Report_2017-pdf-186-320.jpg)
![183
How much did the under-5 mortality rate change from 1990 to 2016?
Under-5 mortality rate, both sexes combined, 1990-2016
0
50
100
150
1990 1995 2000 2005 2010 2016
Year
Deaths
per
1,000
live
births
Tripura under-5 rate India under-5 rate Comparative average rate globally for similar
Socio-demographic Index as Tripura
39.2
40.4
35.1
2016 life expectancy
Females: 71.5 years Males: 66.3 years
1990 life expectancy
Females: 61.6years Males: 58.9 years
Tripura
1.1%
33.2%
6.7%
38.4%
1.5%
1.9%
0.9%
6.1%
0.9%
4.9%
4.2%
6.7%
8.7%
3.6%
4.4%
14%
4.6%
4.2% 8.7%
7%
25.2%
13%
3.7%
8.4%
12.5%
36.6%
11.2%
4.6%
3.9%
7%
2.5%
3.7%
6%
1.6%
20.1%
5.2%
37%
16.7%
1.2%
2.7%
4%
7.1%
2%
2.4%
0−14 years [10.1% of total deaths] 15−39 years [11.7% of total deaths]
40−69 years [35.8% of total deaths] 70+ years [42.4% of total deaths]
HIV/AIDS & tuberculosis
Diarrhoea/LRI*/other
NTDs†
& malaria
Maternal disorders
Neonatal disorders
Nutritional deficiencies
Other communicable diseases
Cancers
Cardiovascular diseases
Chronic respiratory diseases
Cirrhosis
Digestive diseases
Neurological disorders
Diabetes/urog‡
/blood/endo§
Other non-communicable
Transport injuries
Unintentional injuries
Suicide & violence
Other causes of death
*LRI is lower respiratory infections.
†
NTDs are neglected tropical diseases.
‡
Urog is urogenital diseases.
§
Endo is endocrine diseases.
What caused the most deaths in different age groups in 2016?
Percent contribution of top 10 causes of death by age group, both sexes, 2016
How much did the under-5 mortality rate change from 1990 to 2016?
Under-5 mortality rate, both sexes combined, 1990-2016
What caused the most deaths in different age groups in 2016?
Percent contribution of top 10 causes of death by age group, both sexes, 2016
Tripura](https://image.slidesharecdn.com/indiahealthofthenationsstatesreport2017-230818115250-fe055a08/85/India_Health_of_the_Nation-s_States_Report_2017-pdf-187-320.jpg)
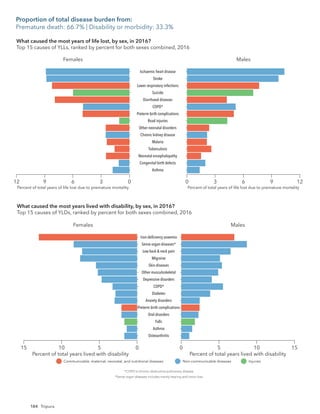
![185
Tripura
Ischaemic heart disease [6.7%]
Stroke [6.5%]
Lower respiratory infections [5.3%]
COPD†
[4.8%]
Self-harm§
[4.5%]
Diarrhoeal diseases [4.2%]
Preterm birth complications [4.1%]
Iron-deficiency anaemia [3.4%]
Sense organ diseases‡
[2.9%]
Road injuries [2.4%]
Low back & neck pain [2.3%]
Migraine [2.1%]
Diabetes [2.1%]
Skin diseases [1.9%]
Chronic kidney disease [1.9%]
Other neonatal disorders [1.7%]
Tuberculosis [1.6%]
Malaria [1.5%]*
Asthma [1.5%]*
Neonatal encephalopathy [1.3%]
Neonatal sepsis [1.0%]*
Measles [0.3%]
Lower respiratory infections [11.2%]
Diarrhoeal diseases [10.7%]
Preterm birth complications [7.0%]
COPD†
[3.8%]
Stroke [3.5%]
Ischaemic heart disease [3.3%]
Other neonatal disorders [3.2%]
Measles [2.9%]
Self-harm§
[2.8%]
Neonatal encephalopathy [2.8%]
Tuberculosis [2.7%]
Malaria [2.5%]
Iron-deficiency anaemia [2.2%]
Asthma [1.7%]
Neonatal sepsis [1.7%]
Sense organ diseases‡
[1.5%]
Low back & neck pain [1.3%]
Road injuries [1.3%]
Skin diseases [1.2%]
Migraine [1.2%]
Chronic kidney disease [0.9%]
Diabetes [0.7%]
1
2
3
4
5
6
7
8
9
10
11
12
13
14
15
1
2
3
4
5
6
7
8
9
10
11
12
13
14
15
17
18
19
20
23
25
28
66
33
23
21
22
18
20
Leading causes of DALYs 1990
How have the leading causes of death and disability combined changed from 1990 to 2016?
Change in top 15 causes of DALYs, both sexes, ranked by number of DALYs, 1990–2016
Leading causes of DALYs 2016
Communicable, maternal,
neonatal, and nutritional diseases
Non-communicable diseases Injuries same or increase decrease
*Change not significant.
The percent figure in brackets next to each cause is
DALYs from that cause out of total DALYs.
†
COPD is chronic obstructive pulmonary disease.
‡
Sense organ diseases includes mainly hearing and vision loss.
§
Self-harm refers to suicide and the nonfatal outcomes of self-harm.
[2.15]
[0.33] [0.32]
[0.45]
[0.54]
[0.59] [0.67]
[0.78] [0.9]
[1.1]
[1.37] [1.71]
[2.1]
[2.63]
[3.16]
[3.59]
[4.11]
[4.56]
The number in the bracket on top of each vertical bar is the ratio of percent DALYs to population for that age group.
The number in parentheses after each age group on the x-axis is the percent of population in that age group.
Communicable, maternal, neonatal, and nutritional diseases
Percent
of
total
DALYs
Age
Non-communicable diseases Injuries
What caused the most death and disability combined across age groups in 2016?
Percent of DALYs by age group, both sexes, 2016
U
n
d
e
r
5
(
8
%
)
5
t
o
9
(
9
%
)
1
0
t
o
1
4
(
9
%
)
1
5
t
o
1
9
(
9
%
)
2
0
t
o
2
4
(
1
0
%
)
2
5
t
o
2
9
(
9
%
)
3
0
t
o
3
4
(
9
%
)
3
5
t
o
3
9
(
8
%
)
4
0
t
o
4
4
(
6
%
)
4
5
t
o
4
9
(
6
%
)
5
0
t
o
5
4
(
5
%
)
5
5
t
o
5
9
(
4
%
)
6
0
t
o
6
4
(
3
%
)
6
5
t
o
6
9
(
2
%
)
7
0
t
o
7
4
(
1
%
)
7
5
t
o
7
9
(
1
%
)
8
0
t
o
8
4
(
1
%
)
8
5
+
(
<
1
%
)
0
5
10
15
How have the leading causes of death and disability combined changed from 1990 to 2016?
Change in top 15 causes of DALYs, both sexes, ranked by number of DALYs, 1990–2016
What caused the most death and disability combined across age groups in 2016?
Percent of DALYs by age group, both sexes, 2016
Proportion of total disease burden from:
CMNNDs: 31.1% | NCDs: 57.0% | Injuries: 12.0%](https://image.slidesharecdn.com/indiahealthofthenationsstatesreport2017-230818115250-fe055a08/85/India_Health_of_the_Nation-s_States_Report_2017-pdf-189-320.jpg)
![186 Tripura
What risk factors are driving the most death and disability combined?
Contribution of top 10 risks to DALYs number, both sexes, ranked by number of DALYs, 19
Risk factors 1990 Risk factors 2016
The percent figure in bracket next to each risk is DALYs from that risk out of total DALYs. *Malnutrition is child and maternal malnutrition.
†
WaSH is unsafe water, sanitation, and handwashing.
Risk factors 1990 Risk factors 2016
same or increase decrease
Behavioural Environmental/occupational Metabolic
Malnutrition* [33.9%]
Air pollution [12.3%]
WaSH†
[11.3%]
Tobacco use [5.7%]
Dietary risks [5.1%]
High blood pressure [4.8%]
High fasting plasma glucose [2.4%]
Occupational risks [2.2%]
Alcohol & drug use [1.6%]
Impaired kidney function [1.5%]
Malnutrition* [14.8%]
Air pollution [10.4%]
High blood pressure [9.7%]
Dietary risks [8.8%]
Tobacco use [7.9%]
High fasting plasma glucose [6.6%]
WaSH†
[4.3%]
Alcohol & drug use [3.6%]
High total cholesterol [3.3%]
Occupational risks [3.1%]
1
2
3
4
5
6
7
8
9
10
1
2
3
4
5
6
7
8
9
10
High total cholesterol [1.5%] Impaired kidney function [3.1%]
11 11
Risk factors 1990 Risk factors 2016
The percent figure in bracket next to each risk is DALYs from that risk out of total DALYs. *Malnutrition is child and maternal malnutrition.
†
WaSH is unsafe water, sanitation, and handwashing.
What risk factors are driving the most death and disability combined?
Contribution of top 10 risks to DALYs number, both sexes, ranked by number of DALYs, 1990-2016
same or increase decrease
Behavioural Environmental/occupational Metabolic
Malnutrition* [32.2%]
WaSH†
[15.2%]
Air pollution [7.7%]
Tobacco use [3.6%]
Dietary risks [2.3%]
High blood pressure [2.2%]
Occupational risks [1.9%]
Alcohol & drug use [1.6%]
High fasting plasma glucose [1.4%]
Impaired kidney function [0.9%]
Malnutrition* [14.8%]
Air pollution [5.1%]
High blood pressure [5.0%]
Tobacco use [4.9%]
Dietary risks [4.7%]
High fasting plasma glucose [4.0%]
WaSH†
[3.9%]
Alcohol & drug use [3.9%]
Occupational risks [2.6%]
Impaired kidney function [2.0%]
1
2
3
4
5
6
7
8
9
10
1
2
3
4
5
6
7
8
9
10
Females
Occupational risks
High total cholesterol
Alcohol & drug use
WaSH†
High fasting plasma glucose
Tobacco use
Dietary risks
High blood pressure
Air pollution
Malnutrition*
Males
5
15 10 0 10
0 5 15
Percent of years of life lost and years lived with disability Percent of years of life lost and years lived with disability
How did the risk factors differ by sex in 2016?
Percent of total DALYs attributable to top 10 risks, ranked by percent for both sexes combined, 2016
Behavioural Environmental/occupational Metabolic
*Malnutrition is child and maternal malnutrition.
†
WaSH is unsafe water, sanitation, and handwashing.
What risk factors are driving the most death and disability combined?
Contribution of top 10 risks to DALYs number, both sexes, ranked by number of DALYs, 1990-2016](https://image.slidesharecdn.com/indiahealthofthenationsstatesreport2017-230818115250-fe055a08/85/India_Health_of_the_Nation-s_States_Report_2017-pdf-190-320.jpg)
![187
0
50
100
150
1990 1995 2000 2005 2010 2016
Year
Deaths
per
1,000
live
births
Uttar Pradesh under-5 rate India under-5 rate Comparative average rate globally for similar
Socio-demographic Index as Uttar Pradesh
39.2
48.3
48.7
How much did the under-5 mortality rate change from 1990 to 2016?
Under-5 mortality rate, both sexes combined, 1990-2016
2016 life expectancy
Females: 66.8 years Males: 64.6 years
1990 life expectancy
Females: 53.5 years Males: 54.9 years
Uttar Pradesh
1%
40.1%
3%
33.7%
3%
1.5%
0.8%
7.4%
1.2%
5%
3.3%
13.5%
12.5%
4.9%
6.4%
9%
3.3% 3.5%
12.4%
9.6%
13.6%
11.4%
10.3%
10.5%
12.7%
23.7%
18.8%
2.2%
3.5%
5.6%
3.2%
4.5%
5.1% 5.1%
24.5%
6.2%
24%
21.1%
2.3%
3.5%
6.2%
0.7%
4.1%
2.3%
0−14 years [14.1% of total deaths] 15−39 years [11.9% of total deaths]
40−69 years [38.1% of total deaths] 70+ years [35.9% of total deaths]
What caused the most deaths in different age groups in 2016?
Percent contribution of top 10 causes of death by age group, both sexes, 2016
HIV/AIDS & tuberculosis
Diarrhoea/LRI*/other
NTDs†
& malaria
Maternal disorders
Neonatal disorders
Nutritional deficiencies
Other communicable diseases
Cancers
Cardiovascular diseases
Chronic respiratory diseases
Cirrhosis
Digestive diseases
Neurological disorders
Diabetes/urog‡
/blood/endo§
Other non-communicable
Transport injuries
Unintentional injuries
Suicide & violence
Other causes of death
*LRI is lower respiratory infections.
†
NTDs are neglected tropical diseases.
‡
Urog is urogenital diseases.
§
Endo is endocrine diseases.
How much did the under-5 mortality rate change from 1990 to 2016?
Under-5 mortality rate, both sexes combined, 1990-2016
What caused the most deaths in different age groups in 2016?
Percent contribution of top 10 causes of death by age group, both sexes, 2016
Uttar Pradesh](https://image.slidesharecdn.com/indiahealthofthenationsstatesreport2017-230818115250-fe055a08/85/India_Health_of_the_Nation-s_States_Report_2017-pdf-191-320.jpg)
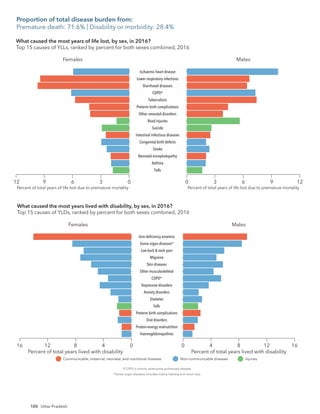
![189
Uttar Pradesh
COPD†
[6.1%]
Diarrhoeal diseases [6.0%]
Ischaemic heart disease [5.8%]
Lower respiratory infections [5.7%]
Tuberculosis [5.0%]
Preterm birth complications [3.7%]*
Iron-deficiency anaemia [3.3%]
Road injuries [3.0%]
Other neonatal disorders [2.9%]*
Sense organ diseases‡
[2.4%]
Congenital birth defects [2.1%]*
Self-harm§
[2.0%]
Stroke [1.9%]
Falls [1.8%]
Intestinal infectious diseases [1.8%]
Asthma [1.7%]*
Neonatal encephalopathy [1.5%]
Protein-energy malnutrition [1.1%]
Measles [0.7%]
Tetanus [0.3%]
Diarrhoeal diseases [15.7%]
Lower respiratory infections [11.2%]
Tuberculosis [5.5%]
Tetanus [4.6%]
Measles [4.5%]
Preterm birth complications [3.7%]
Other neonatal disorders [3.6%]
COPD†
[3.6%]
Neonatal encephalopathy [2.5%]
Intestinal infectious diseases [2.3%]
Ischaemic heart disease [2.2%]
Iron-deficiency anaemia [1.8%]
Protein-energy malnutrition [1.7%]
Asthma [1.6%]
Congenital birth defects [1.5%]
Road injuries [1.5%]
Sense organ diseases‡
[1.1%]
Self-harm§
[1.1%]
Falls [1.0%]
Stroke [1.0%]
1
2
3
4
5
6
7
8
9
10
11
12
13
14
15
1
2
3
4
5
6
7
8
9
10
11
12
13
14
15
19
21
24
33
68
22
19
21
16
18
Leading causes of DALYs 1990
How have the leading causes of death and disability combined changed from 1990 to 2016?
Change in top 15 causes of DALYs, both sexes, ranked by number of DALYs, 1990–2016
Leading causes of DALYs 2016
Communicable, maternal,
neonatal, and nutritional diseases
Non-communicable diseases Injuries same or increase decrease
*Change not significant.
The percent figure in brackets next to each cause is
DALYs from that cause out of total DALYs.
†
COPD is chronic obstructive pulmonary disease.
‡
Sense organ diseases includes mainly hearing and vision loss.
§
Self-harm refers to suicide and the nonfatal outcomes of self-harm.
[2.26]
[0.32] [0.31]
[0.46] [0.56] [0.6] [0.67] [0.79] [0.92] [1.12]
[1.41]
[1.74]
[2.17]
[2.71]
[3.28]
[3.71]
[4.15]
[4.44]
The number in the bracket on top of each vertical bar is the ratio of percent DALYs to population for that age group.
The number in parentheses after each age group on the x-axis is the percent of population in that age group.
Communicable, maternal, neonatal, and nutritional diseases
Percent
of
total
DALYs
Age
Non-communicable diseases Injuries
What caused the most death and disability combined across age groups in 2016?
Percent of DALYs by age group, both sexes, 2016
U
n
d
e
r
5
(
1
0
%
)
5
t
o
9
(
1
1
%
)
1
0
t
o
1
4
(
1
1
%
)
1
5
t
o
1
9
(
1
1
%
)
2
0
t
o
2
4
(
9
%
)
2
5
t
o
2
9
(
8
%
)
3
0
t
o
3
4
(
7
%
)
3
5
t
o
3
9
(
6
%
)
4
0
t
o
4
4
(
5
%
)
4
5
t
o
4
9
(
5
%
)
5
0
t
o
5
4
(
4
%
)
5
5
t
o
5
9
(
3
%
)
6
0
t
o
6
4
(
3
%
)
6
5
t
o
6
9
(
2
%
)
7
0
t
o
7
4
(
1
%
)
7
5
t
o
7
9
(
1
%
)
8
0
t
o
8
4
(
1
%
)
8
5
+
(
<
1
%
)
0
5
10
15
20
25
How have the leading causes of death and disability combined changed from 1990 to 2016?
Change in top 15 causes of DALYs, both sexes, ranked by number of DALYs, 1990–2016
What caused the most death and disability combined across age groups in 2016?
Percent of DALYs by age group, both sexes, 2016
Proportion of total disease burden from:
CMNNDs: 40.5% | NCDs: 47.9% | Injuries: 11.6%](https://image.slidesharecdn.com/indiahealthofthenationsstatesreport2017-230818115250-fe055a08/85/India_Health_of_the_Nation-s_States_Report_2017-pdf-193-320.jpg)
![190 Uttar Pradesh
What risk factors are driving the most death and disability combined?
Contribution of top 10 risks to DALYs number, both sexes, ranked by number of DALYs, 19
Risk factors 1990 Risk factors 2016
The percent figure in bracket next to each risk is DALYs from that risk out of total DALYs. *Malnutrition is child and maternal malnutrition.
†
WaSH is unsafe water, sanitation, and handwashing.
Risk factors 1990 Risk factors 2016
same or increase decrease
Behavioural Environmental/occupational Metabolic
Malnutrition* [38.0%]
WaSH†
[16.2%]
Air pollution [12.2%]
Tobacco use [4.1%]
Dietary risks [2.8%]
High blood pressure [2.1%]
Occupational risks [1.8%]
Alcohol & drug use [1.5%]
High fasting plasma glucose [1.4%]
High total cholesterol [0.9%]
Malnutrition* [18.2%]
Air pollution [11.1%]
Tobacco use [6.2%]
WaSH†
[6.1%]
Dietary risks [5.7%]
High blood pressure [5.1%]
High fasting plasma glucose [4.1%]
Alcohol & drug use [3.3%]
Occupational risks [2.9%]
High body-mass index [2.5%]
1
2
3
4
5
6
7
8
9
10
1
2
3
4
5
6
7
8
9
10
High body-mass index [0.7%] High total cholesterol [2.4%]
12 11
Risk factors 1990 Risk factors 2016
The percent figure in bracket next to each risk is DALYs from that risk out of total DALYs. *Malnutrition is child and maternal malnutrition.
†
WaSH is unsafe water, sanitation, and handwashing.
What risk factors are driving the most death and disability combined?
Contribution of top 10 risks to DALYs number, both sexes, ranked by number of DALYs, 1990-2016
same or increase decrease
Behavioural Environmental/occupational Metabolic
Malnutrition* [32.2%]
WaSH†
[15.2%]
Air pollution [7.7%]
Tobacco use [3.6%]
Dietary risks [2.3%]
High blood pressure [2.2%]
Occupational risks [1.9%]
Alcohol & drug use [1.6%]
High fasting plasma glucose [1.4%]
Impaired kidney function [0.9%]
Malnutrition* [14.8%]
Air pollution [5.1%]
High blood pressure [5.0%]
Tobacco use [4.9%]
Dietary risks [4.7%]
High fasting plasma glucose [4.0%]
WaSH†
[3.9%]
Alcohol & drug use [3.9%]
Occupational risks [2.6%]
Impaired kidney function [2.0%]
1
2
3
4
5
6
7
8
9
10
1
2
3
4
5
6
7
8
9
10
Females
High body-mass index
Occupational risks
Alcohol & drug use
High fasting plasma glucose
High blood pressure
Dietary risks
WaSH†
Tobacco use
Air pollution
Malnutrition*
Males
5
15
20 10 0 15
5
0 10 20
Percent of years of life lost and years lived with disability Percent of years of life lost and years lived with disability
How did the risk factors differ by sex in 2016?
Percent of total DALYs attributable to top 10 risks, ranked by percent for both sexes combined, 2016
Behavioural Environmental/occupational Metabolic
*Malnutrition is child and maternal malnutrition.
†
WaSH is unsafe water, sanitation, and handwashing.
What risk factors are driving the most death and disability combined?
Contribution of top 10 risks to DALYs number, both sexes, ranked by number of DALYs, 1990-2016](https://image.slidesharecdn.com/indiahealthofthenationsstatesreport2017-230818115250-fe055a08/85/India_Health_of_the_Nation-s_States_Report_2017-pdf-194-320.jpg)
![191
0
50
100
150
1990 1995 2000 2005 2010 2016
Year
Deaths
per
1,000
live
births
Uttarakhand under-5 rate India under-5 rate Comparative average rate globally for similar
Socio-demographic Index as Uttarakhand
39.2
46.2
24.9
How much did the under-5 mortality rate change from 1990 to 2016?
Under-5 mortality rate, both sexes combined, 1990-2016
2016 life expectancy
Females: 71.1 years Males: 65.3 years
1990 life expectancy
Females: 60.5 years Males: 57.8 years
Uttarakhand
1.2%
38.9%
2.9%
32.2%
2.3%
2%
1.1%
6.7%
2.3%
6.2%
4.3%
12.4%
10%
6.7%
10.4%
2.6%
2.6%
4%
17.7%
9.5%
12.6%
11.6%
8.1%
7.1%
14%
28.2%
16.6%
2.5%
2.8%
6.8%
4.2%
4.3%
5.4% 3.8%
15.9%
7.3%
27%
23.1%
2.2%
4.6%
8%
1.1%
4.6%
2.4%
0−14 years [10.3% of total deaths] 15−39 years [10.9% of total deaths]
40−69 years [38.7% of total deaths] 70+ years [40% of total deaths]
What caused the most deaths in different age groups in 2016?
Percent contribution of top 10 causes of death by age group, both sexes, 2016
HIV/AIDS & tuberculosis
Diarrhoea/LRI*/other
NTDs†
& malaria
Maternal disorders
Neonatal disorders
Nutritional deficiencies
Other communicable diseases
Cancers
Cardiovascular diseases
Chronic respiratory diseases
Cirrhosis
Digestive diseases
Neurological disorders
Diabetes/urog‡
/blood/endo§
Other non-communicable
Transport injuries
Unintentional injuries
Suicide & violence
Other causes of death
*LRI is lower respiratory infections.
†
NTDs are neglected tropical diseases.
‡
Urog is urogenital diseases.
§
Endo is endocrine diseases.
How much did the under-5 mortality rate change from 1990 to 2016?
Under-5 mortality rate, both sexes combined, 1990-2016
What caused the most deaths in different age groups in 2016?
Percent contribution of top 10 causes of death by age group, both sexes, 2016
Uttarakhand](https://image.slidesharecdn.com/indiahealthofthenationsstatesreport2017-230818115250-fe055a08/85/India_Health_of_the_Nation-s_States_Report_2017-pdf-195-320.jpg)
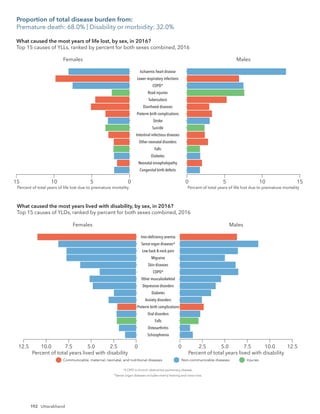
![193
Uttarakhand
Ischaemic heart disease [7.8%]
COPD†
[6.8%]
Lower respiratory infections [5.5%]
Road injuries [4.2%]
Tuberculosis [3.6%]
Diarrhoeal diseases [3.0%]
Preterm birth complications [3.0%]*
Iron-deficiency anaemia [2.8%]
Sense organ diseases‡
[2.8%]
Low back & neck pain [2.3%]
Diabetes [2.2%]
Stroke [2.2%]
Skin diseases [2.1%]
Migraine [2.1%]
Falls [2.0%]
Intestinal infectious diseases [1.7%]
Other neonatal disorders [1.7%]
Asthma [1.6%]*
Neonatal encephalopathy [1.3%]
Tetanus [0.3%]
Measles [0.2%]
Diarrhoeal diseases [12.7%]
Lower respiratory infections [8.3%]
Tuberculosis [7.1%]
COPD†
[4.2%]
Preterm birth complications [3.9%]
Ischaemic heart disease [3.7%]
Tetanus [3.5%]
Other neonatal disorders [2.8%]
Intestinal infectious diseases [2.7%]
Road injuries [2.5%]
Neonatal encephalopathy [2.4%]
Measles [2.2%]
Iron-deficiency anaemia [2.1%]
Stroke [1.6%]
Asthma [1.5%]
Sense organ diseases‡
[1.4%]
Skin diseases [1.3%]
Falls [1.2%]
Low back & neck pain [1.2%]
Migraine [1.1%]
Diabetes [0.7%]
1
2
3
4
5
6
7
8
9
10
11
12
13
14
15
1
2
3
4
5
6
7
8
9
10
11
12
13
14
15
17
18
21
24
73
25
82
37
21
23
17
19
Leading causes of DALYs 1990
How have the leading causes of death and disability combined changed from 1990 to 2016?
Change in top 15 causes of DALYs, both sexes, ranked by number of DALYs, 1990–2016
Leading causes of DALYs 2016
Communicable, maternal,
neonatal, and nutritional diseases
Non-communicable diseases Injuries same or increase decrease
*Change not significant.
The percent figure in brackets next to each cause is
DALYs from that cause out of total DALYs.
†
COPD is chronic obstructive pulmonary disease.
‡
Sense organ diseases includes mainly hearing and vision loss.
§
Self-harm refers to suicide and the nonfatal outcomes of self-harm.
[2.21]
[0.33] [0.31]
[0.45]
[0.54]
[0.59] [0.66] [0.78] [0.89]
[1.09]
[1.34] [1.67]
[2.08]
[2.6]
[3.11]
[3.53]
[4.02]
[4.45]
The number in the bracket on top of each vertical bar is the ratio of percent DALYs to population for that age group.
The number in parentheses after each age group on the x-axis is the percent of population in that age group.
Communicable, maternal, neonatal, and nutritional diseases
Percent
of
total
DALYs
Age
Non-communicable diseases Injuries
What caused the most death and disability combined across age groups in 2016?
Percent of DALYs by age group, both sexes, 2016
U
n
d
e
r
5
(
8
%
)
5
t
o
9
(
1
0
%
)
1
0
t
o
1
4
(
1
0
%
)
1
5
t
o
1
9
(
1
1
%
)
2
0
t
o
2
4
(
1
0
%
)
2
5
t
o
2
9
(
8
%
)
3
0
t
o
3
4
(
8
%
)
3
5
t
o
3
9
(
7
%
)
4
0
t
o
4
4
(
6
%
)
4
5
t
o
4
9
(
5
%
)
5
0
t
o
5
4
(
5
%
)
5
5
t
o
5
9
(
4
%
)
6
0
t
o
6
4
(
4
%
)
6
5
t
o
6
9
(
2
%
)
7
0
t
o
7
4
(
2
%
)
7
5
t
o
7
9
(
1
%
)
8
0
t
o
8
4
(
1
%
)
8
5
+
(
<
1
%
)
0
5
10
15
How have the leading causes of death and disability combined changed from 1990 to 2016?
Change in top 15 causes of DALYs, both sexes, ranked by number of DALYs, 1990–2016
What caused the most death and disability combined across age groups in 2016?
Percent of DALYs by age group, both sexes, 2016
Proportion of total disease burden from:
CMNNDs: 31.7% | NCDs: 55.5% | Injuries: 12.9%](https://image.slidesharecdn.com/indiahealthofthenationsstatesreport2017-230818115250-fe055a08/85/India_Health_of_the_Nation-s_States_Report_2017-pdf-197-320.jpg)
![194 Uttarakhand
What risk factors are driving the most death and disability combined?
Contribution of top 10 risks to DALYs number, both sexes, ranked by number of DALYs, 19
Risk factors 1990 Risk factors 2016
The percent figure in bracket next to each risk is DALYs from that risk out of total DALYs. *Malnutrition is child and maternal malnutrition.
†
WaSH is unsafe water, sanitation, and handwashing.
Risk factors 1990 Risk factors 2016
same or increase decrease
Behavioural Environmental/occupational Metabolic
Malnutrition* [29.2%]
WaSH†
[12.9%]
Air pollution [10.8%]
Tobacco use [6.4%]
Dietary risks [4.4%]
High blood pressure [4.0%]
High fasting plasma glucose [2.1%]
Occupational risks [2.1%]
Alcohol & drug use [1.8%]
High total cholesterol [1.7%]
Malnutrition* [13.5%]
Air pollution [9.3%]
Tobacco use [8.8%]
High blood pressure [7.5%]
Dietary risks [7.4%]
High fasting plasma glucose [5.5%]
High body-mass index [4.7%]
High total cholesterol [3.9%]
Alcohol & drug use [3.7%]
Occupational risks [3.2%]
1
2
3
4
5
6
7
8
9
10
1
2
3
4
5
6
7
8
9
10
High body-mass index [1.0%] WaSH†
[2.7%]
12 11
Risk factors 1990 Risk factors 2016
The percent figure in bracket next to each risk is DALYs from that risk out of total DALYs. *Malnutrition is child and maternal malnutrition.
†
WaSH is unsafe water, sanitation, and handwashing.
What risk factors are driving the most death and disability combined?
Contribution of top 10 risks to DALYs number, both sexes, ranked by number of DALYs, 1990-2016
same or increase decrease
Behavioural Environmental/occupational Metabolic
Malnutrition* [32.2%]
WaSH†
[15.2%]
Air pollution [7.7%]
Tobacco use [3.6%]
Dietary risks [2.3%]
High blood pressure [2.2%]
Occupational risks [1.9%]
Alcohol & drug use [1.6%]
High fasting plasma glucose [1.4%]
Impaired kidney function [0.9%]
Malnutrition* [14.8%]
Air pollution [5.1%]
High blood pressure [5.0%]
Tobacco use [4.9%]
Dietary risks [4.7%]
High fasting plasma glucose [4.0%]
WaSH†
[3.9%]
Alcohol & drug use [3.9%]
Occupational risks [2.6%]
Impaired kidney function [2.0%]
1
2
3
4
5
6
7
8
9
10
1
2
3
4
5
6
7
8
9
10
Females
Occupational risks
Alcohol & drug use
High total cholesterol
High body-mass index
High fasting plasma glucose
Dietary risks
High blood pressure
Tobacco use
Air pollution
Malnutrition*
Males
4
12
16 8 0 12
4
0 8 16
Percent of years of life lost and years lived with disability Percent of years of life lost and years lived with disability
How did the risk factors differ by sex in 2016?
Percent of total DALYs attributable to top 10 risks, ranked by percent for both sexes combined, 2016
Behavioural Environmental/occupational Metabolic
*Malnutrition is child and maternal malnutrition.
What risk factors are driving the most death and disability combined?
Contribution of top 10 risks to DALYs number, both sexes, ranked by number of DALYs, 1990-2016](https://image.slidesharecdn.com/indiahealthofthenationsstatesreport2017-230818115250-fe055a08/85/India_Health_of_the_Nation-s_States_Report_2017-pdf-198-320.jpg)
![195
0
50
100
150
1990 1995 2000 2005 2010 2016
Year
Deaths
per
1,000
live
births
West Bengal under-5 rate India under-5 rate Comparative average rate globally for similar
Socio-demographic Index as West Bengal
39.2
30.4
34.2
How much did the under-5 mortality rate change from 1990 to 2016?
Under-5 mortality rate, both sexes combined, 1990-2016
2016 life expectancy
Females: 71.3 years Males: 68.1 years
1990 life expectancy
Females: 59.6 years Males: 58.4 years
West Bengal
1.3%
30.6%
3.7%
38.6%
1.8%
1.9%
1.5%
7.1%
1.4%
7.5%
4.6%
9.7%
7.3%
2.3%
6.5%
15.7%
4.3%
4.7%
10.2%
8.9%
20.6%
9.8%
4.5%
6.1%
12.9%
44.6%
8%
3.4%
6.5%
2.6%
3.3%
2.7%
5.5%
1.7%
14%
5.9%
47.2%
12.1%
1%
1.7%
3.8%
7.3%
3.1%
2.4%
0−14 years [6.4% of total deaths] 15−39 years [11.4% of total deaths]
40−69 years [42% of total deaths] 70+ years [40.1% of total deaths]
What caused the most deaths in different age groups in 2016?
Percent contribution of top 10 causes of death by age group, both sexes, 2016
HIV/AIDS & tuberculosis
Diarrhoea/LRI*/other
NTDs†
& malaria
Maternal disorders
Neonatal disorders
Nutritional deficiencies
Other communicable diseases
Cancers
Cardiovascular diseases
Chronic respiratory diseases
Cirrhosis
Digestive diseases
Neurological disorders
Diabetes/urog‡
/blood/endo§
Other non-communicable
Transport injuries
Unintentional injuries
Suicide & violence
Other causes of death
*LRI is lower respiratory infections.
†
NTDs are neglected tropical diseases.
‡
Urog is urogenital diseases.
§
Endo is endocrine diseases.
How much did the under-5 mortality rate change from 1990 to 2016?
Under-5 mortality rate, both sexes combined, 1990-2016
What caused the most deaths in different age groups in 2016?
Percent contribution of top 10 causes of death by age group, both sexes, 2016
West Bengal](https://image.slidesharecdn.com/indiahealthofthenationsstatesreport2017-230818115250-fe055a08/85/India_Health_of_the_Nation-s_States_Report_2017-pdf-199-320.jpg)
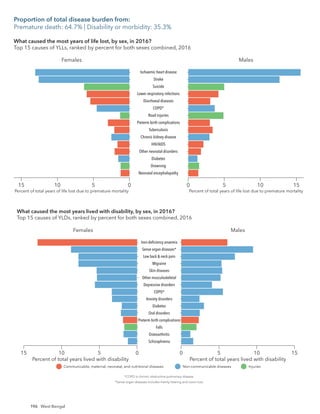
![197
West Bengal
Ischaemic heart disease [9.7%]
Stroke [8.5%]
COPD†
[4.2%]
Self-harm§
[3.7%]*
Iron-deficiency anaemia [3.5%]
Lower respiratory infections [3.3%]
Sense organ diseases‡
[3.2%]
Diarrhoeal diseases [3.0%]
Preterm birth complications [2.7%]
Low back & neck pain [2.6%]
Road injuries [2.6%]
Migraine [2.3%]
Chronic kidney disease [2.2%]
Skin diseases [2.1%]
Tuberculosis [2.0%]
Other neonatal disorders [1.3%]
Congenital birth defects [1.2%]
Neonatal encephalopathy [0.9%]
Measles [0.2%]
Tetanus [0.0%]
Lower respiratory infections [9.8%]
Diarrhoeal diseases [7.7%]
Preterm birth complications [6.2%]
Measles [5.9%]
Tuberculosis [4.4%]
Ischaemic heart disease [4.2%]
Stroke [4.0%]
Other neonatal disorders [3.7%]
Self-harm§
[2.8%]
COPD†
[2.5%]
Neonatal encephalopathy [2.5%]
Iron-deficiency anaemia [2.2%]
Congenital birth defects [1.6%]
Road injuries [1.5%]
Tetanus [1.5%]
Sense organ diseases‡
[1.4%]
Low back & neck pain [1.3%]
Chronic kidney disease [1.2%]
Skin diseases [1.2%]
Migraine [1.1%]
1
2
3
4
5
6
7
8
9
10
11
12
13
14
15
1
2
3
4
5
6
7
8
9
10
11
12
13
14
15
21
22
25
86
131
24
22
23
18
21
Leading causes of DALYs 1990
How have the leading causes of death and disability combined changed from 1990 to 2016?
Change in top 15 causes of DALYs, both sexes, ranked by number of DALYs, 1990–2016
Leading causes of DALYs 2016
Communicable, maternal,
neonatal, and nutritional diseases
Non-communicable diseases Injuries same or increase decrease
*Change not significant.
The percent figure in brackets next to each cause is
DALYs from that cause out of total DALYs.
†
COPD is chronic obstructive pulmonary disease.
‡
Sense organ diseases includes mainly hearing and vision loss.
§
Self-harm refers to suicide and the nonfatal outcomes of self-harm.
[1.75]
[0.32]
[0.32]
[0.46]
[0.56]
[0.61] [0.69]
[0.8]
[0.93]
[1.12]
[1.39]
[1.74]
[2.16]
[2.73]
[3.29]
[3.76]
[4.31]
[4.81]
The number in the bracket on top of each vertical bar is the ratio of percent DALYs to population for that age group.
The number in parentheses after each age group on the x-axis is the percent of population in that age group.
Communicable, maternal, neonatal, and nutritional diseases
Percent
of
total
DALYs
Age
Non-communicable diseases Injuries
What caused the most death and disability combined across age groups in 2016?
Percent of DALYs by age group, both sexes, 2016
U
n
d
e
r
5
(
6
%
)
5
t
o
9
(
8
%
)
1
0
t
o
1
4
(
9
%
)
1
5
t
o
1
9
(
9
%
)
2
0
t
o
2
4
(
9
%
)
2
5
t
o
2
9
(
9
%
)
3
0
t
o
3
4
(
8
%
)
3
5
t
o
3
9
(
8
%
)
4
0
t
o
4
4
(
7
%
)
4
5
t
o
4
9
(
6
%
)
5
0
t
o
5
4
(
6
%
)
5
5
t
o
5
9
(
5
%
)
6
0
t
o
6
4
(
3
%
)
6
5
t
o
6
9
(
2
%
)
7
0
t
o
7
4
(
2
%
)
7
5
t
o
7
9
(
1
%
)
8
0
t
o
8
4
(
1
%
)
8
5
+
(
<
1
%
)
0.0
2.5
2.5
7.5
10.0
12.5
How have the leading causes of death and disability combined changed from 1990 to 2016?
Change in top 15 causes of DALYs, both sexes, ranked by number of DALYs, 1990–2016
What caused the most death and disability combined across age groups in 2016?
Percent of DALYs by age group, both sexes, 2016
Proportion of total disease burden from:
CMNNDs: 24.8% | NCDs: 62.7% | Injuries: 12.6%](https://image.slidesharecdn.com/indiahealthofthenationsstatesreport2017-230818115250-fe055a08/85/India_Health_of_the_Nation-s_States_Report_2017-pdf-201-320.jpg)
![198 West Bengal
What risk factors are driving the most death and disability combined?
Contribution of top 10 risks to DALYs number, both sexes, ranked by number of DALYs, 19
Risk factors 1990 Risk factors 2016
The percent figure in bracket next to each risk is DALYs from that risk out of total DALYs. *Malnutrition is child and maternal malnutrition.
†
WaSH is unsafe water, sanitation, and handwashing.
Risk factors 1990 Risk factors 2016
same or increase decrease
Behavioural Environmental/occupational Metabolic
Malnutrition* [32.9%]
Air pollution [12.0%]
WaSH†
[8.5%]
Dietary risks [6.2%]
High blood pressure [5.7%]
Tobacco use [5.5%]
High total cholesterol [2.3%]
High fasting plasma glucose [2.1%]
Impaired kidney function [2.0%]
Occupational risks [2.0%]
Dietary risks [13.1%]
High blood pressure [12.9%]
Air pollution [11.4%]
Malnutrition* [10.4%]
Tobacco use [8.6%]
High fasting plasma glucose [5.9%]
High total cholesterol [5.2%]
Impaired kidney function [4.0%]
Alcohol & drug use [3.8%]
Occupational risks [3.3%]
1
2
3
4
5
6
7
8
9
10
1
2
3
4
5
6
7
8
9
10
Alcohol & drug use [1.9%] WaSH†
[3.1%]
11 12
Risk factors 1990 Risk factors 2016
The percent figure in bracket next to each risk is DALYs from that risk out of total DALYs. *Malnutrition is child and maternal malnutrition.
†
WaSH is unsafe water, sanitation, and handwashing.
What risk factors are driving the most death and disability combined?
Contribution of top 10 risks to DALYs number, both sexes, ranked by number of DALYs, 1990-2016
same or increase decrease
Behavioural Environmental/occupational Metabolic
Malnutrition* [32.2%]
WaSH†
[15.2%]
Air pollution [7.7%]
Tobacco use [3.6%]
Dietary risks [2.3%]
High blood pressure [2.2%]
Occupational risks [1.9%]
Alcohol & drug use [1.6%]
High fasting plasma glucose [1.4%]
Impaired kidney function [0.9%]
Malnutrition* [14.8%]
Air pollution [5.1%]
High blood pressure [5.0%]
Tobacco use [4.9%]
Dietary risks [4.7%]
High fasting plasma glucose [4.0%]
WaSH†
[3.9%]
Alcohol & drug use [3.9%]
Occupational risks [2.6%]
Impaired kidney function [2.0%]
1
2
3
4
5
6
7
8
9
10
1
2
3
4
5
6
7
8
9
10
Females
Occupational risks
Alcohol & drug use
Impaired kidney function
High total cholesterol
High fasting plasma glucose
Tobacco use
Malnutrition*
Air pollution
High blood pressure
Dietary risks
Males
4
12
16 8 0 12
4
0 8 16
Percent of years of life lost and years lived with disability Percent of years of life lost and years lived with disability
How did the risk factors differ by sex in 2016?
Percent of total DALYs attributable to top 10 risks, ranked by percent for both sexes combined, 2016
Behavioural Environmental/occupational Metabolic
*Malnutrition is child and maternal malnutrition.
What risk factors are driving the most death and disability combined?
Contribution of top 10 risks to DALYs number, both sexes, ranked by number of DALYs, 1990-2016](https://image.slidesharecdn.com/indiahealthofthenationsstatesreport2017-230818115250-fe055a08/85/India_Health_of_the_Nation-s_States_Report_2017-pdf-202-320.jpg)