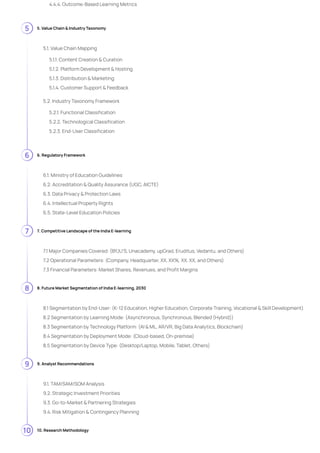
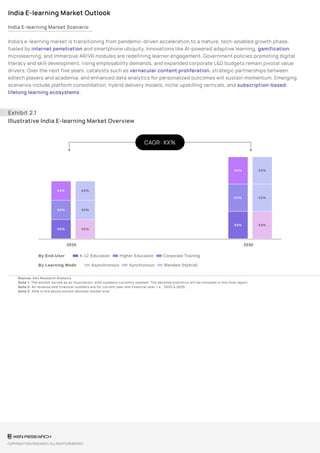
India E-learning Market Outlook To
Fy 2030
Increasing Technology Adoption to Drive
Future Growth
August 2025
Author: | Vertical: Education and Recruitment | Region: Asia
Shaped by Smartphone & Internet Penetration, Government Digital Initiatives (e.g., DIKSHA, SWAYAM), Rising
Demand for Upskilling & Reskilling.
Table of Contents
1. Executive Summary
2. Market Overview
3. Market Segmentation of India E-learning, 2025
4. Industry Analysis
1
1.1 Executive Summary of India E-learning Market
2
2.1. Market Volume Analysis
2.2. Market Revenue Analysis
2.3. Historical Market Trends (2015–2023)
2.4. Forecast Market Outlook (2024–2030)
2.5. Five-Year CAGR (2025–2030)
3
3.1 Segmentation by End-User: (K-12 Education, Higher Education, Corporate Training, Vocational & Skill Development)
3.2 Segmentation by Learning Mode: (Asynchronous, Synchronous, Blended (Hybrid))
3.3 Segmentation by Technology Platform: (AI & ML, AR/VR, Big Data Analytics, Blockchain)
3.4 Segmentation by Deployment Mode: (Cloud-based, On-premise)
3.5 Segmentation by Device Type: (Desktop/Laptop, Mobile, Tablet, Others)
4
4.1. Growth Value Drivers
4.1.1. Smartphone & Internet Penetration
4.1.2. Government Digital Initiatives (e.g., DIKSHA, SWAYAM)
4.1.3. Rising Demand for Upskilling & Reskilling
4.1.4. Increasing Private Investments
4.2. Industry Challenges
4.2.1. Digital Divide & Rural Accessibility
4.2.2. Content Localization & Language Barriers
4.2.3. Infrastructure & Bandwidth Constraints
4.2.4. Data Privacy & Security Concerns
4.3. Opportunities
4.3.1. AI-Driven Personalized Learning
4.3.2. Microlearning & Bite-Sized Content
4.3.3. Corporate E-learning Partnerships
4.3.4. Regional & Vernacular Content Development
4.4. Key Market Trends
4.4.1. Gamification & Immersive Technologies (AR/VR)
4.4.2. Subscription-Based Models
4.4.3. Collaborative & Social Learning
5. Value Chain & Industry Taxonomy
6. Regulatory Framework
7. Competitive Landscape of the India E-learning
8. Future Market Segmentation of India E-learning, 2030
9. Analyst Recommendations
10. Research Methodology
4.4.4. Outcome-Based Learning Metrics
5
5.1. Value Chain Mapping
5.1.1. Content Creation & Curation
5.1.2. Platform Development & Hosting
5.1.3. Distribution & Marketing
5.1.4. Customer Support & Feedback
5.2. Industry Taxonomy Framework
5.2.1. Functional Classification
5.2.2. Technological Classification
5.2.3. End-User Classification
6
6.1. Ministry of Education Guidelines
6.2. Accreditation & Quality Assurance (UGC, AICTE)
6.3. Data Privacy & Protection Laws
6.4. Intellectual Property Rights
6.5. State-Level Education Policies
7
7.1 Major Companies Covered: (BYJU’S, Unacademy, upGrad, Eruditus, Vedantu, and Others)
7.2 Operational Parameters: (Company, Headquarter, XX, XX%, XX, XX, and Others)
7.3 Financial Parameters: Market Shares, Revenues, and Profit Margins
8
8.1 Segmentation by End-User: (K-12 Education, Higher Education, Corporate Training, Vocational & Skill Development)
8.2 Segmentation by Learning Mode: (Asynchronous, Synchronous, Blended (Hybrid))
8.3 Segmentation by Technology Platform: (AI & ML, AR/VR, Big Data Analytics, Blockchain)
8.4 Segmentation by Deployment Mode: (Cloud-based, On-premise)
8.5 Segmentation by Device Type: (Desktop/Laptop, Mobile, Tablet, Others)
9
9.1. TAM/SAM/SOM Analysis
9.2. Strategic Investment Priorities
9.3. Go-to-Market & Partnering Strategies
9.4. Risk Mitigation & Contingency Planning
10
11. Disclaimer
12. Contact Us
10.1. Data Sources (Primary & Secondary)
10.2. Survey & Interview Framework
10.3. Forecasting Techniques & Assumptions
10.4. Limitations & Data Validation Procedures
11
12
01
Executive Summary
Executive Summary
Exhibit 1.1
Taxonomy & Market Size of India E-learning Market
India E-learning Market
(USD XX Bn)
By End-User By Learning Mode
K-12 Education
XX%
K-12 education
drives e-learning
growth in India.
Primary
(XX%)
Upper Primary
(XX%)
Higher
Secondary
(XX%)
Higher Education
XX%
Higher education
expands with
online courses.
Undergraduate
Programs
(XX%)
Postgraduate
Programs
(XX%)
Professional
Courses
(XX%)
Corporate Training
XX%
Corporate
training
enhances
workforce skills.
Onboarding &
Orientation
(XX%)
Technical Skills
(XX%)
Compliance
Training
(XX%)
Asynchronous
XX%
Asynchronous
learning offers
flexibility and
convenience.
Self-paced
Video Courses
(XX%)
Recorded
Webinars
(XX%)
e-Books & PDFs
(XX%)
Synchronous
XX%
Synchronous
learning provides
real-time
interaction.
Live Virtual
Classrooms
(XX%)
Webinars &
Workshops
(XX%)
Video
Conferencing
(XX%)
Blended (Hybrid)
XX%
Blended learning
combines online
and offline
methods.
Flipped
Classroom
(XX%)
Physical
Workshops
(XX%)
Integrated LMS
(XX%)
By Technology Platform AI & ML AR/VR Big Data Analytics Blockchain
By Deployment Mode Cloud-based On-premise
By Device Type Desktop/Laptop Mobile Tablet Others
Source: Ken Research Analysis
Note 1: Exhibits are illustrative; detailed numbers appear in the full report.
Note 2: XX% denotes CAGR.
COPYRIGHT KEN RESEARCH. ALL RIGHTS RESERVED
02
India E-learning Market
Outlook
India E-learning Market Outlook
India E-learning Market Scenario
India’s e-learning market is transitioning from pandemic-driven acceleration to a mature, tech-enabled growth phase,
fueled by internet penetration and smartphone ubiquity. Innovations like AI-powered adaptive learning, gamification,
microlearning, and immersive AR/VR modules are redefining learner engagement. Government policies promoting digital
literacy and skill development, rising employability demands, and expanded corporate L&D budgets remain pivotal value
drivers. Over the next five years, catalysts such as vernacular content proliferation, strategic partnerships between
edtech players and academia, and enhanced data analytics for personalized outcomes will sustain momentum. Emerging
scenarios include platform consolidation, hybrid delivery models, niche upskilling verticals, and subscription-based
lifelong learning ecosystems.
Exhibit 2.1
Illustrative India E-learning Market Overview
XX%
XX%
XX%
XX%
XX%
XX%
XX%
XX%
XX%
XX%
XX%
XX%
2025 2030
By End-User K-12 Education Higher Education Corporate Training
By Learning Mode Asynchronous Synchronous Blended (Hybrid)
Source: Ken Research Analysis
Note 1: The exhibit serves as an illustration, with numbers currently masked. The detailed statistics will be included in the final report.
Note 2: All revenue and financial numbers are for current year and financial year, i.e., 2025 & 2030.
Note 3: XX% in the above exhibit denotes market size.
CAGR: XX%
COPYRIGHT KEN RESEARCH. ALL RIGHTS RESERVED
03
Market Segmentation of
India E-learning Market
Market Segmentation of India E-learning Market
India E-learning Market Segmentation
India’s E-learning Market Outlook to FY 2030 features segment performance. By End-User, K-12 Education leads with XX% share,
Higher Secondary (XX%) fueled by digital curriculum rollouts. Higher Education’s Undergraduate Programs (XX%) also exhibit strong
growth on accreditation partnerships. By Learning Mode, Asynchronous delivery via Self-paced Video Courses (XX%) commands the
largest adoption, while Synchronous Live Virtual Classrooms (XX%) expand rapidly on institutional investments. By Technology
Platform, AI & MLintegration drives personalized learning, with AR/VR pilot deployments gaining momentum. By Deployment Mode,
Cloud-based solutions (XX%) dominate on scalability. By Device Type, Mobile (XX%) sees highest usage due to smartphone
proliferation.
Exhibit 3.1
Illustrative Market Segmentation of India E-learning Market
Vocational & Skill
Development
XX%
Corporate Training
XX%
Higher Education
XX%
K-12 Education
XX%
Higher Secondary
(XX%)
Upper Primary
(XX%)
Primary
(XX%)
Blended (Hybrid)
XX%
Synchronous
XX%
Asynchronous
XX%
e-Books & PDFs
(XX%)
Recorded
Webinars
(XX%)
Self-paced Video
Courses
(XX%)
Blockchain
XX%
Big Data Analytics
XX%
AR/VR
XX%
AI & ML
XX%
On-premise
XX%
Cloud-based
XX%
Others
XX%
Tablet
XX%
Mobile
XX%
Desktop/Laptop
XX%
By End-User K-12 Education By Learning
Mode
Asynchronous By Technology
Platform
By Deployment
Mode
By Device Type
Key Takeaways:
Source: Ken Research Analysis
Note 1: This exhibit serves as a visual representation. The final chart will include additional segments along with detailed statistics
in the final report.
Note 2: All revenue and financial numbers are for the current year.
Note 3: "XX%" in the above exhibit denotes market shares.
K-12 Education leads the market with significant share.
Asynchronous learning modes are highly adopted.
AI & MLare driving personalized learning experiences.
Cloud-based solutions offer scalability and flexibility.
COPYRIGHT KEN RESEARCH. ALL RIGHTS RESERVED
04
Overview And Genesis Of
The India E-learning
Market
Overview And Genesis Of The India E-learning Market
India E-learning Market Ecosystem
India’s e-learning ecosystem features large enterprises (e.g., Byju’s, upGrad) with model canvas: Partners: publishers,
tech vendors; Activities: content development, AI personalization; Value: adaptive learning, accreditation; Channels:
mobile/web apps, partnerships; Customers: K-12, higher ed, professionals; Revenue: subscriptions, upsell, B2B licensing;
Costs: tech, content, marketing. Medium firms (Simplilearn, Toppr): Partners: corporates, universities; Activities:
blended courses, certification; Value: skill-based training; Channels: LMS, offline workshops; Customers: graduates,
mid-level pros; Revenue: course fees, corporate contracts; Costs: facilitation, partnerships. Small startups: Partners:
freelancers, ad networks; Activities: niche course creation; Value: affordability, flexibility; Channels: social media,
marketplaces; Customers: niche learners; Revenue: pay-per-course, ads; Costs: minimal tech, content.
Exhibit 4.1
Illustrative Ecosystem of India E-learning Market
Entity type Revenue Streams Players
K-12 Online Learning Providers
Byju’s
Vedantu
Toppr
Extramarks
Meritnation
Higher Education & Degree
Program Platforms
UpGrad
Coursera (local
partners)
Simplilearn
Great Learning
edX (India)
Test Prep & Certification
Platforms
Unacademy
Gradeup (BYJU’s
Exam Prep)
Embibe
Adda247
Career Launcher
Upskilling & Professional
Development Platforms
Simplilearn
Udacity
Pluralsight
Coursera
Imarticus Learning
Learning Management
Systems (LMS) & LCMS
Providers
Moodle
Blackboard
Canvas
Teachmint
Classplus
Course Marketplaces &
Aggregators
Udemy
Skillshare
Khan Academy
Edukart
LearnVern
Technology & Infrastructure
Providers
Amazon Web
Services
Microsoft Azure
Google Cloud
Platform
Kaltura
Focus on school‐grade curriculum delivery, smart
classes, doubt-clearing
▶
Subscription fees; pay-per-course; freemium (ads/in-
app purchases); referral/affiliate fees
▶
University‐affiliated online degrees, executive MBAs, PG
diplomas
▶
Program fees; revenue-share with universities;
subscription for micro-credentials; certification fees
▶
Competitive-exam coaching (JEE, NEET, UPSC),
certification prep (TOEFL, IELTS)
▶
Subscription (monthly/annual); mock-test packages;
one-time course fees; certification fees; ads
▶
Short courses for IT, data science, digital marketing, soft
skills
▶
Course fees; subscription bundles; corporate licensing;
placement-assistance fees; certification fees
▶
SaaS platforms for content hosting, tracking, reporting,
blended-learning
▶
Licensing (per-user/year); cloud hosting/subscription;
implementation/customization fees; support &
maintenance contracts
▶
Aggregated catalog of courses from multiple providers
▶
Commission on each sale; listing/lead-generation fees;
advertising/featured slots; subscription for “all-access”
passes
▶
Cloud services, CDNs, video streaming, AI/ML engines,
analytics dashboards
▶
Usage-based fees (compute, storage, bandwidth);
licensing of analytics/AI modules; professional-services
fees
▶
COPYRIGHT KEN RESEARCH. ALL RIGHTS RESERVED
Entity type Revenue Streams Players
Panopto
Hardware & Device
Manufacturers
HP
Dell
Lenovo
Samsung
Rashi Peripherals
Assessment & Proctoring
Services
Pearson VUE
Mercer Mettl
Examity
ProctorU
National Testing
Agency (NTA)
Professional Services &
Implementation Partners
TCS
Infosys
Wipro
Deloitte
Accenture
Investors & Accelerators
Sequoia Capital
Accel
Tiger Global
Matrix Partners
Nexus Venture
Partners
Government & Regulatory
Bodies
Ministry of Education
NITI Aayog
University Grants
Commission (UGC)
All India Council for
Technical Education
(AICTE)
Devices for online delivery: tablets, laptops,
smartboards, VR/AR kits
▶
One-time device sales; extended‐warranty/subscription;
asset-management services; leasing/rental
▶
Online exam delivery, remote proctoring, question-bank
management
▶
Per-exam/proctoring fees; certification fees; result-
analytics subscriptions; integration fees
▶
End-to-end deployment: content localization, platform
integration, change management
▶
Consultancy/implementation fees; training & onboarding
contracts; SLA-based managed-services; customization
▶
Equity funding of edtech startups, mentorship, market
access
▶
Management fees; carried interest; success-fees on
exits; advisory/consulting fees
▶
Policy-making, funding R&D and digital infrastructure,
grants for capacity building
▶
Grants/subsidies; public–private partnership funds; R&D
incentives; digital literacy programmes
▶
COPYRIGHT KEN RESEARCH. ALL RIGHTS RESERVED
05
Competitive Landscape
Competitive Landscape (1/3)
Competitive Landscape Overview
India’s e-learning market features Byju’s, Unacademy, Vedantu, Simplilearn and UpGrad. Byju’s leverages B2C
subscription bundles, live video tutoring, AI analytics and monthly fees; key resources include app technology and
content partnerships. Unacademy operates a freemium model for K-12 aspirants and premium test-prep classes, driving
revenue via subscriptions, educator partnerships and community engagement. Vedantu offers live tutoring and gamified
learning through student subscriptions and marketplace fees, powered by its proprietary WAVE platform. Simplilearn
targets professionals with online bootcamps and B2B enterprise training, earning course fees and university alliances.
UpGrad focuses on higher-education skilling via revenue-share university programs, recruitment tie-ups and hybrid
delivery.
Exhibit 5.1
Illustrative Market Shares of Key Players in India E-learning Market
Note: These are illustrative representations and do not reflect actual data or real-world figures
Source: Ken Research Analysis
Note 1: The XX% in the exhibit represents the market share of each company.
Note 2: The exhibit serves as an illustration, with numbers currently masked.
Note 3: All revenue and financial numbers are for the current year.
COPYRIGHT KEN RESEARCH. ALL RIGHTS RESERVED
Competitive Landscape (2/3)
Exhibit 5.2
Illustrative Competition Matrix of India E-learning Market
Major Players in India E-learning Market
Figure represents cumulative market share for only the product segment.:
Note: These are illustrative representations and do not reflect actual data or real-world figures
Large Players Medium Players Small Players
Source: Ken Research Analysis
Note 1: The XX% in the exhibit shows the market share of each company, which represents the company’s contribution to the total market.
Note 2: The exhibit serves as an illustration, with numbers currently masked.
Note 3: All revenue and financial numbers are for the current year.
Note 4: Enterprise size categories based on Annual revenue (US$)—Large > 100 Mn; Medium 20 Mn–100 Mn; Small < 20 Mn.
India E-learning Market: USD XX Bn
COPYRIGHT KEN RESEARCH. ALL RIGHTS RESERVED
Competitive Landscape (3/3)
Exhibit 5.3
Illustrative Cross Comparison of Key Players in India E-learning Market
Company Headquarter XX XX% XX XX XX XX% XX
BYJU’S Bengaluru, India XX XX% XX XX XX XX% XX
Unacademy Bengaluru, India XX XX% XX XX XX XX% XX
upGrad Mumbai, India XX XX% XX XX XX XX% XX
Eruditus Mumbai, India XX XX% XX XX XX XX% XX
Vedantu Bengaluru, India XX XX% XX XX XX XX% XX
Simplilearn San Francisco, USA XX XX% XX XX XX XX% XX
Extramarks Noida, India XX XX% XX XX XX XX% XX
Toppr Mumbai, India XX XX% XX XX XX XX% XX
Meritnation New Delhi, India XX XX% XX XX XX XX% XX
Testbook Navi Mumbai, India XX XX% XX XX XX XX% XX
Source: Ken Research Analysis
Note 1: The XX% and XX values in the exhibit represent placeholder data and will be replaced with actual figures in the final report.
Note 2: All revenue and financial numbers are for the current year.
COPYRIGHT KEN RESEARCH. ALL RIGHTS RESERVED
06
Analyst Recommendation
Exhibit 6.1
Target Addressable India E-learning Market Outlook To Fy 2030
Source: Ken Research Analysis
Note 1: The exhibit serves as an illustration, with numbers currently masked. The detailed statistics will be included in the final report.
Note 2: All revenue and financial numbers are for the current year.
TAM/SAM & SOM Analysis
TAM = USD XX Bn (Nationwide edtech demand
estimated via population metrics)
SAM = USD XX Bn (K12 and upskilling
segments quantified using enrolled
learners)
SOM = USD XX Bn (Realistic share in
leading states and metros based on
platform penetration)
COPYRIGHT KEN RESEARCH. ALL RIGHTS RESERVED
07
Ken Research Offerings
How can we add value ?
Strategy & Transformation
▶ Digital transformation ▶ Portfolio & Growth strategy
Growth and Scale-Up
Expanding service offerings
▶ Expansion of clinics and service
locations
▶ Specialization in niche health
services
▶ Strategic partnerships with
healthcare networks
Cost and Performance Excellence
Reduction in operational and
treatment costs
▶ Cost optimization in
administrative processes
▶ Streamlining patient
management systems
▶ Optimizing scheduling and
resource management
Customer Loyalty and Experience
Patient engagement and
retention
▶ Digital engagement with patients
▶ Telemedicine and online
consultation
▶ Personalization of patient care
Investment Advisory
▶ Commercial due diligence
▶ Target screening
Enablement and Implementation
▶ Post-merger integration ▶ Health service management
▶ Integration of new technologies
Ken Research
COPYRIGHT KEN RESEARCH. ALL RIGHTS RESERVED
Ken Offerings
Patient Experience & Retention Operational Efficiency Market Expansion & Growth
Cost & Revenue Optimization Quality & Compliance Technology & Digital
Integration
Board to Frontline KPI
Alignment
Our Solutions to Help Increase Stakeholder Value
Improve NPS, HCAHPS scores
with better care models.
➤
Reduce wait times and enhance
follow up rates.
➤
Expand telehealth to boost
engagement and retention.
➤
Optimize workflows for higher
patient throughput.
➤
Enhance provider utilization with
smart scheduling.
➤
Reduce consultation time while
maintaining quality.
➤
Expand services to increase
patient volume.
➤
Use digital marketing to boost
new patient acquisition.
➤
Develop corporate tie ups for
contracted service revenue.
➤
Lower operating costs per visit
with better resource use.
➤
Improve billing efficiency and
reduce claim rejections.
➤
Maximize revenue per provider
with better reimbursements.
➤
Ensure HIPAA, JCI, NABH
compliance.
➤
Reduce medication errors and
enhance adverse event reporting.
➤
Maintain high clinical outcome
scores.
➤
Use AI to enhance diagnostic
accuracy.
➤
Improve EHR data interoperability
and documentation.
➤
Increase telemedicine adoption
rates.
➤
Align cost per visit and EBITDA
margin.
➤
Set provider performance
benchmarks.
➤
Track treatment adherence and
care continuity.
➤
COPYRIGHT KEN RESEARCH. ALL RIGHTS RESERVED
THOUGHT LEADERSHIP
PATHWAYS
TO EXCEPTIONAL
GROWTH
▶Ken Research brings you industry-leading brand valuation,
combined with research from the world’s
This report is just the beginning. Connect with Ken Research
experts, who track macroeconomic trends impacting global
brands. Our library of over 20,000 reports spans key markets like
China, France, and the US, offering deep insights at
kenresearch.com.
With over 200 experts and insights from 80+ countries, Ken
Research provides the knowledge you need. Our comprehensive
approach combines innovative methodologies, consumer
insights, creative content, and strategic media investments,
optimizing your market presence and driving growth.
We are available to personally discuss how we can support you
and your brand’s success. Feel free to contact me Sincerely,
Ankur Gupta
Partner & Founder
ankur@kenresearch.com
Namit Goel
Partner & Founder
namit@kenresearch.com
COPYRIGHT KEN RESEARCH. ALL RIGHTS RESERVED
Research Methodology
1. Desk Research
Sources
Utilized industry reports,
academic publications, and
government databases to
gather data on the India E-
learning Market, including
market trends, key players,
and regulatory environment.
2. Expert Interviews
Conducted interviews with
industry experts,
educators, and e-learning
platform executives to gain
insights into market
dynamics, challenges, and
growth opportunities.
3. Sanity Check
Models
Applied a proxy model using
the number of users,
frequency of course
purchases, and average
spend to estimate the
addressable market size,
cross-verified with supply-
side data on player size and
revenue.
4. Forecasting
Modeling
Developed future market
forecasts using time-series
analysis and growth rate
projections, considering
factors like technological
advancements, policy
changes, and user adoption
rates.
SAMPLE SIZE BY STAKEHOLDERS
By Stakeholders Number of Respondents
C Level Executive ~ Respondents
Operational/Regional Managers ~ Respondents
Business Development / Sales Manager ~ Respondents
Others -Key opinion leaders from Associations, Warehouses, and Manufacturing firms.
SAMPLE SIZE BY RESPONDENT CATEGORY IN PERCENTAGE (%)
C Level Executive - XX%
Operational/Regional
Managers - XX%
Business Development /
Sales Manager - XX%
Others - XX%
COPYRIGHT KEN RESEARCH. ALL RIGHTS RESERVED
CATEGORIES
AGRICULTURE AND ANIMAL CARE
▶ Agriculture Equipment
▶ Animal Care
▶ Crop Protection
▶ Farming
▶ Seed
See More >
AUTOMOTIVE, TRANSPORTATION AND
WAREHOUSING
▶ Automotive and Automotive Components
▶ General Transportation
▶ Logistics and Shipping
See More >
BANKING FINANCIAL SERVICES AND
INSURANCE
▶ Banking
▶ Financial Services
▶ Insurance
▶ Loans and Advances
See More >
PUBLIC SECTOR AND ADMINISTRATION
▶ Legal Services
▶ Public Services
▶ Religion
See More >
ENERGY AND UTILITIES
▶ Clean Technology
▶ Gas
▶ Oil
▶ Power
See More >
HEALTHCARE
▶ Diagnostics
▶ General Healthcare
▶ Medical Devices
▶ Pharmaceuticals
See More >
DEFENSE AND SECURITY
▶ Defense
▶ Security Devices
▶ Weapon
See More >
METAL, MINING AND CHEMICALS
▶ Chemicals
▶ Metals & Minerals
▶ Mining
See More >
Technology AND TELECOM
▶ IT and ITES
▶ Telecommunications and Networking
See More >
COPYRIGHT KEN RESEARCH. ALL RIGHTS RESERVED
CATEGORIES
EDUCATION AND RECRUITMENT
▶ Education
▶ Recruitment
See More >
FOOD, BEVERAGE AND TOBACCO
▶ Alcoholic Beverages
▶ Dairy Products
▶ Food Services
▶ General Food
▶ Non Alcoholic Beverages
▶ Tobacco Products
See More >
MEDIA AND ENTERTAINMENT
▶ Advertising
▶ Films and Animation
▶ Gaming and Gambling
▶
Information Services, Newspaper and
Magazines
▶ Tourism
▶ TV, Radio and Broadcasting
See More >
MANUFACTURING AND CONSTRUCTION
▶ Construction Materials
▶ Industrial Engineering
▶ Infrastructure
▶ Machinery and Parts
▶ Other Manufacturing Activities
▶ Real Estate
See More >
CONSUMER PRODUCTS AND RETAIL
MARKET
▶ Baby Care
▶ Consumer Electronics
▶ Consumer Services
▶ Cosmetics and Personal Care
▶ Home and Office Furnishings
▶ Luxury Goods
▶ Sports Equipment
▶ Textile, Apparel and Footwear
▶ Wholesale and Retail
See More >
COPYRIGHT KEN RESEARCH. ALL RIGHTS RESERVED
CONTACT US
With 13 years of experience, we’ve served over 2,000 clients, including 70% of Fortune 500 companies,
delivering 20,000+ reports across 340+ industries.
We're here to help you find the right market insights and strategies. Our team is ready to support
your needs and help your business grow.
For further information, please contact:
ANKUR GUPTA
Partner & Founder
ankur@kenresearch.com
+91 9311149880
NAMIT GOEL
Partner & Founder
namit@kenresearch.com
+91 9311149880
INDIA (IN)
Unit 14, Tower B3, Spaze i Tech# Business Park, Sohna Road, sector
49 Gurgaon, Haryana - 122001, India
INDONESIA (ID)
The Icon BSD City, Jl. Verdant View IIIA No.15, Tangera Regency, Province Banten-15345, Indonesia
UNITED ARAB EMIRATES (UAE)
105, Al Jaz1, Street no 2 the Greens Dubai United Art Emirates.
QATAR
Office no. 9, Building no. 171, Zone no. 42, Street no. 230, Al-Rehab Complex, C-Ring road Doha, Qatar -
PO Box no. 30867

India’s Digital Learning Transformation Ken Research | Sample Report

  • 1.
    India E-learning MarketOutlook To Fy 2030 Increasing Technology Adoption to Drive Future Growth August 2025 Author: | Vertical: Education and Recruitment | Region: Asia Shaped by Smartphone & Internet Penetration, Government Digital Initiatives (e.g., DIKSHA, SWAYAM), Rising Demand for Upskilling & Reskilling.
  • 2.
    Table of Contents 1.Executive Summary 2. Market Overview 3. Market Segmentation of India E-learning, 2025 4. Industry Analysis 1 1.1 Executive Summary of India E-learning Market 2 2.1. Market Volume Analysis 2.2. Market Revenue Analysis 2.3. Historical Market Trends (2015–2023) 2.4. Forecast Market Outlook (2024–2030) 2.5. Five-Year CAGR (2025–2030) 3 3.1 Segmentation by End-User: (K-12 Education, Higher Education, Corporate Training, Vocational & Skill Development) 3.2 Segmentation by Learning Mode: (Asynchronous, Synchronous, Blended (Hybrid)) 3.3 Segmentation by Technology Platform: (AI & ML, AR/VR, Big Data Analytics, Blockchain) 3.4 Segmentation by Deployment Mode: (Cloud-based, On-premise) 3.5 Segmentation by Device Type: (Desktop/Laptop, Mobile, Tablet, Others) 4 4.1. Growth Value Drivers 4.1.1. Smartphone & Internet Penetration 4.1.2. Government Digital Initiatives (e.g., DIKSHA, SWAYAM) 4.1.3. Rising Demand for Upskilling & Reskilling 4.1.4. Increasing Private Investments 4.2. Industry Challenges 4.2.1. Digital Divide & Rural Accessibility 4.2.2. Content Localization & Language Barriers 4.2.3. Infrastructure & Bandwidth Constraints 4.2.4. Data Privacy & Security Concerns 4.3. Opportunities 4.3.1. AI-Driven Personalized Learning 4.3.2. Microlearning & Bite-Sized Content 4.3.3. Corporate E-learning Partnerships 4.3.4. Regional & Vernacular Content Development 4.4. Key Market Trends 4.4.1. Gamification & Immersive Technologies (AR/VR) 4.4.2. Subscription-Based Models 4.4.3. Collaborative & Social Learning
  • 3.
    5. Value Chain& Industry Taxonomy 6. Regulatory Framework 7. Competitive Landscape of the India E-learning 8. Future Market Segmentation of India E-learning, 2030 9. Analyst Recommendations 10. Research Methodology 4.4.4. Outcome-Based Learning Metrics 5 5.1. Value Chain Mapping 5.1.1. Content Creation & Curation 5.1.2. Platform Development & Hosting 5.1.3. Distribution & Marketing 5.1.4. Customer Support & Feedback 5.2. Industry Taxonomy Framework 5.2.1. Functional Classification 5.2.2. Technological Classification 5.2.3. End-User Classification 6 6.1. Ministry of Education Guidelines 6.2. Accreditation & Quality Assurance (UGC, AICTE) 6.3. Data Privacy & Protection Laws 6.4. Intellectual Property Rights 6.5. State-Level Education Policies 7 7.1 Major Companies Covered: (BYJU’S, Unacademy, upGrad, Eruditus, Vedantu, and Others) 7.2 Operational Parameters: (Company, Headquarter, XX, XX%, XX, XX, and Others) 7.3 Financial Parameters: Market Shares, Revenues, and Profit Margins 8 8.1 Segmentation by End-User: (K-12 Education, Higher Education, Corporate Training, Vocational & Skill Development) 8.2 Segmentation by Learning Mode: (Asynchronous, Synchronous, Blended (Hybrid)) 8.3 Segmentation by Technology Platform: (AI & ML, AR/VR, Big Data Analytics, Blockchain) 8.4 Segmentation by Deployment Mode: (Cloud-based, On-premise) 8.5 Segmentation by Device Type: (Desktop/Laptop, Mobile, Tablet, Others) 9 9.1. TAM/SAM/SOM Analysis 9.2. Strategic Investment Priorities 9.3. Go-to-Market & Partnering Strategies 9.4. Risk Mitigation & Contingency Planning 10
  • 4.
    11. Disclaimer 12. ContactUs 10.1. Data Sources (Primary & Secondary) 10.2. Survey & Interview Framework 10.3. Forecasting Techniques & Assumptions 10.4. Limitations & Data Validation Procedures 11 12
  • 5.
  • 6.
    Executive Summary Exhibit 1.1 Taxonomy& Market Size of India E-learning Market India E-learning Market (USD XX Bn) By End-User By Learning Mode K-12 Education XX% K-12 education drives e-learning growth in India. Primary (XX%) Upper Primary (XX%) Higher Secondary (XX%) Higher Education XX% Higher education expands with online courses. Undergraduate Programs (XX%) Postgraduate Programs (XX%) Professional Courses (XX%) Corporate Training XX% Corporate training enhances workforce skills. Onboarding & Orientation (XX%) Technical Skills (XX%) Compliance Training (XX%) Asynchronous XX% Asynchronous learning offers flexibility and convenience. Self-paced Video Courses (XX%) Recorded Webinars (XX%) e-Books & PDFs (XX%) Synchronous XX% Synchronous learning provides real-time interaction. Live Virtual Classrooms (XX%) Webinars & Workshops (XX%) Video Conferencing (XX%) Blended (Hybrid) XX% Blended learning combines online and offline methods. Flipped Classroom (XX%) Physical Workshops (XX%) Integrated LMS (XX%) By Technology Platform AI & ML AR/VR Big Data Analytics Blockchain By Deployment Mode Cloud-based On-premise By Device Type Desktop/Laptop Mobile Tablet Others Source: Ken Research Analysis Note 1: Exhibits are illustrative; detailed numbers appear in the full report. Note 2: XX% denotes CAGR. COPYRIGHT KEN RESEARCH. ALL RIGHTS RESERVED
  • 7.
  • 8.
    India E-learning MarketOutlook India E-learning Market Scenario India’s e-learning market is transitioning from pandemic-driven acceleration to a mature, tech-enabled growth phase, fueled by internet penetration and smartphone ubiquity. Innovations like AI-powered adaptive learning, gamification, microlearning, and immersive AR/VR modules are redefining learner engagement. Government policies promoting digital literacy and skill development, rising employability demands, and expanded corporate L&D budgets remain pivotal value drivers. Over the next five years, catalysts such as vernacular content proliferation, strategic partnerships between edtech players and academia, and enhanced data analytics for personalized outcomes will sustain momentum. Emerging scenarios include platform consolidation, hybrid delivery models, niche upskilling verticals, and subscription-based lifelong learning ecosystems. Exhibit 2.1 Illustrative India E-learning Market Overview XX% XX% XX% XX% XX% XX% XX% XX% XX% XX% XX% XX% 2025 2030 By End-User K-12 Education Higher Education Corporate Training By Learning Mode Asynchronous Synchronous Blended (Hybrid) Source: Ken Research Analysis Note 1: The exhibit serves as an illustration, with numbers currently masked. The detailed statistics will be included in the final report. Note 2: All revenue and financial numbers are for current year and financial year, i.e., 2025 & 2030. Note 3: XX% in the above exhibit denotes market size. CAGR: XX% COPYRIGHT KEN RESEARCH. ALL RIGHTS RESERVED
  • 9.
  • 10.
    Market Segmentation ofIndia E-learning Market India E-learning Market Segmentation India’s E-learning Market Outlook to FY 2030 features segment performance. By End-User, K-12 Education leads with XX% share, Higher Secondary (XX%) fueled by digital curriculum rollouts. Higher Education’s Undergraduate Programs (XX%) also exhibit strong growth on accreditation partnerships. By Learning Mode, Asynchronous delivery via Self-paced Video Courses (XX%) commands the largest adoption, while Synchronous Live Virtual Classrooms (XX%) expand rapidly on institutional investments. By Technology Platform, AI & MLintegration drives personalized learning, with AR/VR pilot deployments gaining momentum. By Deployment Mode, Cloud-based solutions (XX%) dominate on scalability. By Device Type, Mobile (XX%) sees highest usage due to smartphone proliferation. Exhibit 3.1 Illustrative Market Segmentation of India E-learning Market Vocational & Skill Development XX% Corporate Training XX% Higher Education XX% K-12 Education XX% Higher Secondary (XX%) Upper Primary (XX%) Primary (XX%) Blended (Hybrid) XX% Synchronous XX% Asynchronous XX% e-Books & PDFs (XX%) Recorded Webinars (XX%) Self-paced Video Courses (XX%) Blockchain XX% Big Data Analytics XX% AR/VR XX% AI & ML XX% On-premise XX% Cloud-based XX% Others XX% Tablet XX% Mobile XX% Desktop/Laptop XX% By End-User K-12 Education By Learning Mode Asynchronous By Technology Platform By Deployment Mode By Device Type Key Takeaways: Source: Ken Research Analysis Note 1: This exhibit serves as a visual representation. The final chart will include additional segments along with detailed statistics in the final report. Note 2: All revenue and financial numbers are for the current year. Note 3: "XX%" in the above exhibit denotes market shares. K-12 Education leads the market with significant share. Asynchronous learning modes are highly adopted. AI & MLare driving personalized learning experiences. Cloud-based solutions offer scalability and flexibility. COPYRIGHT KEN RESEARCH. ALL RIGHTS RESERVED
  • 11.
    04 Overview And GenesisOf The India E-learning Market
  • 12.
    Overview And GenesisOf The India E-learning Market India E-learning Market Ecosystem India’s e-learning ecosystem features large enterprises (e.g., Byju’s, upGrad) with model canvas: Partners: publishers, tech vendors; Activities: content development, AI personalization; Value: adaptive learning, accreditation; Channels: mobile/web apps, partnerships; Customers: K-12, higher ed, professionals; Revenue: subscriptions, upsell, B2B licensing; Costs: tech, content, marketing. Medium firms (Simplilearn, Toppr): Partners: corporates, universities; Activities: blended courses, certification; Value: skill-based training; Channels: LMS, offline workshops; Customers: graduates, mid-level pros; Revenue: course fees, corporate contracts; Costs: facilitation, partnerships. Small startups: Partners: freelancers, ad networks; Activities: niche course creation; Value: affordability, flexibility; Channels: social media, marketplaces; Customers: niche learners; Revenue: pay-per-course, ads; Costs: minimal tech, content. Exhibit 4.1 Illustrative Ecosystem of India E-learning Market Entity type Revenue Streams Players K-12 Online Learning Providers Byju’s Vedantu Toppr Extramarks Meritnation Higher Education & Degree Program Platforms UpGrad Coursera (local partners) Simplilearn Great Learning edX (India) Test Prep & Certification Platforms Unacademy Gradeup (BYJU’s Exam Prep) Embibe Adda247 Career Launcher Upskilling & Professional Development Platforms Simplilearn Udacity Pluralsight Coursera Imarticus Learning Learning Management Systems (LMS) & LCMS Providers Moodle Blackboard Canvas Teachmint Classplus Course Marketplaces & Aggregators Udemy Skillshare Khan Academy Edukart LearnVern Technology & Infrastructure Providers Amazon Web Services Microsoft Azure Google Cloud Platform Kaltura Focus on school‐grade curriculum delivery, smart classes, doubt-clearing ▶ Subscription fees; pay-per-course; freemium (ads/in- app purchases); referral/affiliate fees ▶ University‐affiliated online degrees, executive MBAs, PG diplomas ▶ Program fees; revenue-share with universities; subscription for micro-credentials; certification fees ▶ Competitive-exam coaching (JEE, NEET, UPSC), certification prep (TOEFL, IELTS) ▶ Subscription (monthly/annual); mock-test packages; one-time course fees; certification fees; ads ▶ Short courses for IT, data science, digital marketing, soft skills ▶ Course fees; subscription bundles; corporate licensing; placement-assistance fees; certification fees ▶ SaaS platforms for content hosting, tracking, reporting, blended-learning ▶ Licensing (per-user/year); cloud hosting/subscription; implementation/customization fees; support & maintenance contracts ▶ Aggregated catalog of courses from multiple providers ▶ Commission on each sale; listing/lead-generation fees; advertising/featured slots; subscription for “all-access” passes ▶ Cloud services, CDNs, video streaming, AI/ML engines, analytics dashboards ▶ Usage-based fees (compute, storage, bandwidth); licensing of analytics/AI modules; professional-services fees ▶ COPYRIGHT KEN RESEARCH. ALL RIGHTS RESERVED
  • 13.
    Entity type RevenueStreams Players Panopto Hardware & Device Manufacturers HP Dell Lenovo Samsung Rashi Peripherals Assessment & Proctoring Services Pearson VUE Mercer Mettl Examity ProctorU National Testing Agency (NTA) Professional Services & Implementation Partners TCS Infosys Wipro Deloitte Accenture Investors & Accelerators Sequoia Capital Accel Tiger Global Matrix Partners Nexus Venture Partners Government & Regulatory Bodies Ministry of Education NITI Aayog University Grants Commission (UGC) All India Council for Technical Education (AICTE) Devices for online delivery: tablets, laptops, smartboards, VR/AR kits ▶ One-time device sales; extended‐warranty/subscription; asset-management services; leasing/rental ▶ Online exam delivery, remote proctoring, question-bank management ▶ Per-exam/proctoring fees; certification fees; result- analytics subscriptions; integration fees ▶ End-to-end deployment: content localization, platform integration, change management ▶ Consultancy/implementation fees; training & onboarding contracts; SLA-based managed-services; customization ▶ Equity funding of edtech startups, mentorship, market access ▶ Management fees; carried interest; success-fees on exits; advisory/consulting fees ▶ Policy-making, funding R&D and digital infrastructure, grants for capacity building ▶ Grants/subsidies; public–private partnership funds; R&D incentives; digital literacy programmes ▶ COPYRIGHT KEN RESEARCH. ALL RIGHTS RESERVED
  • 14.
  • 15.
    Competitive Landscape (1/3) CompetitiveLandscape Overview India’s e-learning market features Byju’s, Unacademy, Vedantu, Simplilearn and UpGrad. Byju’s leverages B2C subscription bundles, live video tutoring, AI analytics and monthly fees; key resources include app technology and content partnerships. Unacademy operates a freemium model for K-12 aspirants and premium test-prep classes, driving revenue via subscriptions, educator partnerships and community engagement. Vedantu offers live tutoring and gamified learning through student subscriptions and marketplace fees, powered by its proprietary WAVE platform. Simplilearn targets professionals with online bootcamps and B2B enterprise training, earning course fees and university alliances. UpGrad focuses on higher-education skilling via revenue-share university programs, recruitment tie-ups and hybrid delivery. Exhibit 5.1 Illustrative Market Shares of Key Players in India E-learning Market Note: These are illustrative representations and do not reflect actual data or real-world figures Source: Ken Research Analysis Note 1: The XX% in the exhibit represents the market share of each company. Note 2: The exhibit serves as an illustration, with numbers currently masked. Note 3: All revenue and financial numbers are for the current year. COPYRIGHT KEN RESEARCH. ALL RIGHTS RESERVED
  • 16.
    Competitive Landscape (2/3) Exhibit5.2 Illustrative Competition Matrix of India E-learning Market Major Players in India E-learning Market Figure represents cumulative market share for only the product segment.: Note: These are illustrative representations and do not reflect actual data or real-world figures Large Players Medium Players Small Players Source: Ken Research Analysis Note 1: The XX% in the exhibit shows the market share of each company, which represents the company’s contribution to the total market. Note 2: The exhibit serves as an illustration, with numbers currently masked. Note 3: All revenue and financial numbers are for the current year. Note 4: Enterprise size categories based on Annual revenue (US$)—Large > 100 Mn; Medium 20 Mn–100 Mn; Small < 20 Mn. India E-learning Market: USD XX Bn COPYRIGHT KEN RESEARCH. ALL RIGHTS RESERVED
  • 17.
    Competitive Landscape (3/3) Exhibit5.3 Illustrative Cross Comparison of Key Players in India E-learning Market Company Headquarter XX XX% XX XX XX XX% XX BYJU’S Bengaluru, India XX XX% XX XX XX XX% XX Unacademy Bengaluru, India XX XX% XX XX XX XX% XX upGrad Mumbai, India XX XX% XX XX XX XX% XX Eruditus Mumbai, India XX XX% XX XX XX XX% XX Vedantu Bengaluru, India XX XX% XX XX XX XX% XX Simplilearn San Francisco, USA XX XX% XX XX XX XX% XX Extramarks Noida, India XX XX% XX XX XX XX% XX Toppr Mumbai, India XX XX% XX XX XX XX% XX Meritnation New Delhi, India XX XX% XX XX XX XX% XX Testbook Navi Mumbai, India XX XX% XX XX XX XX% XX Source: Ken Research Analysis Note 1: The XX% and XX values in the exhibit represent placeholder data and will be replaced with actual figures in the final report. Note 2: All revenue and financial numbers are for the current year. COPYRIGHT KEN RESEARCH. ALL RIGHTS RESERVED
  • 18.
  • 19.
    Analyst Recommendation Exhibit 6.1 TargetAddressable India E-learning Market Outlook To Fy 2030 Source: Ken Research Analysis Note 1: The exhibit serves as an illustration, with numbers currently masked. The detailed statistics will be included in the final report. Note 2: All revenue and financial numbers are for the current year. TAM/SAM & SOM Analysis TAM = USD XX Bn (Nationwide edtech demand estimated via population metrics) SAM = USD XX Bn (K12 and upskilling segments quantified using enrolled learners) SOM = USD XX Bn (Realistic share in leading states and metros based on platform penetration) COPYRIGHT KEN RESEARCH. ALL RIGHTS RESERVED
  • 20.
  • 21.
    How can weadd value ? Strategy & Transformation ▶ Digital transformation ▶ Portfolio & Growth strategy Growth and Scale-Up Expanding service offerings ▶ Expansion of clinics and service locations ▶ Specialization in niche health services ▶ Strategic partnerships with healthcare networks Cost and Performance Excellence Reduction in operational and treatment costs ▶ Cost optimization in administrative processes ▶ Streamlining patient management systems ▶ Optimizing scheduling and resource management Customer Loyalty and Experience Patient engagement and retention ▶ Digital engagement with patients ▶ Telemedicine and online consultation ▶ Personalization of patient care Investment Advisory ▶ Commercial due diligence ▶ Target screening Enablement and Implementation ▶ Post-merger integration ▶ Health service management ▶ Integration of new technologies Ken Research COPYRIGHT KEN RESEARCH. ALL RIGHTS RESERVED
  • 22.
    Ken Offerings Patient Experience& Retention Operational Efficiency Market Expansion & Growth Cost & Revenue Optimization Quality & Compliance Technology & Digital Integration Board to Frontline KPI Alignment Our Solutions to Help Increase Stakeholder Value Improve NPS, HCAHPS scores with better care models. ➤ Reduce wait times and enhance follow up rates. ➤ Expand telehealth to boost engagement and retention. ➤ Optimize workflows for higher patient throughput. ➤ Enhance provider utilization with smart scheduling. ➤ Reduce consultation time while maintaining quality. ➤ Expand services to increase patient volume. ➤ Use digital marketing to boost new patient acquisition. ➤ Develop corporate tie ups for contracted service revenue. ➤ Lower operating costs per visit with better resource use. ➤ Improve billing efficiency and reduce claim rejections. ➤ Maximize revenue per provider with better reimbursements. ➤ Ensure HIPAA, JCI, NABH compliance. ➤ Reduce medication errors and enhance adverse event reporting. ➤ Maintain high clinical outcome scores. ➤ Use AI to enhance diagnostic accuracy. ➤ Improve EHR data interoperability and documentation. ➤ Increase telemedicine adoption rates. ➤ Align cost per visit and EBITDA margin. ➤ Set provider performance benchmarks. ➤ Track treatment adherence and care continuity. ➤ COPYRIGHT KEN RESEARCH. ALL RIGHTS RESERVED
  • 23.
    THOUGHT LEADERSHIP PATHWAYS TO EXCEPTIONAL GROWTH ▶KenResearch brings you industry-leading brand valuation, combined with research from the world’s This report is just the beginning. Connect with Ken Research experts, who track macroeconomic trends impacting global brands. Our library of over 20,000 reports spans key markets like China, France, and the US, offering deep insights at kenresearch.com. With over 200 experts and insights from 80+ countries, Ken Research provides the knowledge you need. Our comprehensive approach combines innovative methodologies, consumer insights, creative content, and strategic media investments, optimizing your market presence and driving growth. We are available to personally discuss how we can support you and your brand’s success. Feel free to contact me Sincerely, Ankur Gupta Partner & Founder ankur@kenresearch.com Namit Goel Partner & Founder namit@kenresearch.com COPYRIGHT KEN RESEARCH. ALL RIGHTS RESERVED
  • 24.
    Research Methodology 1. DeskResearch Sources Utilized industry reports, academic publications, and government databases to gather data on the India E- learning Market, including market trends, key players, and regulatory environment. 2. Expert Interviews Conducted interviews with industry experts, educators, and e-learning platform executives to gain insights into market dynamics, challenges, and growth opportunities. 3. Sanity Check Models Applied a proxy model using the number of users, frequency of course purchases, and average spend to estimate the addressable market size, cross-verified with supply- side data on player size and revenue. 4. Forecasting Modeling Developed future market forecasts using time-series analysis and growth rate projections, considering factors like technological advancements, policy changes, and user adoption rates. SAMPLE SIZE BY STAKEHOLDERS By Stakeholders Number of Respondents C Level Executive ~ Respondents Operational/Regional Managers ~ Respondents Business Development / Sales Manager ~ Respondents Others -Key opinion leaders from Associations, Warehouses, and Manufacturing firms. SAMPLE SIZE BY RESPONDENT CATEGORY IN PERCENTAGE (%) C Level Executive - XX% Operational/Regional Managers - XX% Business Development / Sales Manager - XX% Others - XX% COPYRIGHT KEN RESEARCH. ALL RIGHTS RESERVED
  • 25.
    COPYRIGHT KEN RESEARCH.ALL RIGHTS RESERVED
  • 26.
    COPYRIGHT KEN RESEARCH.ALL RIGHTS RESERVED
  • 27.
    COPYRIGHT KEN RESEARCH.ALL RIGHTS RESERVED
  • 28.
    CATEGORIES AGRICULTURE AND ANIMALCARE ▶ Agriculture Equipment ▶ Animal Care ▶ Crop Protection ▶ Farming ▶ Seed See More > AUTOMOTIVE, TRANSPORTATION AND WAREHOUSING ▶ Automotive and Automotive Components ▶ General Transportation ▶ Logistics and Shipping See More > BANKING FINANCIAL SERVICES AND INSURANCE ▶ Banking ▶ Financial Services ▶ Insurance ▶ Loans and Advances See More > PUBLIC SECTOR AND ADMINISTRATION ▶ Legal Services ▶ Public Services ▶ Religion See More > ENERGY AND UTILITIES ▶ Clean Technology ▶ Gas ▶ Oil ▶ Power See More > HEALTHCARE ▶ Diagnostics ▶ General Healthcare ▶ Medical Devices ▶ Pharmaceuticals See More > DEFENSE AND SECURITY ▶ Defense ▶ Security Devices ▶ Weapon See More > METAL, MINING AND CHEMICALS ▶ Chemicals ▶ Metals & Minerals ▶ Mining See More > Technology AND TELECOM ▶ IT and ITES ▶ Telecommunications and Networking See More > COPYRIGHT KEN RESEARCH. ALL RIGHTS RESERVED
  • 29.
    CATEGORIES EDUCATION AND RECRUITMENT ▶Education ▶ Recruitment See More > FOOD, BEVERAGE AND TOBACCO ▶ Alcoholic Beverages ▶ Dairy Products ▶ Food Services ▶ General Food ▶ Non Alcoholic Beverages ▶ Tobacco Products See More > MEDIA AND ENTERTAINMENT ▶ Advertising ▶ Films and Animation ▶ Gaming and Gambling ▶ Information Services, Newspaper and Magazines ▶ Tourism ▶ TV, Radio and Broadcasting See More > MANUFACTURING AND CONSTRUCTION ▶ Construction Materials ▶ Industrial Engineering ▶ Infrastructure ▶ Machinery and Parts ▶ Other Manufacturing Activities ▶ Real Estate See More > CONSUMER PRODUCTS AND RETAIL MARKET ▶ Baby Care ▶ Consumer Electronics ▶ Consumer Services ▶ Cosmetics and Personal Care ▶ Home and Office Furnishings ▶ Luxury Goods ▶ Sports Equipment ▶ Textile, Apparel and Footwear ▶ Wholesale and Retail See More > COPYRIGHT KEN RESEARCH. ALL RIGHTS RESERVED
  • 30.
    COPYRIGHT KEN RESEARCH.ALL RIGHTS RESERVED
  • 31.
    CONTACT US With 13years of experience, we’ve served over 2,000 clients, including 70% of Fortune 500 companies, delivering 20,000+ reports across 340+ industries. We're here to help you find the right market insights and strategies. Our team is ready to support your needs and help your business grow. For further information, please contact: ANKUR GUPTA Partner & Founder ankur@kenresearch.com +91 9311149880 NAMIT GOEL Partner & Founder namit@kenresearch.com +91 9311149880 INDIA (IN) Unit 14, Tower B3, Spaze i Tech# Business Park, Sohna Road, sector 49 Gurgaon, Haryana - 122001, India INDONESIA (ID) The Icon BSD City, Jl. Verdant View IIIA No.15, Tangera Regency, Province Banten-15345, Indonesia UNITED ARAB EMIRATES (UAE) 105, Al Jaz1, Street no 2 the Greens Dubai United Art Emirates. QATAR Office no. 9, Building no. 171, Zone no. 42, Street no. 230, Al-Rehab Complex, C-Ring road Doha, Qatar - PO Box no. 30867