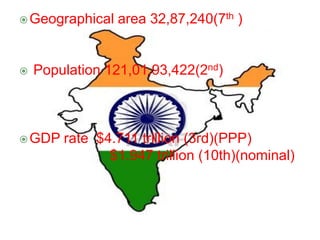
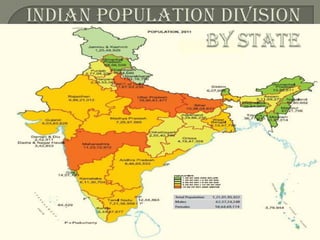
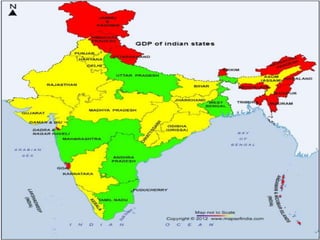
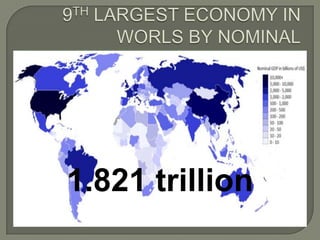
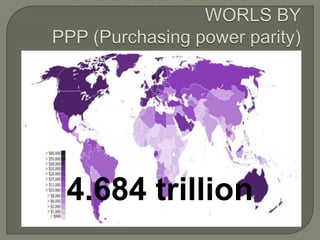
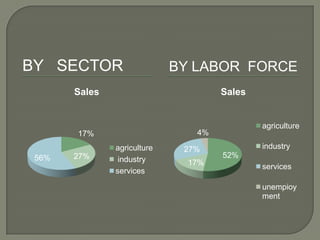
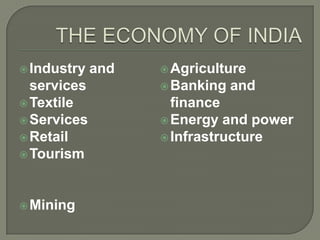
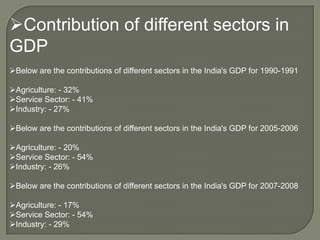
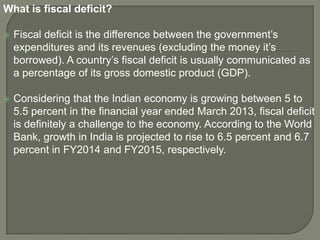
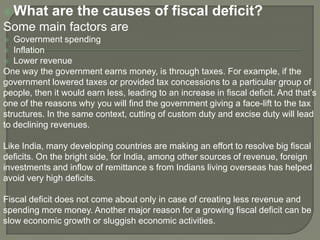
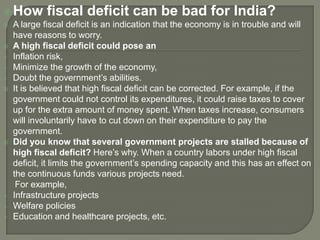
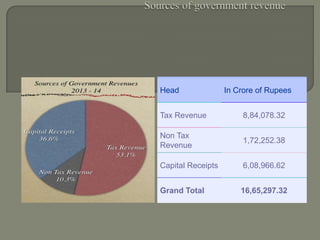
Presented by –
Sonu Gupta
Amol Dhurde
Nikita Das
Rohan Kulkarni
Ankita Walke
Bharat Singh
Sumesh Parkar
Geographical area 32,87,240(7th )
 Population 121,01,93,422(2nd)
GDP rate $4.711 trillion (3rd)(PPP)
$1.947 trillion (10th)(nominal)
private consumption
+ gross investment
+ government spending
+ (exports − imports)
1.821 trillion
4.684 trillion
BY SECTOR BY LABOR FORCE
17%
27%56%
Sales
agriculture
industry
services
52%
17%
27%
4%
Sales
agriculture
industry
services
unempioy
ment
Industry and
services
Textile
Services
Retail
Tourism
Mining
Agriculture
Banking and
finance
Energy and power
Infrastructure
INDUSTRY AND
SERVICES MINING
 Industry accounts for
28% of the GDP
 employs 14% of the
total workforce
 India is 11th in the
world in terms of
nominal factory output
 Mining forms an important
segment of the Indian
economy.
 producing 79 different
minerals
 Such as
Ironore, manganese, mica, bau
xite, chromite, silica
limestone, asbestos fluorite, etc
.
TEXTILE AGRICULTURE
 Textile manufacturing largest
source of employment after
agriculture
 accounts for 20% of
manufacturing
output, providing employment
to over 20 million people
 But demand for Indian textiles
in world markets continues to
fall.
 India ranks 2nd worldwide in
farm output
 Agriculture and allied sectors
accounted for 14.0% of the
GDP
 employed 58.00%
 India is the largest producer in
the world of milk, jute
and pulses
 second largest cattle
population with 175 million
SERVICES
BANKING AND
FINANCE
 india is 13th in services output
 services sector provides
employment to 23% of the
work force
 growing quickly, with a
growth rate of 7.5%
 7 Indian firms were listed
among the top 15 technology
outsourcing companies in the
world
 Prime Minister Indira
Gandhi nationalized 14 banks
in 1969 + 6 others in 1980
 mandatory for banks to
provide 40% of their net credit
to priority sectors like
agriculture, small-scale
industry, retail trade, small
businesses, etc
 India's gross domestic saving
more then 32.7%.
RETAIL
ENERGY AND
POWER
 Retail industry is one of the
pillars of Indian economy and
accounts for 14–15% of its
GDP
 The Indian retail market is
estimated to be
US$ 450 billion and one of the
top 5 retail markets
 India is one of the fastest
growing retail market
 of India is the 4th largest
producer electricity and oil
products
 fourth largest importer of coal
and crude-oil in the world
 India had an installed power
generation capacity of 185.5
Giga Watts(GW)
Tourism in India is relatively undeveloped, but
a high growth sector
It contributes 6.23% to the national GDP
8.78% of the total employment
The majority of foreign tourists come from
USA and UK
India's rich history and its cultural and
geographical diversity make its international
tourism appeal large and diverse.
 India has the world's third largest road network
covering more than 4.3 million kilometers and
carrying 60% of freight and 87% of passenger traffic
 is the fourth largest rail network in the world, with a
track length of 114,500Km.
 13 major ports handling a cargo volume of 850
million tones
 India has a national teledensity rate of 74.15% with
926.53 million telephone subscribers
Public debt 67.59% of GDP
Budget deficit 5.2% of GDP
Revenues $171.5 billion billion
Expenses $281 billion billion
Economic aid $2.107 billion
Foreign reserves $295.29 billion
Public Sector companies are the
companies that are owned and
operated by the government. The
government level can be national, state
or local. These companies provide
basic government services.
•1960-1980 -
3.5%
• 1980-1990 -
5.4%
•1990-2000 -
4.4%
• 2000-2009 -
6.4%
Contribution of different sectors in
GDP
Below are the contributions of different sectors in the India's GDP for 1990-1991
Agriculture: - 32%
Service Sector: - 41%
Industry: - 27%
Below are the contributions of different sectors in the India's GDP for 2005-2006
Agriculture: - 20%
Service Sector: - 54%
Industry: - 26%
Below are the contributions of different sectors in the India's GDP for 2007-2008
Agriculture: - 17%
Service Sector: - 54%
Industry: - 29%
Fiscal
Deficit.
Aamdani atthanni kharcha
What is fiscal deficit?
 Fiscal deficit is the difference between the government’s
expenditures and its revenues (excluding the money it’s
borrowed). A country’s fiscal deficit is usually communicated as
a percentage of its gross domestic product (GDP).
 Considering that the Indian economy is growing between 5 to
5.5 percent in the financial year ended March 2013, fiscal deficit
is definitely a challenge to the economy. According to the World
Bank, growth in India is projected to rise to 6.5 percent and 6.7
percent in FY2014 and FY2015, respectively.
What are the causes of fiscal deficit?
Some main factors are
 Government spending
 Inflation
 Lower revenue
One way the government earns money, is through taxes. For example, if the
government lowered taxes or provided tax concessions to a particular group of
people, then it would earn less, leading to an increase in fiscal deficit. And that’s
one of the reasons why you will find the government giving a face-lift to the tax
structures. In the same context, cutting of custom duty and excise duty will lead
to declining revenues.
Like India, many developing countries are making an effort to resolve big fiscal
deficits. On the bright side, for India, among other sources of revenue, foreign
investments and inflow of remittance s from Indians living overseas has helped
avoid very high deficits.
Fiscal deficit does not come about only in case of creating less revenue and
spending more money. Another major reason for a growing fiscal deficit can be
slow economic growth or sluggish economic activities.
How fiscal deficit can be bad for India?
 A large fiscal deficit is an indication that the economy is in trouble and will
have reasons to worry.
 A high fiscal deficit could pose an
 Inflation risk,
 Minimize the growth of the economy,
 Doubt the government’s abilities.
 It is believed that high fiscal deficit can be corrected. For example, if the
government could not control its expenditures, it could raise taxes to cover
up for the extra amount of money spent. When taxes increase, consumers
will involuntarily have to cut down on their expenditure to pay the
government.
 Did you know that several government projects are stalled because of
high fiscal deficit? Here’s why. When a country labors under high fiscal
deficit, it limits the government’s spending capacity and this has an effect on
the continuous funds various projects need.
For example,
 Infrastructure projects
 Welfare policies
 Education and healthcare projects, etc.
Why is India’s fiscal deficit continually high?
 While the government fights to manage money, here are a few reasons why
India has a soaring fiscal deficit.
 It is high because in the corporate sector,
 Bailouts are becoming common and
 Subsidies are being high.
 The money that the government earns through non-tax revenue is not big
and
the money it earns from taxes is not enough.
• Meaning
•Types of revenue
•Types of expenditure
•Sectoral analysis
Head In Crore of Rupees
Tax Revenue 8,84,078.32
Non Tax
Revenue
1,72,252.38
Capital Receipts 6,08,966.62
Grand Total 16,65,297.32
Defense
Health
Education
Women & Youth
Agriculture
Banking & Insurance
*Image via Bing
Total allocation Rs 2,03,672 crore
DEFENCE
*Image via Bing
Total allocation
Rs 2,03,672 crore
*Images via Bing
Special focus
on medical
education, trai
ning and
research
New National
Health Mission to
get Rs 21,239
crore
*Image via Bing
Total allocation Rs 65,867 crore
Mid-day meal programme gets Rs 13,215 crore
*Image via Bing
*Images via Bing
SSA gets Rs 27,258 crore
 An all-women bank by November
2013 with an initial capital of Rs
1,000 crore
 Rs 1,000 crore Nirbhaya
Fund, named after Delhi
gangrape victim, to empower
women
*Image via Bing
Special allocation Rs 200
crore
Rs 1,000 crore for skill development of 10 lakh youth to enhance their employability*Image via Bing
Special allocation Rs 1000
crore
*Image via Bing
Total allocation Rs 27,049 crore
Total Allocation Rs 14,000 crore
Definition of 'Private Company'
A company whose ownership is private. As
a result, it does not need to meet the strict
Securities and Exchange Commission
filing requirements of public companies.
Amul
Ambuja Cement
Apollo Tyres
Infosys Technologies Ltd.
Bank Of India
ITC Limited
LIC Insurance
With an Annual GDP growth rate of 7-8
percent India is the one of the fastest
growing economies in the world. This
stable annual GDP growth rate that India is
witnessing is mostly due to the rise of the
major private sector companies in the
country.
 1. Minimum Paid-up Capital : A company to
be Incorporated as a Private Company must
have a minimum paid-up capital of Rs.
1,00,000, whereas a Public Company must
have a minimum paid-up capital of Rs.
5,00,000.
 2. Minimum number of members : Minimum
number of members required to form a
private company is 2, whereas a Public
Company requires atleast 7 members.
3. Maximum number of members :
Maximum number of members in a Private
Company is restricted to 50, there is no
restriction of maximum number of
members in a Public Company.
4. Number of Directors : A Private
Company may have 2 directors to manage
the affairs of the company, whereas a
Public Company must have atleast 3
directors.
5. Shares Warrants : A Private Company
cannot issue Share Warrants against its
fully paid shares, Whereas a Private
Company can issue Share Warrants
against its fully paid up shares.
6. Special privileges : A Private Company
enjoys some special privileges, which are
not available to a Public Company.
Contribution of
Genetic, Extraction, Manufacturing, Constru
ction and Commerce Industries
 It is an industry that involves activities in reproducing and multiplying
certain species of plants and animals for the sake of earning profit from
their sale.
 It is going to be India’s leading industrial sector in future.
 Fish culture,Cattle breeding, goatery and piggery are included in genetic
industry.
 There are 325 major companies working in this sector in India.
 Some of the top companies are – Mahyco, Metahelix life sciences ltd.,Bio
Con,Panacea Piramal,Nicholes Piramal.
 The growth rate of the sector is 3% to 4% annually.
 The total revenue generated annually is around 2 billion US dollars.
This industry involves in activities like mining, quarrying, digging of oil
wells and gas reservoirs.
 India is one of the most important market for petroleum products and crude
oil.
 This industry is attracting attention of many international players.
 The major companies in this field are – ESSAR Oil Ltd, Mazagaon Dock
Ltd, Reliance Industries Ltd.,JK Industries, Oil India.
 Revenue generated by this industry in the year 2012-13 is Rupees 4 lakhs
crores.
 The growth rate of this industry in India is 4.1 % in 2012-13.
 This industry has a very good job potential.
 Manufacturing industry involves the use of tools and processes to transfer
raw materials into finished goods i.e goods from shoes to ships.
 India has a large and diversifies manufacturing basis.
 Thus India’s manufacture sector has a very huge potential.
 Government of India has announced many policies and reforms in
manufacturing industry
 It is a labour intensive industry and many multinational players are there in
Indian manufacturing industries.
 Some of the major manufacturing companies are – Tata
motors, L&T, Maruti Suzuki and SAIL, ITC Ltd.
 Revenue generated by this sector in 2013 is 13.8 billion dollars.
 Growth rate of this industry in India is 50.1 % in the year 2013.
 This industry has many associated sectors i.e. from dam – to- flyovers -to
– airport construction
 It is a very important indicator of economical development of the nation
 Leading companies in this sector are – Unity Infra Projects Ltd, Pratibha
Industries, Shapoorji and Paloonji, UB Construction, Godrej Real
Estate, P.D.Construction.
 Revenue generated in the year 2013 is Rupees 670,778 crores.
 More than 35 million people are employed in this industry.
 Growth rate of this industry in India 20% in may 2013.
 More than 500 construction equipment manufacturing companies are
dependent on this industry.
 Commerce is a process in which businesses and individuals take part
in exchange of goods and services in exchange for money.
 It has two main parts – Trade services and Ancillary services.
 Trade takes place between producer and consumer . There is a trade
at national level and international level.
 Ancillary services are those that are supportive services and
secondary services.
 Major companies in trade are – India Trading Company, Geojit
Trading Company .Shakti Traders.
 Major ancillary services are – LIC, Stock Exchange, Ghai Finance.
 Total revenue generation in trade in year 2013 is Rupees 23,277
crores. The growth rate is 6.1 %.
 Total revenue generation in ancillary services in 2013 is 11,012
crores . The growth rate is 2,98%.
 India’s exports reversed the trend in
October, 2009 by registering a positive growth
of 3.4%. The upward trend has been
maintained since then wherein exports grew at
the rate of 30.0 % in 3.4%
 On a cumulative basis, merchandise exports
stood at US$ 300.6 billion, declining by 1.8
percent, in FY 2012-13 as compared to the
export of US$306.0 billion in FY 2011-12 (21.8
per cent)
 Merchandise imports in the FY 2012-13 recorded
a marginal growth of 0.4 per cent amounting to
US$ 491.5 billion compared to a growth rate of
32.3 percent at US$ 489.3 billion.
 The decline was mainly led by a fall in gold and
non-oil non-gold imports. Fall in non-oil non-gold
was more on account of a slowdown in domestic
activity and dampened demand for export related
items.
0
50
100
150
200
250
300
350
400
450
500
EXPORTS
IMPORTS
 India should reduce their imports & increase their
exports. As there is trade deficit in India.
 This can only be done when the government will
change their policies & they should not be depend
only on the product which is exported from other
countries.
 India have most of their imports from & exports to
Asia & ASEAN countries.
India as business enterprise

India as business enterprise

  • 1.
    Presented by – SonuGupta Amol Dhurde Nikita Das Rohan Kulkarni Ankita Walke Bharat Singh Sumesh Parkar
  • 3.
    Geographical area 32,87,240(7th)  Population 121,01,93,422(2nd) GDP rate $4.711 trillion (3rd)(PPP) $1.947 trillion (10th)(nominal)
  • 7.
    private consumption + grossinvestment + government spending + (exports − imports)
  • 8.
  • 9.
  • 10.
    BY SECTOR BYLABOR FORCE 17% 27%56% Sales agriculture industry services 52% 17% 27% 4% Sales agriculture industry services unempioy ment
  • 11.
  • 12.
    INDUSTRY AND SERVICES MINING Industry accounts for 28% of the GDP  employs 14% of the total workforce  India is 11th in the world in terms of nominal factory output  Mining forms an important segment of the Indian economy.  producing 79 different minerals  Such as Ironore, manganese, mica, bau xite, chromite, silica limestone, asbestos fluorite, etc .
  • 13.
    TEXTILE AGRICULTURE  Textilemanufacturing largest source of employment after agriculture  accounts for 20% of manufacturing output, providing employment to over 20 million people  But demand for Indian textiles in world markets continues to fall.  India ranks 2nd worldwide in farm output  Agriculture and allied sectors accounted for 14.0% of the GDP  employed 58.00%  India is the largest producer in the world of milk, jute and pulses  second largest cattle population with 175 million
  • 14.
    SERVICES BANKING AND FINANCE  indiais 13th in services output  services sector provides employment to 23% of the work force  growing quickly, with a growth rate of 7.5%  7 Indian firms were listed among the top 15 technology outsourcing companies in the world  Prime Minister Indira Gandhi nationalized 14 banks in 1969 + 6 others in 1980  mandatory for banks to provide 40% of their net credit to priority sectors like agriculture, small-scale industry, retail trade, small businesses, etc  India's gross domestic saving more then 32.7%.
  • 15.
    RETAIL ENERGY AND POWER  Retailindustry is one of the pillars of Indian economy and accounts for 14–15% of its GDP  The Indian retail market is estimated to be US$ 450 billion and one of the top 5 retail markets  India is one of the fastest growing retail market  of India is the 4th largest producer electricity and oil products  fourth largest importer of coal and crude-oil in the world  India had an installed power generation capacity of 185.5 Giga Watts(GW)
  • 16.
    Tourism in Indiais relatively undeveloped, but a high growth sector It contributes 6.23% to the national GDP 8.78% of the total employment The majority of foreign tourists come from USA and UK India's rich history and its cultural and geographical diversity make its international tourism appeal large and diverse.
  • 17.
     India hasthe world's third largest road network covering more than 4.3 million kilometers and carrying 60% of freight and 87% of passenger traffic  is the fourth largest rail network in the world, with a track length of 114,500Km.  13 major ports handling a cargo volume of 850 million tones  India has a national teledensity rate of 74.15% with 926.53 million telephone subscribers
  • 18.
    Public debt 67.59%of GDP Budget deficit 5.2% of GDP Revenues $171.5 billion billion Expenses $281 billion billion Economic aid $2.107 billion Foreign reserves $295.29 billion
  • 19.
    Public Sector companiesare the companies that are owned and operated by the government. The government level can be national, state or local. These companies provide basic government services.
  • 20.
    •1960-1980 - 3.5% • 1980-1990- 5.4% •1990-2000 - 4.4% • 2000-2009 - 6.4%
  • 21.
    Contribution of differentsectors in GDP Below are the contributions of different sectors in the India's GDP for 1990-1991 Agriculture: - 32% Service Sector: - 41% Industry: - 27% Below are the contributions of different sectors in the India's GDP for 2005-2006 Agriculture: - 20% Service Sector: - 54% Industry: - 26% Below are the contributions of different sectors in the India's GDP for 2007-2008 Agriculture: - 17% Service Sector: - 54% Industry: - 29%
  • 22.
  • 23.
    What is fiscaldeficit?  Fiscal deficit is the difference between the government’s expenditures and its revenues (excluding the money it’s borrowed). A country’s fiscal deficit is usually communicated as a percentage of its gross domestic product (GDP).  Considering that the Indian economy is growing between 5 to 5.5 percent in the financial year ended March 2013, fiscal deficit is definitely a challenge to the economy. According to the World Bank, growth in India is projected to rise to 6.5 percent and 6.7 percent in FY2014 and FY2015, respectively.
  • 24.
    What are thecauses of fiscal deficit? Some main factors are  Government spending  Inflation  Lower revenue One way the government earns money, is through taxes. For example, if the government lowered taxes or provided tax concessions to a particular group of people, then it would earn less, leading to an increase in fiscal deficit. And that’s one of the reasons why you will find the government giving a face-lift to the tax structures. In the same context, cutting of custom duty and excise duty will lead to declining revenues. Like India, many developing countries are making an effort to resolve big fiscal deficits. On the bright side, for India, among other sources of revenue, foreign investments and inflow of remittance s from Indians living overseas has helped avoid very high deficits. Fiscal deficit does not come about only in case of creating less revenue and spending more money. Another major reason for a growing fiscal deficit can be slow economic growth or sluggish economic activities.
  • 25.
    How fiscal deficitcan be bad for India?  A large fiscal deficit is an indication that the economy is in trouble and will have reasons to worry.  A high fiscal deficit could pose an  Inflation risk,  Minimize the growth of the economy,  Doubt the government’s abilities.  It is believed that high fiscal deficit can be corrected. For example, if the government could not control its expenditures, it could raise taxes to cover up for the extra amount of money spent. When taxes increase, consumers will involuntarily have to cut down on their expenditure to pay the government.  Did you know that several government projects are stalled because of high fiscal deficit? Here’s why. When a country labors under high fiscal deficit, it limits the government’s spending capacity and this has an effect on the continuous funds various projects need. For example,  Infrastructure projects  Welfare policies  Education and healthcare projects, etc.
  • 26.
    Why is India’sfiscal deficit continually high?  While the government fights to manage money, here are a few reasons why India has a soaring fiscal deficit.  It is high because in the corporate sector,  Bailouts are becoming common and  Subsidies are being high.  The money that the government earns through non-tax revenue is not big and the money it earns from taxes is not enough.
  • 27.
    • Meaning •Types ofrevenue •Types of expenditure •Sectoral analysis
  • 28.
    Head In Croreof Rupees Tax Revenue 8,84,078.32 Non Tax Revenue 1,72,252.38 Capital Receipts 6,08,966.62 Grand Total 16,65,297.32
  • 29.
  • 30.
    *Image via Bing Totalallocation Rs 2,03,672 crore DEFENCE
  • 31.
    *Image via Bing Totalallocation Rs 2,03,672 crore
  • 32.
    *Images via Bing Specialfocus on medical education, trai ning and research New National Health Mission to get Rs 21,239 crore
  • 33.
    *Image via Bing Totalallocation Rs 65,867 crore
  • 34.
    Mid-day meal programmegets Rs 13,215 crore *Image via Bing *Images via Bing SSA gets Rs 27,258 crore
  • 35.
     An all-womenbank by November 2013 with an initial capital of Rs 1,000 crore  Rs 1,000 crore Nirbhaya Fund, named after Delhi gangrape victim, to empower women *Image via Bing Special allocation Rs 200 crore
  • 36.
    Rs 1,000 crorefor skill development of 10 lakh youth to enhance their employability*Image via Bing Special allocation Rs 1000 crore
  • 37.
    *Image via Bing Totalallocation Rs 27,049 crore
  • 38.
    Total Allocation Rs14,000 crore
  • 39.
    Definition of 'PrivateCompany' A company whose ownership is private. As a result, it does not need to meet the strict Securities and Exchange Commission filing requirements of public companies.
  • 40.
    Amul Ambuja Cement Apollo Tyres InfosysTechnologies Ltd. Bank Of India ITC Limited LIC Insurance
  • 45.
    With an AnnualGDP growth rate of 7-8 percent India is the one of the fastest growing economies in the world. This stable annual GDP growth rate that India is witnessing is mostly due to the rise of the major private sector companies in the country.
  • 46.
     1. MinimumPaid-up Capital : A company to be Incorporated as a Private Company must have a minimum paid-up capital of Rs. 1,00,000, whereas a Public Company must have a minimum paid-up capital of Rs. 5,00,000.  2. Minimum number of members : Minimum number of members required to form a private company is 2, whereas a Public Company requires atleast 7 members.
  • 47.
    3. Maximum numberof members : Maximum number of members in a Private Company is restricted to 50, there is no restriction of maximum number of members in a Public Company. 4. Number of Directors : A Private Company may have 2 directors to manage the affairs of the company, whereas a Public Company must have atleast 3 directors.
  • 48.
    5. Shares Warrants: A Private Company cannot issue Share Warrants against its fully paid shares, Whereas a Private Company can issue Share Warrants against its fully paid up shares. 6. Special privileges : A Private Company enjoys some special privileges, which are not available to a Public Company.
  • 49.
    Contribution of Genetic, Extraction,Manufacturing, Constru ction and Commerce Industries
  • 50.
     It isan industry that involves activities in reproducing and multiplying certain species of plants and animals for the sake of earning profit from their sale.  It is going to be India’s leading industrial sector in future.  Fish culture,Cattle breeding, goatery and piggery are included in genetic industry.  There are 325 major companies working in this sector in India.  Some of the top companies are – Mahyco, Metahelix life sciences ltd.,Bio Con,Panacea Piramal,Nicholes Piramal.  The growth rate of the sector is 3% to 4% annually.  The total revenue generated annually is around 2 billion US dollars.
  • 51.
    This industry involvesin activities like mining, quarrying, digging of oil wells and gas reservoirs.  India is one of the most important market for petroleum products and crude oil.  This industry is attracting attention of many international players.  The major companies in this field are – ESSAR Oil Ltd, Mazagaon Dock Ltd, Reliance Industries Ltd.,JK Industries, Oil India.  Revenue generated by this industry in the year 2012-13 is Rupees 4 lakhs crores.  The growth rate of this industry in India is 4.1 % in 2012-13.  This industry has a very good job potential.
  • 52.
     Manufacturing industryinvolves the use of tools and processes to transfer raw materials into finished goods i.e goods from shoes to ships.  India has a large and diversifies manufacturing basis.  Thus India’s manufacture sector has a very huge potential.  Government of India has announced many policies and reforms in manufacturing industry  It is a labour intensive industry and many multinational players are there in Indian manufacturing industries.  Some of the major manufacturing companies are – Tata motors, L&T, Maruti Suzuki and SAIL, ITC Ltd.  Revenue generated by this sector in 2013 is 13.8 billion dollars.  Growth rate of this industry in India is 50.1 % in the year 2013.
  • 53.
     This industryhas many associated sectors i.e. from dam – to- flyovers -to – airport construction  It is a very important indicator of economical development of the nation  Leading companies in this sector are – Unity Infra Projects Ltd, Pratibha Industries, Shapoorji and Paloonji, UB Construction, Godrej Real Estate, P.D.Construction.  Revenue generated in the year 2013 is Rupees 670,778 crores.  More than 35 million people are employed in this industry.  Growth rate of this industry in India 20% in may 2013.  More than 500 construction equipment manufacturing companies are dependent on this industry.
  • 54.
     Commerce isa process in which businesses and individuals take part in exchange of goods and services in exchange for money.  It has two main parts – Trade services and Ancillary services.  Trade takes place between producer and consumer . There is a trade at national level and international level.  Ancillary services are those that are supportive services and secondary services.  Major companies in trade are – India Trading Company, Geojit Trading Company .Shakti Traders.  Major ancillary services are – LIC, Stock Exchange, Ghai Finance.  Total revenue generation in trade in year 2013 is Rupees 23,277 crores. The growth rate is 6.1 %.  Total revenue generation in ancillary services in 2013 is 11,012 crores . The growth rate is 2,98%.
  • 56.
     India’s exportsreversed the trend in October, 2009 by registering a positive growth of 3.4%. The upward trend has been maintained since then wherein exports grew at the rate of 30.0 % in 3.4%  On a cumulative basis, merchandise exports stood at US$ 300.6 billion, declining by 1.8 percent, in FY 2012-13 as compared to the export of US$306.0 billion in FY 2011-12 (21.8 per cent)
  • 59.
     Merchandise importsin the FY 2012-13 recorded a marginal growth of 0.4 per cent amounting to US$ 491.5 billion compared to a growth rate of 32.3 percent at US$ 489.3 billion.  The decline was mainly led by a fall in gold and non-oil non-gold imports. Fall in non-oil non-gold was more on account of a slowdown in domestic activity and dampened demand for export related items.
  • 61.
  • 62.
     India shouldreduce their imports & increase their exports. As there is trade deficit in India.  This can only be done when the government will change their policies & they should not be depend only on the product which is exported from other countries.  India have most of their imports from & exports to Asia & ASEAN countries.

Editor's Notes

  • #37 Total allocation Rs1,000 crore
  • #39 Banking and Insurance