Six Wisconsin school districts that adopted the Common Core State Standards for Mathematics and used the educational resource ORIGO Stepping Stones saw increases in the percentage of 4th grade students with advanced and proficient mathematics skills over three years. The largest increase was seen in the Muskego-Norway School District, which realized a 13% gain. On average, the six districts saw a 7% increase, more than tripling the statewide average increase of 2%. The findings suggest that by combining passionate teachers, the Common Core standards, and high-quality educational resources like ORIGO Stepping Stones, student performance in mathematics can be improved.
A Guide for School Districts: Exploring Alternative Measures of Student Learn...Tanya Paperny
Districts across the country play a crucial role in ensuring schools effectively serve students and families. Beyond federal requirements in the Every Student Succeeds Act and state-level accountability systems, locally developed school performance frameworks are a key lever for holding schools accountable, particularly for student learning and wellness.
Today — with unfamiliar school configurations and unknown impacts on student outcomes — it is more important than ever that districts are diligent about assessing schools’ impact on students. But the ways that districts have done so in the past may no longer be appropriate. And districts that previously did not engage in school-level performance assessments now have a new incentive to do so.
This toolkit is a resource to help districts adapt existing school performance frameworks to the current moment or create new ones. These slides identify and walk through the fundamental questions districts need to consider in designing school performance frameworks that acknowledge the challenges that schools and students are facing, as well as a continued need to monitor performance and continuously improve.
Autonomous District Schools: Lessons From the Field on a Promising StrategyJeremy Knight
Autonomous district schools (sometimes called “in-district charters”) use some of the same freedoms that public charter schools enjoy while remaining part of the district. Enabled by innovative policies that support school-level autonomy, Springfield, Massachusetts; Indianapolis, Indiana; Denver, Colorado; and San Antonio, Texas, are experimenting with these types of schools. While these efforts are too new to have clear student impact data, autonomous district schools could be a promising strategy to improve districts’ ability to meet families’ and students’ needs and to improve outcomes.
“Autonomous District Schools: Lessons From the Field on a Promising Strategy” summarizes Bellwether’s work with San Antonio Independent School District (SAISD) over the past 18 months. The district has authorized three networks of autonomous district schools using a law that supports and incentivizes the creation of these schools. Bellwether provided program design support, strategic advice, and capacity building to SAISD’s Network Principal Initiative, and this deck offers an overview of the initiative and the lessons we learned about the launch of autonomous district schools.
This slide deck is accompanied by a tool kit, “Autonomous District Schools: Tools for Planning and Launching,” which offers concrete resources for leaders interested in planning an autonomous school or network.
Charter schools currently serve 3 million students in more than 7,000 schools across 44 states and Washington, D.C. And their reach continues to grow: Since 2005, the number of charter schools in the U.S. has nearly doubled, and the number of charter students has nearly tripled.
Despite being an enduring presence in the nation’s education space, charter schools remain a topic of ongoing debate. The State of the Charter Sector provides the latest available information on charter schools across the country, including updated data on growth, performance, and geographic trends. It also includes analyses of the challenges that charter schools face and how the sector is trying to address them.
This comprehensive slide deck updates our 2015 State of the Charter School Movement, and together, these resources serve as a fact base to cut through the rhetoric that often accompanies conversations about charter schools.
The goal of this analysis is not to persuade, but to inform. As the charter sector continues to grow and improve, it needs a rigorous, evidence-based debate around its weaknesses and strengths. Accurate information is crucial for thoughtful policymaking and, ultimately, to ensuring all students have access to a high-quality education.
Toward Equitable Access and Affordability: How Private Schools and Microschoo...Jeremy Knight
In recent decades, tuition increases in independent schools have outpaced inflation and wage growth, while thousands of Catholic parochial schools — which historically have provided private education at a much lower cost — have closed, leaving middle- and low-income families with few affordable options.
Meanwhile, families across socioeconomic groups express interest in private schooling. While private schools consistently serve about 10% of U.S. students, 40% of parents say they would prefer private schools. These trends suggest a need to look more closely at efforts to increase affordability in private schools and ensure that all families have equitable access to the schools of their choice.
In “Toward Equitable Access and Affordability: How Private Schools and Microschools Seek to Serve Middle- and Low-Income Students,” we sought to understand the landscape of private schools working to provide an affordable education by looking at the approaches they are taking and how they are revisiting traditional operating models. We profile a variety of strategies used by schools to improve access for middle- and low-income families. Some schools rely on reducing the costs to families (i.e., tuition) by providing significant financial aid or partnering with scholarship programs, some have found inventive new revenue streams, and some have streamlined operations and leveraged technology to reduce their per-pupil expenditures.
One category of private schools, the microschool, merited a closer look due to its profoundly different operational and financial model. Through surveys and interviews with microschool leaders and experts around the country, this report seeks to further define this emerging sector of intentionally small, educationally innovative schools and to explore their potential as an affordable independent school option.
Ultimately, this overview of low-cost private schools and microschools surfaced questions about improving equity in private education. The profiles of schools aiming to serve middle- and low-income families highlight unsolved puzzles about how to balance that mission with financial sustainability. The analysis also raises questions about the role of private schools in serving families with more limited means, and about the potential of low-cost models to scale and innovate. Further exploration of these questions is essential to ensuring that in the private sector as well as the public sector, all families have equal access to high-quality options.
The Challenges and Opportunities in School Transportation TodayJeremy Knight
Every day, America’s fleet of roughly 480,000 school buses transports more than a third of students to and from school. This fleet is more than twice the size of all other forms of mass transit combined, including bus, rail, and airline transportation.
Educational publishers need to leverage learning management systems to deliver unique content and services for the fast-growing outcome-based education market.
COVID-19 and Disruption in Management and Education Academics: Bibliometric M...faisalpiliang1
COVID-19, What to do now? This issue has had devastating effects in all domains of society
worldwide. Lockdowns, the lack of freedom and social distancing meant the closure of a country’s
entire activity. Having effects at all levels, beside incalculable ones in health, it is argued that scientific
activity in education, business, economics and management suffered some of the most drastic impacts
of this pandemic. This study aims to map the scientific literature in these areas in the context of
COVID-19 and analyze its content through bibliometrics, which made it possible to highlight the
scarcity of studies on the topic, namely empirical studies on the effects of this pandemic on scientific
research and teaching/education. The results show there is a lack of peer-reviewed publications on
this topic, with the studies covered (93) via the threads used revealing only 28 articles coming within
the proposed objective. The bibliometrics corroborates that shortage. Finally, the contributions and
implications for theory and practice are presented, followed by the limitations and suggestions for
future research.
Moving Toward Sustainability: Kansas City Teacher ResidencyJeremy Knight
Kansas City Teacher Residency (KCTR) is a teacher residency program that recruits, certifies, and develops teachers in the Kansas city region. Launched in 2016, by Ewing Marion Kauffman Foundation, KCTR has established a high-quality and diverse teacher preparatory program for Kansas City. In late 2018, Bellwether partnered with KCTR and Kauffman Foundation to redesign KCTR's program model to bring it in line with peer benchmarks and ensure long-term impact and sustainability. Over six months, Bellwether, in collaboration with KCTR's senior leadership team, Board, and key advisers, developed and began to implement a plan to put KCTR on a path to organizational and financial sustainability (initial changes significantly reduced the ongoing fundraising need). Key priorities identified in the plan included strengthening partnerships (with schools and university), optimizing KCTR expenditures, exploring new earned-revenue opportunities, and gradually growing the number of residents to full-scale. With the new plan, KCTR is prepared to continue the growth of impact while doing so in a sustainable manner, to ultimately fuel Kansas City with passionate, effective, and diverse educators.
Helping students navigate an interconnected world — What to expect from PISA ...EduSkills OECD
Today’s students live in an interconnected, diverse and rapidly changing world. In this complex environment, a student’s ability to understand the world and appreciate the multiple different perspectives they are likely to encounter is key to their success.
In 2018, the OECD Programme for International Student Assessment (PISA) conducted its first evaluation of students’ capacity to live in an interconnected world. The assessment focused on students’ knowledge of issues of local and global significance, including public health, economic and environmental issues, as well as their intercultural knowledge, skills and attitudes. The results of this assessment – PISA 2018 Volume VI – will be launched on 22 October.
Want to get a head start on what this latest Volume is all about? Andreas Schleicher, OECD Director for Education and Skills, unveils the main themes addressed in Volume VI and what to expect from the data.
Learning loss and learning inequalities during the Covid-19 pandemic: an anal...Christian Bokhove
For the report see https://www.southampton.ac.uk/publicpolicy/covid19/learning-inequalities-covid-19.page
For a recording of the talk see: https://login.microsoftonline.com/common/oauth2/authorize?client_id=cf53fce8-def6-4aeb-8d30-b158e7b1cf83&response_mode=form_post&response_type=code+id_token&scope=openid+profile&state=OpenIdConnect.AuthenticationProperties%3dAQAAAAIAAAAJLnJlZGlyZWN0YWh0dHBzOi8vd2ViLm1pY3Jvc29mdHN0cmVhbS5jb20vdmlkZW8vZjQzMTlhOGItNjI3ZC00MjVmLTkxNzgtNjUxNmJiMjRjNjA2P3JlZmVycmVyPWh0dHBzOi8vdC5jby8Ibm9uY2VLZXmbAWI3NThsQVZjX0dBV1l3elM1M1E4aUNMeklxeEhGck0yWlpFdjFKOW9DZDBfdHZURHZUVmFkcXJmNEF1YXBFeW9vc2JaSlVfSEFZeGRvaTB4Znpha3hlLURfNmFTR3VMb2tnVm55QjRjTU40TzctbnU5WFlvYU5YaS00LThocjhubFh6LWxXejRZelFSOTZSZ2hXTzY3VjlOS2tF&nonce=637623831282885943.OTE1YmY1ZGMtMmNlZC00MTAyLWFkN2ItNDBjMDQ0N2YzNWIxYzQ2ODYxMTMtNjkyOC00MjMxLWI3M2QtOTg2MjY5NDU1NTMz&nonceKey=OpenIdConnect.nonce.7YqZnnSsGsmDUjch5zMsEl3cEhi9f8LQh3pftMQ0ZWU%3d&site_id=500453&redirect_uri=https%3a%2f%2fweb.microsoftstream.com%2f&post_logout_redirect_uri=https%3a%2f%2fproducts.office.com%2fmicrosoft-stream&msafed=0&prompt=none
após análises quase antropológicas de ambientes como: baladas,bares, restaurantes que estão em alta e nossa própria vida, foi impossível não fazer uma reflexão sobre: O MARAVILHOSO MUNDO DO INSTAGRAM.
Chapter 5Understanding the Standards And I’m calling.docxjoyjonna282
Chapter 5
Understanding the Standards
And I’m calling
on our nation’s
governors and state
education chiefs to
develop standards
and assessments
that don’t simply
measure whether
students can fill
in a bubble on a
test, but whether
they possess 21st
century skills like
problem solving and
critical thinking and
entrepreneurship
and creativity.
—Barack Obama,
March 1, 2009
Learning Outcomes
By the end of the chapter, you will be able to:
• Explain the development of the Common Core standards movement.
•Describe the basic elements of the Common Core English language arts standards.
•Discuss the basic elements of the Common Core mathematics standards.
•Recall the basic elements of the Next Generation Science Standards and the National
Educational Technology Standards.
•Analyze how differentiated instruction applies to the newly emerging standards and the
technology standards for students.
5
iStockphoto/Thinkstock
Pre-Test Chapter 5
Introduction
Differentiated instruction is built on a foundation of effective teaching practices. Quality cur-
riculum is one of these defining principles, as what is taught serves as the basis for how it is
taught. Quality curriculum has its basis in standards, or descriptions of student outcomes in
content areas. The standards in the United States are undergoing major changes with the adop-
tion of the Common Core State Standards and new standards in science and social studies.
Initially developed by a consortium of state governors and state superintendents of instruction,
they have been vetted by professional groups, state and local education representatives, and
parents within each state.
These standards mark a departure from past practices, which is good news for differentiated
instruction. States had previously been responsible for developing their own standards, and
the creation of assessment systems based on those standards immediately followed. While this
approach assured an articulation between standards and assessment, there were unintended
consequences. The effect was a narrowing of the curriculum. In practice, the assessment sys-
tems began to drive the curriculum and often resulted in teaching methods that were drill
based, had low cognitive demand, used bubble-in-the-answer assessments, and relied on a
stand-and-deliver means of presenting content. (Kendall, 2011). The new standards aim to rec-
tify that approach. They describe student outcomes in terms of college and career readiness,
and encourage increasingly complex cognitive tasks throughout the K-12 experience. Moreover,
the manner in which they were written and adopted has encouraged districts and teachers to
develop curriculum first, rather than waiting until an assessment system is in place (Kendall,
2011). Since their release, the authors of the standards have vetted a number of resources that
assist teachers, parents, and community members in understanding and planning for imple-
mentation ...
Presentation made at the Hawaii International Conference on Education, 2015. Explains why and how college faculty should align with the Common Core and NGSS.
10 Things You Should Know About the Common Corene atoday.o.docxpaynetawnya
10 Things You Should Know About the Common Core
ne atoday.org /2013/10/16/10-things-you-should-know-about-the-common-core/
October 16, 2013 by twalker
Filed under ,
By Tim Walker
An enormous effort to implement the Common Core State
Standards (CCSS) is underway in more than 40 states and the
District of Columbia. Districts are training staff, field-testing
assessments, and evaluating technology requirements.
Teachers are rewriting curriculum and instruction to prepare
students for more rigorous coursework. Some states are further
ahead than others. And as the 2014 – 2015 implementation
deadline draws near, it’s likely that the road has been—and will
continue to be—a bit rocky. But schools are forging ahead with
the initiative—even as it faces opponents who are determined to
mislabel the effort as everything from “Obamacore” to a
“national curriculum.” The Common Core is a set of voluntary
K–12 standards in English language arts/literacy and
mathematics. The White House did not create the initiative, nor is it leading it. The standards were developed by
governors and state school officials, with input from a wide range of educators, content experts, national
organizations (including NEA), and community groups.
The challenges surrounding implementation, however, are formidable. Teachers are concerned about adapting
their classrooms to the rigorous new standards and receiving the proper training. Many are also wondering about
the role of new assessments. But they also recognize the enormous opportunity that lies ahead.
“Educators desperately want to reclaim the joy in teaching—which means creative lesson plans, meaningful
exploration of topics, and inspiring the joy of real learning in our students,” says NEA President Dennis Van Roekel.
“Common Core could help achieve that if the implementation is done correctly.”
To reach that goal, all stakeholders must work together and take a leadership role in educating each other and the
general public about the Common Core. It’s a complex subject. The following facts are intended to clarify key
points, allay concerns about what the Common Core isn’t, and—most importantly—highlight how the standards
can be the game -change r stude nts ne e d.
1. M ost NEA M e mbe rs Support the Common Core
Are many teachers anxious about the Common Core? Absolutely. Are some die-hard
critics? No doubt. But there is no massive groundswell of opposition to the Common
Core among NEA members. An NEA poll conducte d in July by Gre e nbe rg Quinlan
Rosne r Re se arch found that 75 percent of its members—teachers and education
support professionals —supported the standards outright or supported “with
reservations.” Whether it’s tighter content focus or opportunities for deeper critical
thinking, the majority of teachers see the new standards as something to get excited
about. Another poll released by the American Federation of Teachers revealed similar
levels of enthusiasm, again i ...
Overview of the Common Core State Standards Initiatives for EL.docxgerardkortney
Overview of the Common Core State Standards Initiatives for ELLs
A TESOL Issue Brief
March 2013
Overview of the
Common Core State
Standards Initiatives for ELLs
Overview of the Common Core State Standards Initiatives for ELLs
A new chapter in the era of standards-based education in the United States began with the creation of the Common Core State Standards (CCSS) initiative in 2009. Although states
have been required by law to have content-area standards for education since the 1990s, the
CCSS initiative will create more commonality among content-area standards for those states
that have agreed to adopt the CCSS.
At the time of their initial publication, the CCSS did not include a correlating set of English
language proficiency development (ELPD) standards for students learning English. Since then,
several related initiatives that address the role of English language proficiency have been
started. The purpose of this issue brief is to provide a comprehensive overview of the policies
behind the CCSS and to outline some of the initiatives now in place to address the needs of
English language learners (ELLs) in relation to the CCSS.
The 1983 report “A Nation at Risk: The Imperative for Educational Reform” ushered in
the standards movement in education in the United States. Written by the Commission
on Excellence in Education, the report decried a steady decline in student performance.
Recognizing that the education system represented a patchwork of expectations for
students, proponents of the standards movement pushed for more coherent policies.
For the first time, the federal government lent its support to standards-based reform in
education. A wave of reforms followed, incorporating their way into reauthorizations of
the Elementary and Secondary Education Act in 1994 (the Improving America’s Schools
Act) and in 2001 (the No Child Left Behind Act or NCLB). Although NCLB is credited with
unveiling large disparities in educational outcomes among and within states, the law as
written did not produce the results it intended, namely to raise proficiency levels for all.
Also, beginning in 1997 the Organization for Economic Co-operation and Development
(OECD) developed and administered international tests allowing countries to compare the
performance of their students against an international benchmark. Although the best students
in the United States have consistently scored among the highest performing international
students, those experiencing difficulty in school and living in poverty have scored consistently
lower than their international peers, keeping the overall performance of the United States
at or below average among countries participating in those assessments. This persistent
achievement gap within U.S. schools has also motivated proponents of standards-based
education.
Many argue that for the United States to be competitive in today’s global economy, students
in U.S. schools must lead in educational.
All Students Can Learn And Should Be Presented The Opportunity To Learnnoblex1
The current reform movement in the United States began in the 1990s and has manifested itself as a standards movement. It is a movement to establish state and national frameworks, to which local school districts are encouraged to link their efforts to implement local standards. The linchpin that holds together the standards framework is that they are rigorous; voluntary, in that states and localities decide whether or not to use them; and flexible, in that states and localities can decide which strategies are best for their own schools.
Today, virtually every state in the nation has gone about the business of articulating standards, revising curricular offerings, and developing assessments to measure whether the standards are being met. At the national level, initiatives by the federal government and national organizations have been joined in an effort to produce a comprehensive and coherent standards movement. Currently, many national professional organizations have developed or are in the process of developing national standards for their particular subject areas. States have connected to these efforts on numerous fronts.
The current movement has focused primarily on three types of standards: 1) content or curriculum standards; 2) performance or accountability standards; and 3) capacity or delivery standards (also referred to as opportunity-to-learn standards). The three types of standards are linked - one will not succeed without the other two.
The purpose of this paper is four-fold: First, we define "students of diverse needs and cultures" and the "standards movement." Second, we address specific initiatives of current reform efforts in progress in mathematics and science education. Third, we discuss critical issues related to the successful implementation of mathematics and science standards (i.e., teachers professional development, technological advancements, opportunity-to-learn standards, school organization, and assessments.) Fourth, we suggest references to be used as curriculum materials, how-to articles of use to teachers in the classroom, and seminal research and philosophical literature related to mathematics and science reform initiatives.
Who Are Students of Diverse Needs and Cultures?
American society has haltingly come to understand itself as being culturally diverse and pluralistic. Schools, public schools in particular, mirror what our society will look like in the 21st Century. The culture of schools and the capacity of teachers to implement standards and other initiatives are indispensable elements in the effort to reform mathematics and science education.
Source: https://ebookschoice.com/all-students-can-learn-and-should-be-presented-the-opportunity-to-learn/
A CLOSE READING AND ANALYSIS OF THE NEW YORK STATE COMPUTER SCIENCE LEARNING ...IJITE
In this paper, we perform a close reading of the New York State Computer Science/Digital Fluency Learning Standards document to determine its coherence and areas of incoherence and disconnection. This investigation, which utilizes content/discourse and textual analysis tools and methods from the tidytext tools developed for the R programming language, sought to understand the structure of the document itself, as well as the types and patterns of the language used in this document by analyzing word frequencies and networks of terms (engrams). The findings indicate a coherence across document in terms of its articulate of key ideas and principles of computer science and digital fluency. The findings describe an incoherence/disconnection between that the language used to articulate high level goals and objectives articulated in the executive summary of the standards document, such as interdisciplinarity, addressing the learning needs of all students, and equity of access, is mostly absent from the articulation of the standards themselves. In addition, the language used in the standards heavily addressed Bloom’s lower level thinking skills (such as identify, discuss, and explain) and less so Bloom’s high level thinking skills (such as design, create, and analyze). Implications for teacher education and curriculum design are addressed. Implications for teacher education and professional development in the development of rich curricular experiences in computer science and digital fluency are discussed.
SIRCDSociety for Reÿearchn Child Developmentsharin.docxedgar6wallace88877
SIR
CD
Society for Reÿearch
n Child Development
sharing child and youth development knowledge
volume 28, number 2
2014
I Social Policy Report
Common Core
Development and Substance
David T. Conley
University of Oregon
Abstract
his poticy report provides an overview of the Common Core State
Standards, how they were developed, the sources that were ref-
erenced in their development, the need for educationa[ standards
generatty, what they entail, and what it wit[ mean for educators
to imptement them. The report draws from research and refer-
ence materia[ to outtine the argument for the Common Core and the sources
used in its development. These inctude cortege and career readiness standards
developed over the past 15 years, high quality state standards, and the con-
tent spec]fications from other nations whose educationa[ systems are widety
respected. Additiona[ research demonstrates the retationship between the
Common Core and co[[ege and career readiness. While this report does offer
insight into the structure of the standards, most of the information presented
here is designed to hetp po[icymakers, educators, and other interested parties
understand the effects on educationa[ practice.
Common Core
Development and Substance
'he Common Core State Standards burst upon
the scene in June 2010 and were quickly
adopted by the vast majority of states, 43 as
of spring 2013. This initial embrace has been
followed by a period of reexamination in
some states. Although the idea of standards
that are consistent across states has become controver-
sial in certain circles, the undertying content knowledge
and cognitive skills that comprise the Common Core State
Standards themselves have not been seriously questioned
or chaltenged. When ideological arguments about edu-
cational governance and who should control curriculum
are stripped away, the Common Core State Standards are
more likely to be viewed more dispassionately as a syn-
thesis of college and career readiness standards already
developed, the expectations contained in the standards
of high performing U.S. states and in the educational sys-
tems of countries that are equipping their citizens for life
in the dynamically changing economic and social systems
of the 21st century (Conley, Drummond, de GonzaLez,
Rooseboom, Et Stout, 201ta; Conley, Drummond, de Gon-
zalez, Rooseboom, & Stout, 2011b; Council of Chief State
School Officers Et National Governors Association Center
for Best Practices, 2010).
This Social Policy Report considers the Common
Core State Standards, where they came from, what they
are, and what effect they are likely to have on educa-
tion. It begins with an overview of the importance of
educational standards in U.S. schools, the need for more
students who are college and career ready, and the role
of the Common Core State Standards in achieving this
goaL. The process by which the standards were deveL-
oped is described, followed by a consideration of the
facts about.
SIRCDSociety for Reÿearchn Child Developmentsharin.docxjennifer822
SIR
CD
Society for Reÿearch
n Child Development
sharing child and youth development knowledge
volume 28, number 2
2014
I Social Policy Report
Common Core
Development and Substance
David T. Conley
University of Oregon
Abstract
his poticy report provides an overview of the Common Core State
Standards, how they were developed, the sources that were ref-
erenced in their development, the need for educationa[ standards
generatty, what they entail, and what it wit[ mean for educators
to imptement them. The report draws from research and refer-
ence materia[ to outtine the argument for the Common Core and the sources
used in its development. These inctude cortege and career readiness standards
developed over the past 15 years, high quality state standards, and the con-
tent spec]fications from other nations whose educationa[ systems are widety
respected. Additiona[ research demonstrates the retationship between the
Common Core and co[[ege and career readiness. While this report does offer
insight into the structure of the standards, most of the information presented
here is designed to hetp po[icymakers, educators, and other interested parties
understand the effects on educationa[ practice.
Common Core
Development and Substance
'he Common Core State Standards burst upon
the scene in June 2010 and were quickly
adopted by the vast majority of states, 43 as
of spring 2013. This initial embrace has been
followed by a period of reexamination in
some states. Although the idea of standards
that are consistent across states has become controver-
sial in certain circles, the undertying content knowledge
and cognitive skills that comprise the Common Core State
Standards themselves have not been seriously questioned
or chaltenged. When ideological arguments about edu-
cational governance and who should control curriculum
are stripped away, the Common Core State Standards are
more likely to be viewed more dispassionately as a syn-
thesis of college and career readiness standards already
developed, the expectations contained in the standards
of high performing U.S. states and in the educational sys-
tems of countries that are equipping their citizens for life
in the dynamically changing economic and social systems
of the 21st century (Conley, Drummond, de GonzaLez,
Rooseboom, Et Stout, 201ta; Conley, Drummond, de Gon-
zalez, Rooseboom, & Stout, 2011b; Council of Chief State
School Officers Et National Governors Association Center
for Best Practices, 2010).
This Social Policy Report considers the Common
Core State Standards, where they came from, what they
are, and what effect they are likely to have on educa-
tion. It begins with an overview of the importance of
educational standards in U.S. schools, the need for more
students who are college and career ready, and the role
of the Common Core State Standards in achieving this
goaL. The process by which the standards were deveL-
oped is described, followed by a consideration of the
facts about.
Similar to Increasing Advanced & Proficient Mathematics Skills With the Common Core State Standards (20)
SIRCDSociety for Reÿearchn Child Developmentsharin.docx
Increasing Advanced & Proficient Mathematics Skills With the Common Core State Standards
1. INCREASING ADVANCED & PROFICIENT
MATHEMATICS SKILLS WITH
THE COMMON CORE STATE STANDARDS
AN EXAMINATION OF SIX WISCONSIN SCHOOL DISTRICTS
ABSTRACT
In 2010, six Wisconsin School Districts adopted the Common Core State Standards for
Mathematics. After three years of using the standards, all school districts had increased
educational outcomes with one realizing increases that exceeded state averages for
mathematics skill by more than 10 percent.
— Tim Scherer
ORIGO Education
2. TABLE OF CONTENTS
INTRODUCTION
Objectives
THE CREATION OF THE COMMON CORE STANDARDS
The Common Core Math Standards
Key Changes
THE COMMON CORE GOES TO WISCONSIN
ANALYSIS
FINDINGS
DISCUSSIONS
CONCLUSIONS
APPENDIX A.
AN EXPLANATION OF THE KEY CHANGES
THAT COMMON CORE INTRODUCES
APPENDIX B.
THE WISCONSIN FOUNDATIONS
FOR MATHEMATICS
APPENDIX C.
DEMOGRAPHIC AND SOCIOECONOMIC
INFORMATION FOR EACH SCHOOL DISTRICT
APPENDIX D.
SCHOOL DISTRICT RESULTS OF THE
WISCONSIN KNOWLEDGE AND CONCEPTS
EXAMINATIONS AND ALTERNATE ASSESSMENT
FOR STUDENTS WITH DISABILITIES
APPENDIX E.
STATEWIDE AVERAGES IN ADVANCED PLUS
PROFICIENT MATHEMATICS SKILLS 2012–2014
WORKS CITED
iii
1
2
3
3
4
4
5
6
7
9
11
12
3. INTRODUCTION
The United States performance in the subject of
mathematics has historically been problematic.
Although a February 2015 Pew Research Center
report showed U.S. students are scoring higher on
nationwide math assessments than they did two
decades ago, they still rank around average when
compared internationally, and behind many other
advanced industrialized nations. While there is
much that is good and to be celebrated in U.S.
schools, nevertheless, mathematically, they have
lost ground to many international peers in this
subject. Put simply, U.S. students’ performance in
mathematics is one area that is all too frequently
cited as having opportunity for improvement
(Desilver, 2015).
Corestandards.org, the official website for the
Common Core Standards, states that previous
research on mathematics education in high-
performing countries around the world has
consistently shown that to improve mathematics
education in the U.S., educators must focus
more deeply on the major topics at each grade
level along with coherently linking these topics
across the grades. In response to these findings,
in 2009, the Common Core State Standards for
Mathematics (CCSSM) were developed to help
guide mathematics education with the goal of
improving US performance
(National Governors Association Center
for Best Practices, Council of
Chief State School Officers, 2015).
To implement these new standards, the U.S. has
a wealth of excellent and extremely dedicated
teachers with a passion for helping students
succeed academically. However, with so many
developers of education resources flooding the
market with little more than slightly revised
products, school districts are finding it hard to
determine which materials will truly help them
address the goals of the Common Core Math
Standards. Moreover, selecting these materials is
a complicated and lengthy process.
An article by Hung-Hsi Wu, featured in the
American Educator, highlights the issue, pointing
out that:
“…developers have yet to recognize that
the Common Core Standards are radically
different from their predecessors. Most (if
not possibly all) textbook developers are
only slightly revising their texts before
declaring them aligned with the Common
Core State Mathematics Standards”
(Wu 2011).
Wu’s statement is further supported by a quote
from Gabriela Mafi, Superintendent of Garden
Grove Unified, in Orange County, who said in a
2015 Edsource.org report that:
“The biggest challenge has been the lack
of textbooks and materials.”
OBJECTIVES
With this information in mind, the objectives of
this paper are to:
Provide an overview of the history and
development of the Common Core State
Standards for Mathematics.
Illustrate the key changes that the CCSSM
bring to educators.
Present an overview of the implementation
of the CCSSM in the State of Wisconsin.
Show the effect the CCSSM had on
advanced plus proficient mathematics skills
in six Wisconsin school districts after the
adoption of the CCSSM-aligned product,
ORIGO Stepping Stones.
iii
4. KEY CHANGES
While it is true that the CCSSM do build on the best existing
standards, they also introduce significant shifts in educational
practices in the U.S., requiring educators to learn new ways
of instructing students. According to Corestandards.org, the
following is a summary of the key shifts that the Common
Core dictates:
1. GREATER FOCUS ON FEWER TOPICS
Rather than racing to cover many topics in a “mile-wide and
inch-deep” curriculum, the standards ask math teachers to
focus more deeply on the major work at each grade.
2. GREATER COHERENCE AMONG TOPICS
Mathematics is too often looked upon as a list of disconnected
topics, tricks, or mnemonics. In fact, it is a coherent body of
knowledge consisting of interconnected concepts. Therefore,
the standards are designed around coherent progressions
from grade to grade. Learning is carefully connected across
grades so that students can build new understanding onto
foundations built in previous years.
The CCSSM were developed as a response to the
historical underperformance of U.S. students in
mathematics. In 2009, state leaders, including
governors and state commissioners of education
from 48 states, two territories and the District
of Columbia, met and decided that change was
needed, if improvement was to be seen. Their goal
was to develop common, nationwide, college- and
career-ready K–12 standards for mathematics
(National Governors Association Center
for Best Practices, Council of
Chief State School Officers, 2015).
Collaborating alongside their membership
organizations, which included the National
Governors Association Center for Best Practices
(NGA Center), and the Council of Chief State School
Officers (CCSSO), new expectations for what every
child should know and be able to do after graduating
from high school were developed.
With the expectations established, the next goal
was creating the content standards for grades K–12
that would align with this newly-created criteria. To
achieve this objective, states worked with groups of
educators, representatives of higher education, and
other professionals in order to develop and write
the new standards to meet these expectations. This
included significant input from the public sector.
Using a combination of high-quality state
standards, the most important international
models for mathematics practice, scholars,
departments of education, educators, business
leaders, and parents, the CCSSM was established.
A validation committee was then appointed to
review the final standards.
THE COMMON CORE
MATH STANDARDS
In contrast to the fractured nature of many
previous standards, the CCSSM stress the
conceptual understanding of key ideas and
continually returning to organizing principles of
the subject including concepts such as place value
and the laws of arithmetic. By concentrating on
a clear set of math skills and concepts, students
are continually encouraged to solve real-world
problems in an organized way during the school
year, and across academic grade levels.
A common misconception about the CCSSM is
that they dictate curriculum and teaching methods.
Common Core lays the foundation for what should
be known, not how it should be taught. CCSSM
empower teachers to transform these broader
standards into an engaging and meaningful learning
experience for all their students.
THE CREATION OF THE COMMON CORE
STATE STANDARDS FOR MATHEMATICS
3. GREATER RIGOR
Rigor refers to deep, authentic command of mathematical
concepts, not making math harder or introducing topics at
earlier grades. There are three aspects of rigor in the major
work of each grade: conceptual understanding, procedural
skills and fluency, and application.
Conceptual understanding is described as accessing
concepts from a number of perspectives in order
to see math as more than a set of mnemonics or
discrete procedures.
Procedural skills and fluency are seen, for example, as
understanding single-digit multiplication, in order to have
access to more complex concepts and procedures.
Application means students using math in situations
that require mathematical knowledge and correctly
applying this knowledge. This is dependent on conceptual
understanding, procedural skills, and fluency.
A full explanation of these foundations can be
found in APPENDIX A.
1
5. On June 2, 2010, the Wisconsin Department of
Public Instruction formally adopted the Common
Core State Standards for Mathematics, and by
proxy, the changes previously outlined therein.
The WDPI’s vision for the CCSSM is: “…ensuring
every child is a graduate who has successfully
completed a rigorous, meaningful, 21st century
education that will prepare him or her for careers,
college and citizenship.” (Wisconsin Department
of Public Instruction, 2011).
Even though this vision aligns with the broader
CCSSM goals, the WDPI went further by creating
four of its own foundations to direct and support
the teaching and learning of mathematics in
Wisconsin school districts. These are:
1. Every student must have access to and engage
in meaningful, challenging, and rigorous
mathematics.
2. Mathematics should be experienced as
coherent, connected, intrinsically interesting
and relevant.
3. Problem solving, understanding, reasoning,
and sense making are at the heart of
mathematics teaching and learning and are
central to mathematical proficiency.
4. Effective mathematics classroom practices
include the use of collaboration, discourse and
reflection to engage students in the study of
important mathematics.
A full explanation of these foundations can be
found in APPENDIX B.
Once Wisconsin educators embraced the
fundamental changes set forth in the CCSSM,
they were now tasked with finding the best tools,
technologies, and textbooks to transform an
abstract vision of the future into clear, tangible,
real-world academic results. These classroom
resources are the key tools educators use to
help ensure that their teachers are able to meet
the expectations set forth in the CCSSM, i.e.
textbooks, support materials, and professional
learning opportunities. Selecting these resources
can be a lengthy and difficult process. Frequently,
it requires administrators and teachers to agree
on many differing, and sometimes conflicting,
criteria. Many companies meet with educators
and school district representatives and promise
that their products will create a classroom where
math makes more sense for students while
simultaneously failing to reveal that their products
are merely hastily updated versions of previous
content that does not align with the most basic
aspects of the CCSSM.
In 2012, after much deliberation, six Wisconsin
school districts (Port Washington-Saukville,
Muskego-Norway, De Pere, Waukesha, and
Grafton) selected ORIGO Stepping Stones as
their educational resource materials. Interviews
with educators post-implementation revealed the
criteria used when deciding on their Common
Core resource materials. These included:
Strong alignment with the
Common Core State Standards for Mathematics.
An innovative curriculum.
Access to multiple resources
throughout the program.
Access to the most current version of
educational resources.
A continually improving program.
ORIGO Stepping Stones was selected because
it was believed that the product met these
requirements in the following ways:
It was written to reflect both the content and
intent of the CCSSM.
The engaging material fosters students’
thinking and reasoning skills through
innovative curriculum, enabling educators
to effectively assess deep understanding
and skill.
It provides multiple online and print resources
to engage all students, and differentiate
classroom instruction.
The continual updates through Stepping
Stones Online provide a cost-effective
solution to core math implementation, while
assisting in the recommended shift to digital
instructional materials.
The last point further aligns with The State
Education Technology Directors Association
which recommends that, “…state and districts
commit to beginning the shift from print to
digital instructional materials with the next major
adoption cycle, completing the transition by no
later than the 2017-18 school year.”
(Fletcher, G., Schaauser, D, & Levin, D., 2012).
THE COMMON CORE GOES TO WISCONSIN
2
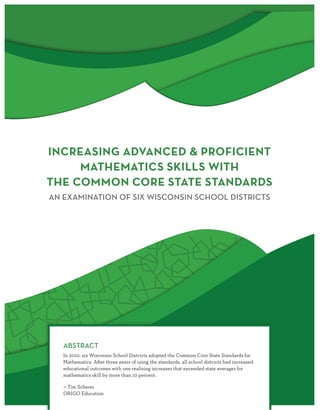
6. 48%
90%
0%
10%
20%
30%
40%
50%
60%
70%
80%
46%
ANALYSIS
Three years after implementing the CCSSM, an
analysis of these school districts’ advanced plus
proficient mathematics skills was undertaken.
The analysis compares the percentage of grade
four students with advanced plus proficient
mathematics skills for academic years 2012 through
2014. The percentages used were taken from the
WDPI District and School Report Cards website,
as reported by the WDPI. The WDPI derived
their percentages through administration of the
Wisconsin Knowledge and Concepts Examination
(WKCE) and the Wisconsin Alternate Assessment
for Students with Disabilities (WAA-SwD). Each
district’s report card used in this document is
available here:
https://apps2.dpi.wi.gov/reportcards/
It should be noted that the performance levels
listed by the WDPI have been retroactively
adjusted by the WDPI to align the WKCE
mathematics results with the college and career
readiness benchmarks found in the National
Assessment of Education Progress (NAEP). The
NAEP is written by the National Center for
Education Statistics, the primary federal entity for
collecting and analyzing data related to education
in the U.S. It is part of the U.S. Department
of Education and the Institute of Education
Sciences. Also, note that in these results, the
WAA-SwD results have not been adjusted. The
state-wide average for Wisconsin was calculated
by examining the Wisconsin District and School
Performance Reports, which are also published by
the WDPI and available at:
https://apps2.dpi.wi.gov/sdpr/spr.action
No socioeconomic or demographic information is
available for test takers of the WKCE. However,
individual district demographic information can be
found in APPENDIX C.
The findings show that all six school districts that
adopted the CCSSM and ORIGO Stepping Stones
saw an increased number of grade four students
with advanced plus proficient mathematics skills.
As illustrated in Figure 1, the largest school growth
was found in the Muskego-Norway School district
(13 percent). The average increase across all the
school districts combined was 7 percent. This is
significant because this increase is more than three
times higher than the statewide average increase
from 2012 to 2014. Two of the three schools that
incorporated professional learning sessions along
with their implementation (Muskego-Norway and
Grafton) saw the largest gains.
FINDINGS
Figure 1. A Comparison of School Districts Advanced Plus Proficient Mathematics Skills
Data for these years can be found in APPENDIX D. and APPENDIX E.
4th Grade Districts Using Stepping Stones vs. Statewide
Averages in Mathematics Proficiency FAY 2012–2014
Students with Advanced Plus Proficient Skills 2013–2014Students with Advanced Plus Proficient Skills 2012–2013
3
7. DISCUSSION
Developing and adopting the CCSSM was an
important first step toward the goal of increasing
mathematics performance in the U.S. However,
without support from the best tools, technologies,
textbooks, and professional learning for teachers,
realizing the full potential of the content and
intentions of the CCSSM is not likely to occur.
In 2010, the Wisconsin Department of Public
Instruction formally adopted the Common Core
State Standards for Mathematics with a vision
that every child has successfully completed a
rigorous, meaningful, 21st century education
that will prepare him or her for careers, college,
and citizenship. While creating a vision and
underpinning foundations is easy, delivering the
results is the hard part.
Six Wisconsin school districts combined
passionate teachers with the CCSSM, and some of
the best educational resources available: ORIGO
Stepping Stones and ORIGO Professional Learning
Services. This enabled the six districts to see an
average of seven percent gains in advanced plus
proficient mathematics skills, more than tripling
the statewide average of two percent.
CONCLUSIONS
It is conceded correlations do not necessarily
equal causation. Some of the limitations of this
paper include not knowing specific information
on individual test takers, the skills of each
teacher, and a variety of other factors that may
contribute to mathematics proficiency. There
are, nevertheless, consistencies that can be
identified among the school districts, and from this
information, conclusions can be inferred.
The main consistency, in this case, is the
educational resource utilized to implement the
CCSSM in these school districts. It should be
noted that three out of five of the school districts,
including the school district that realized the
largest gains (Muskego-Norway), did utilize
ORIGO Professional Learning Services.
It is believed that part of the success of these six
school districts comes from using ORIGO Stepping
Stones. Because it was written and developed by
a team of experts in order to provide teachers
with access to a world-class elementary Common
Core math program, it is not simply a rehash of
an existing product. ORIGO Stepping Stones
enables students and teachers alike, to realize
the ambitions of the CCSSM through a strong
mathematical foundation, a solid understanding
of concepts, a high degree of procedural skill and
fluency, and the ability to apply the math they
know to solve problems inside and outside the
classroom.
The team of authors and consultants at ORIGO
utilized all available educational research
to create a unique program with the rigor
necessary to ensure that students develop the
deep, authentic command of mathematical
concepts, including conceptual understanding,
procedural skills, fluency, and application.
Combined with a focus on conceptual
understanding and learning, ORIGO Stepping
Stones engenders mathematical creativity in
students by equipping them with the skills and
confidence to realize that there is often more
than one way to solve problems.
Put simply, the ORIGO team chose to
use a smarter approach to the CCSSM.
It is believed that when this approach is used in
combination with a passionate teacher, students’
thinking and reasoning skills can truly be developed.
This not only enables educators to truly assess if
students possess the coherence of mathematics that
is required to build on previous learning, but also
the command of mathematical concepts that will
enable them to progress academically.
4
8. GREATER FOCUS ON
FEWER TOPICS
The Common Core calls for greater focus in
mathematics. Rather than racing to cover many
topics in a “mile-wide, inch-deep” curriculum,
the standards ask math teachers to significantly
narrow and deepen the way time and energy
are spent in the classroom. This means focusing
deeply on the major work of each grade as follows:
In grades K–2: concepts, skills, and problem
solving related to addition and subtraction.
In grades 3–5: concepts, skills, and problem
solving related to multiplication and division of
whole numbers and fractions.
In grade 6: ratios and proportional relationships,
and early algebraic expressions and equations.
In grade 7: ratios and proportional relationships,
and arithmetic of rational numbers.
In grade 8: linear algebra and linear functions.
This focus will help students gain strong
foundations, including a solid understanding of
concepts, a high degree of procedural skill and
fluency, and the ability to apply the math they
know to solve problems inside and outside the
classroom.
COHERENCE
Mathematics is not a list of disconnected topics,
tricks, or mnemonics; it is a coherent body of
knowledge made up of interconnected concepts.
Therefore, the standards are designed around
coherent progressions from grade to grade.
Learning is carefully connected across grades
so that students can build new understanding
onto foundations built in previous years. For
example, in 4th grade, students must “apply and
extend previous understandings of multiplication
to multiply a fraction by a whole number.” This
extends to 5th grade, when students are expected
to build on that skill to “apply and extend previous
understandings of multiplication to multiply a
fraction or whole number by a fraction.” Each
standard is not a new event, but an extension of
previous learning.
RIGOR
Rigor refers to deep, authentic command of
mathematical concepts, not making math harder
or introducing topics at earlier grades. To help
students meet the standards, educators will need
to pursue, with equal intensity, three aspects of
rigor in the major work of each grade: conceptual
understanding, procedural skills and fluency, and
application.
Conceptual understanding: The standards call for
conceptual understanding of key concepts, such
as place value and ratios. Students must be able to
access concepts from a number of perspectives in
order to see math as more than a set of mnemonics
or discrete procedures.
Procedural skills and fluency: The standards call
for speed and accuracy in calculation. Students
must practice core functions, such as single-digit
multiplication, in order to have access to more
complex concepts and procedures. Fluency
must be addressed in the classroom or through
supporting materials, as some students might
require more practice than others.
Application: The standards call for students to
use math in situations that require mathematical
knowledge. Correctly applying mathematical
knowledge depends on students having a solid
conceptual understanding and procedural fluency.
(National Governors Association Center
for Best Practices, Council of
Chief State School Officers, 2010).
APPENDIX A.
AN EXPLANATION OF THE KEY CHANGES
THAT COMMON CORE INTRODUCES
5
9. Wisconsin Foundations for Mathematics
Wisconsin’s Guiding Principles for Teaching and
Learning provide important guidance for the
mathematics classroom. Within the discipline
of mathematics, each of the six principles has
specific implications for equity, pedagogy,
instruction, and assessment. Mathematics
educators should consider how the six guiding
principles influence their teaching. The following
foundations provide direction for the teaching and
learning of mathematics in Wisconsin.
Every student must have access to and
engage in meaningful, challenging, and
rigorous mathematics.
Equity in mathematics education requires
recognition that the standards must be kept
consistent while being flexible in instructional
approach and methods of assessment to
accommodate the strengths and weaknesses of all
students. In order to optimize student learning, the
high bar that is set for all should not be moved for
some students; instead, the delivery system
must be varied to allow access for all. Schools
and classrooms need to be organized to convey
the message that all students can learn
mathematics and should be expected to achieve.
Effective mathematics classroom practice involves
assessing students’ prior knowledge, designing
tasks that allow flexibility of approach, and
orchestrating classroom discussions that allow
every student to successfully access and learn
important mathematics.
Mathematics should be experienced as coherent,
connected, intrinsically interesting, and relevant.
The PK-12 curriculum should integrate and
sequence important mathematical ideas so that
students can make sense of mathematics and
develop a thorough understanding of concepts.
The curriculum should build from grade to
grade and topic to topic so that students have
experiences that are coherent. The connections
of mathematical ideas in a well-designed
curriculum allow students to see mathematics
as important in its own right, as well as a useful
subject that has relevant applications to the real
world and to other disciplines.
Problem solving, understanding, reasoning, and
sense-making are at the heart of mathematics
teaching and learning and are central to
mathematical proficiency.
Using problem solving as a vehicle for teaching
mathematics not only develops knowledge
and skills, but also helps students understand
and make sense of mathematics. By infusing
reasoning and sense-making in daily mathematics
instruction, students are able to see how new
concepts connect with existing knowledge and
they are able to solidify their understanding.
Students who are mathematically proficient
see that mathematics makes sense and show
a willingness to persevere. They possess both
understanding of mathematical concepts and
fluency with procedural skills.
Effective mathematics classroom practices
include the use of collaboration, discourse, and
reflection to engage students in the study of
important mathematics.
Collaboration and classroom discourse can
significantly deepen student understanding of
mathematical concepts. In addition to teacher-
student dialogue, peer collaboration and
individual reflection must also be emphasized.
Representing, thinking, discussing, agreeing,
and disagreeing are central to what students
learn about mathematics. Posing questions and
tasks that elicit, engage, and challenge students’
thinking, as well as asking students to clarify their
thinking and justify solutions and solution paths
should be evident in all mathematics classrooms.
(Wisconsin Department of Public Instruction, 2011).
APPENDIX B.
THE WISCONSIN FOUNDATIONS
FOR MATHEMATICS
6
10. PORT WASHINGTON-SAUKVILLE
SCHOOL DISTRICT
Grades: K4–12
Locale: Town
Enrollment: 2,687
Race/Ethnicity
American Indian or Alaskan Native: 0.6%
Asian or Pacific Islander: 1.9%
Black Not Hispanic: 3.4%
Hispanic: 5.0%
White Not Hispanic: 89.1%
Student Groups
Students with Disabilities: 13.3%
Economically Disadvantaged: 25.4%
Limited English Proficiency: 1.2%
(Wisconsin Department of Public Instruction,
Port Washington, 2015 pp. 1)
MUSKEGO-NORWAY
SCHOOL DISTRICT
Grades: K4–12
Locale: Suburb
Enrollment: 4,886
Race/Ethnicity
American Indian or Alaskan Native: 0.3%
Asian or Pacific Islander: 2.1%
Black Not Hispanic 1.3%
Hispanic: 4.1%
White Not Hispanic: 92.1%
Student Groups
Students with Disabilities: 8.2%
Economically Disadvantaged: 14.4%
Limited English Proficiency: 0.4%
(Wisconsin Department of Public Instruction,
Muskego, 2015 pp. 1)
DE PERE SCHOOL DISTRICT
Grades: K4–12
Locale: Suburb
Enrollment: 4,148
Race/Ethnicity
American Indian or Alaskan Native: 0.9%
Asian or Pacific Islander: 2.4%
Black Not Hispanic: 3.1%
Hispanic: 3.9%
White Not Hispanic: 89.7%
Student Groups
Students with Disabilities: 12.7%
Economically Disadvantaged: 18.2%
Limited English Proficiency: 2.3%
(Wisconsin Department of Public Instruction,
De Pere, 2015 pp. 1)
GRAFTON SCHOOL DISTRICT
Grades: PK–12
Locale: Suburb
Enrollment: 2,099
Race/Ethnicity
American Indian or Alaska Native: .08%
Asian or Pacific Islander: 4.0%
Black not Hispanic: 3.1%
Hispanic: 3.9%
White not Hispanic: 88.1%
Student Groups
Students with Disabilities: 17.2%
Economically Disadvantaged: 18.5%
Limited English Proficiency: 1.5%
(Wisconsin Department of Public Instruction,
Grafton, 2015 pp. 1)
APPENDIX C.
DEMOGRAPHIC AND SOCIOECONOMIC INFORMATION
FOR EACH SCHOOL DISTRICT
7
11. WAUKESHA SCHOOL DISTRICT
Grades: PK–12
Locale: City
Enrollment: 13,678
Race/Ethnicity
American Indian or Alaska Native: 0.6%
Asian or Pacific Islander: 4.6%
Black not Hispanic: 6.4%
Hispanic: 19.6%
White not Hispanic: 68.9%
Student Groups
Students with Disabilities: 13.1%
Economically Disadvantaged: 35.5%
Limited English Proficiency: 8.8%
(Wisconsin Department of Public Instruction,
Waukesha, 2015 pp. 1)
PULASKI COMMUNITY
Grades: K4–12
Locale: Town
Enrollment: 3,690
Race/Ethnicity
American Indian or Alaska Native: 3.1%
Asian or Pacific Islander: 1.3%
Black not Hispanic: 1.6%
Hispanic: 2.3%
White not Hispanic: 91.6%
Student Groups
Students with Disabilities: 13.8%
Economically Disadvantaged: 21.7%
Limited English Proficiency: 0.6%
(Wisconsin Department of Public Instruction,
Pulaski, 2015 pp. 1)
8
12. APPENDIX D.
SCHOOL DISTRICT RESULTS OF THE WISCONSIN
KNOWLEDGE AND CONCEPTS EXAMINATIONS AND
ALTERNATE ASSESSMENT FOR STUDENTS WITH DISABILITIES
9
(Wisconsin Department of Public Instruction,
Grafton, 2015 pp. 18)
Wisconsin Department of Public Instruction | dpi.wi.gov Page
18
The data below are provided for informational purposes only and are not used to calculate a district's Accountability
Score. The data below include both WKCE (Wisconsin Knowledge and Concepts Examinations) and WAA-SwD (Wisconsin
Alternate Assessment for Students with Disabilities) results.
Performance levels have been retroactively adjusted to align WKCE reading and mathematics results with college and
career readiness benchmarks based on the National Assessment of Educational Progress (NAEP) performance levels.
Performance levels for WAA-SwD have not been adjusted.
Reading
4
5
6
8
10
3
Grade
Students
Tested
Proficient and
Advanced
Students
Tested
Proficient and
Advanced
131
125
131
134
136
217
58.8%
49.6%
51.9%
35.1%
61.8%
43.8%
156
135
136
130
156
167
50.6%
57.8%
48.5%
49.2%
46.8%
55.1%
7 155 47.1% 146 43.8%
Students
Tested
Proficient and
Advanced
126
127
127
144
132
173
48.4%
58.3%
53.5%
51.4%
49.2%
48.6%
137 58.4%
Students
Tested
Proficient and
Advanced
Students
Tested
Proficient and
Advanced
128
157
136
139
156
172
60.9%
46.5%
52.9%
44.6%
54.5%
51.2%
114
132
155
138
146
180
57.0%
56.1%
51.6%
43.5%
50.0%
55.6%
144 45.8% 145 44.8%
Mathematics
4
5
6
8
10
3
Grade
Students
Tested
Proficient and
Advanced
Students
Tested
Proficient and
Advanced
131
125
131
134
136
217
74.8%
71.2%
75.6%
65.7%
59.6%
50.2%
156
135
136
130
156
167
75.6%
72.6%
73.5%
69.2%
62.2%
53.9%
7 155 63.2% 146 71.2%
Students
Tested
Proficient and
Advanced
126
127
127
144
132
173
81.7%
70.1%
66.1%
77.8%
62.9%
49.1%
137 67.9%
Students
Tested
Proficient and
Advanced
Students
Tested
Proficient and
Advanced
128
157
136
139
156
172
85.9%
67.5%
75.0%
69.8%
62.2%
52.9%
114
132
155
138
146
180
74.6%
76.5%
67.7%
65.2%
55.5%
63.3%
144 59.7% 145 67.6%
District Results: Wisconsin Student Assessment System
The National Assessment of Educational
Progress (NAEP) is administered to 4th and 8th
grade students every two years in a
representative sample of schools nationwide.
These data are provided for informational
purposes only and are not used to calculate a
district's Accountability Score.
Wisconsin
Nation
40%
34%
8th Grade Percent
Proficient and Advanced
36%
34%
Group
Mathematics Reading
4th Grade Percent
Proficient and Advanced
47%
41%
35%
34%
Mathematics Reading
State Results: National Assessment of Educational Progress 2013
Report cards for different types of schools or districts should not be directly compared.
2013-14
2013-14
2012-13
2012-13
2011-12
2011-12
2010-11
2010-11
2009-10
2009-10
sin Department of Public Instruction | dpi.wi.gov Page
18
ded for informational purposes only and are not used to calculate a district's Accountability
clude both WKCE (Wisconsin Knowledge and Concepts Examinations) and WAA-SwD (Wisconsin
Students with Disabilities) results.
been retroactively adjusted to align WKCE reading and mathematics results with college and
arks based on the National Assessment of Educational Progress (NAEP) performance levels.
AA-SwD have not been adjusted.
Reading
Students
Tested
Proficient and
Advanced
Students
Tested
Proficient and
Advanced
131
125
131
134
136
217
58.8%
49.6%
51.9%
35.1%
61.8%
43.8%
156
135
136
130
156
167
50.6%
57.8%
48.5%
49.2%
46.8%
55.1%
155 47.1% 146 43.8%
ent and
anced
8.4%
8.3%
3.5%
1.4%
9.2%
8.6%
8.4%
Students
Tested
Proficient and
Advanced
Students
Tested
Proficient and
Advanced
128
157
136
139
156
172
60.9%
46.5%
52.9%
44.6%
54.5%
51.2%
114
132
155
138
146
180
57.0%
56.1%
51.6%
43.5%
50.0%
55.6%
144 45.8% 145 44.8%
Mathematics
Students
Tested
Proficient and
Advanced
Students
Tested
Proficient and
Advanced
131
125
131
134
136
217
74.8%
71.2%
75.6%
65.7%
59.6%
50.2%
156
135
136
130
156
167
75.6%
72.6%
73.5%
69.2%
62.2%
53.9%
155 63.2% 146 71.2%
ent and
anced
1.7%
0.1%
6.1%
7.8%
2.9%
9.1%
7.9%
Students
Tested
Proficient and
Advanced
Students
Tested
Proficient and
Advanced
128
157
136
139
156
172
85.9%
67.5%
75.0%
69.8%
62.2%
52.9%
114
132
155
138
146
180
74.6%
76.5%
67.7%
65.2%
55.5%
63.3%
144 59.7% 145 67.6%
: Wisconsin Student Assessment System
of Educational
istered to 4th and 8th
years in a
schools nationwide.
or informational
t used to calculate a
core.
Wisconsin
Nation
40%
34%
8th Grade Percent
Proficient and Advanced
36%
34%
Group
Mathematics Reading
4th Grade Percent
Proficient and Advanced
47%
41%
35%
34%
Mathematics Reading
National Assessment of Educational Progress 2013
for different types of schools or districts should not be directly compared.
2013-14
2013-14
2012-13
2012-13
2011-12
2011-12
2010-11
2010-11
Wisconsin Department of Public Instruction | dpi.wi.gov Page
18
The data below are provided for informational purposes only and are not used to calculate a district's Accountability
Score. The data below include both WKCE (Wisconsin Knowledge and Concepts Examinations) and WAA-SwD (Wisconsin
Alternate Assessment for Students with Disabilities) results.
Performance levels have been retroactively adjusted to align WKCE reading and mathematics results with college and
career readiness benchmarks based on the National Assessment of Educational Progress (NAEP) performance levels.
Performance levels for WAA-SwD have not been adjusted.
Reading
4
5
6
8
10
3
Grade
Students
Tested
Proficient and
Advanced
Students
Tested
Proficient and
Advanced
131
125
131
134
136
217
58.8%
49.6%
51.9%
35.1%
61.8%
43.8%
156
135
136
130
156
167
50.6%
57.8%
48.5%
49.2%
46.8%
55.1%
7 155 47.1% 146 43.8%
Students
Tested
Proficient and
Advanced
126
127
127
144
132
173
48.4%
58.3%
53.5%
51.4%
49.2%
48.6%
137 58.4%
Students
Tested
Proficient and
Advanced
Students
Tested
Proficient and
Advanced
128
157
136
139
156
172
60.9%
46.5%
52.9%
44.6%
54.5%
51.2%
114
132
155
138
146
180
57.0%
56.1%
51.6%
43.5%
50.0%
55.6%
144 45.8% 145 44.8%
Mathematics
4
5
6
8
10
3
Grade
Students
Tested
Proficient and
Advanced
Students
Tested
Proficient and
Advanced
131
125
131
134
136
217
74.8%
71.2%
75.6%
65.7%
59.6%
50.2%
156
135
136
130
156
167
75.6%
72.6%
73.5%
69.2%
62.2%
53.9%
7 155 63.2% 146 71.2%
Students
Tested
Proficient and
Advanced
126
127
127
144
132
173
81.7%
70.1%
66.1%
77.8%
62.9%
49.1%
137 67.9%
Students
Tested
Proficient and
Advanced
Students
Tested
Proficient and
Advanced
128
157
136
139
156
172
85.9%
67.5%
75.0%
69.8%
62.2%
52.9%
114
132
155
138
146
180
74.6%
76.5%
67.7%
65.2%
55.5%
63.3%
144 59.7% 145 67.6%
District Results: Wisconsin Student Assessment System
Grafton
District Report Card Detail | 2013-14 | Assessment Trends
The National Assessment of Educational
Progress (NAEP) is administered to 4th and 8th
grade students every two years in a
representative sample of schools nationwide.
These data are provided for informational
purposes only and are not used to calculate a
district's Accountability Score.
Wisconsin
Nation
40%
34%
8th Grade Percent
Proficient and Advanced
36%
34%
Group
Mathematics Reading
4th Grade Percent
Proficient and Advanced
47%
41%
35%
34%
Mathematics Reading
State Results: National Assessment of Educational Progress 2013
Report cards for different types of schools or districts should not be directly compared.
FINAL - PUBLIC REPORT - FOR PUBLIC RELEASE
2013-14
2013-14
2012-13
2012-13
2011-12
2011-12
2010-11
2010-11
2009-10
2009-10
District Report Card Detail
2013-14 | Assessment Trends
sin Department of Public Instruction | dpi.wi.gov Page
18
ded for informational purposes only and are not used to calculate a district's Accountability
clude both WKCE (Wisconsin Knowledge and Concepts Examinations) and WAA-SwD (Wisconsin
Students with Disabilities) results.
been retroactively adjusted to align WKCE reading and mathematics results with college and
arks based on the National Assessment of Educational Progress (NAEP) performance levels.
AA-SwD have not been adjusted.
Reading
Students
Tested
Proficient and
Advanced
Students
Tested
Proficient and
Advanced
164
164
187
192
178
192
50.6%
53.0%
50.8%
39.1%
40.4%
44.8%
148
168
162
184
178
205
43.9%
51.2%
50.6%
43.5%
34.3%
50.7%
177 44.1% 195 50.3%
ent and
anced
0.9%
1.9%
2.9%
9.8%
3.3%
4.6%
7.8%
Students
Tested
Proficient and
Advanced
Students
Tested
Proficient and
Advanced
177
147
158
163
184
192
52.5%
42.2%
43.0%
47.2%
46.2%
50.0%
171
186
154
160
188
203
45.0%
53.8%
42.9%
43.8%
42.6%
51.2%
183 56.3% 167 57.5%
Mathematics
Students
Tested
Proficient and
Advanced
Students
Tested
Proficient and
Advanced
164
164
187
192
178
192
51.2%
59.1%
55.6%
55.2%
49.4%
51.6%
148
171
162
184
178
205
57.4%
59.6%
61.1%
50.0%
42.1%
49.3%
177 38.4% 195 51.3%
ent and
anced
4.7%
9.9%
6.6%
1.5%
6.5%
3.2%
6.1%
Students
Tested
Proficient and
Advanced
Students
Tested
Proficient and
Advanced
177
147
158
163
184
192
54.8%
53.7%
57.6%
58.9%
51.6%
51.6%
171
186
154
160
188
203
60.2%
60.2%
51.3%
50.0%
58.0%
50.7%
183 53.6% 167 59.3%
s: Wisconsin Student Assessment System
Port Washington-Saukville
District Report Card Detail | 2013-14 | Assessment Trends
of Educational
istered to 4th and 8th
years in a
schools nationwide.
or informational
t used to calculate a
core.
Wisconsin
Nation
40%
34%
8th Grade Percent
Proficient and Advanced
36%
34%
Group
Mathematics Reading
4th Grade Percent
Proficient and Advanced
47%
41%
35%
34%
Mathematics Reading
National Assessment of Educational Progress 2013
for different types of schools or districts should not be directly compared.
FINAL - PUBLIC REPORT - FOR PUBLIC RELEASE
2013-14
2013-14
2012-13
2012-13
2011-12
2011-12
2010-11
2010-11
Wisconsin Department of Public Instruction | dpi.wi.gov Page
18
The data below are provided for informational purposes only and are not used to calculate a district's Accountability
Score. The data below include both WKCE (Wisconsin Knowledge and Concepts Examinations) and WAA-SwD (Wisconsin
Alternate Assessment for Students with Disabilities) results.
Performance levels have been retroactively adjusted to align WKCE reading and mathematics results with college and
career readiness benchmarks based on the National Assessment of Educational Progress (NAEP) performance levels.
Performance levels for WAA-SwD have not been adjusted.
Reading
4
5
6
8
10
3
Grade
Students
Tested
Proficient and
Advanced
Students
Tested
Proficient and
Advanced
164
164
187
192
178
192
50.6%
53.0%
50.8%
39.1%
40.4%
44.8%
148
168
162
184
178
205
43.9%
51.2%
50.6%
43.5%
34.3%
50.7%
7 177 44.1% 195 50.3%
Students
Tested
Proficient and
Advanced
167
187
189
171
186
216
50.9%
51.9%
42.9%
39.8%
33.3%
54.6%
180 47.8%
Students
Tested
Proficient and
Advanced
Students
Tested
Proficient and
Advanced
177
147
158
163
184
192
52.5%
42.2%
43.0%
47.2%
46.2%
50.0%
171
186
154
160
188
203
45.0%
53.8%
42.9%
43.8%
42.6%
51.2%
183 56.3% 167 57.5%
Mathematics
4
5
6
8
10
3
Grade
Students
Tested
Proficient and
Advanced
Students
Tested
Proficient and
Advanced
164
164
187
192
178
192
51.2%
59.1%
55.6%
55.2%
49.4%
51.6%
148
171
162
184
178
205
57.4%
59.6%
61.1%
50.0%
42.1%
49.3%
7 177 38.4% 195 51.3%
Students
Tested
Proficient and
Advanced
167
187
189
171
185
216
64.7%
59.9%
46.6%
41.5%
46.5%
53.2%
180 46.1%
Students
Tested
Proficient and
Advanced
Students
Tested
Proficient and
Advanced
177
147
158
163
184
192
54.8%
53.7%
57.6%
58.9%
51.6%
51.6%
171
186
154
160
188
203
60.2%
60.2%
51.3%
50.0%
58.0%
50.7%
183 53.6% 167 59.3%
District Results: Wisconsin Student Assessment System
Port Washington-Saukville
District Report Card Detail | 2013-14 | Assessment Trends
The National Assessment of Educational
Progress (NAEP) is administered to 4th and 8th
grade students every two years in a
representative sample of schools nationwide.
These data are provided for informational
purposes only and are not used to calculate a
district's Accountability Score.
Wisconsin
Nation
40%
34%
8th Grade Percent
Proficient and Advanced
36%
34%
Group
Mathematics Reading
4th Grade Percent
Proficient and Advanced
47%
41%
35%
34%
Mathematics Reading
State Results: National Assessment of Educational Progress 2013
Report cards for different types of schools or districts should not be directly compared.
FINAL - PUBLIC REPORT - FOR PUBLIC RELEASE
2013-14
2013-14
2012-13
2012-13
2011-12
2011-12
2010-11
2010-11
2009-10
2009-10The data below are provided for informational purposes only and are not used to calculate a district's Accountability
Score. The data below include both WKCE (Wisconsin Knowledge and Concepts Examinations) and WAA-SwD (Wisconsin
Alternate Assessment for Students with Disabilities) results.
Performance levels have been retroactively adjusted to align WKCE reading and mathematics results with college and
career readiness benchmarks based on the National Assessment of Educational Progress (NAEP) performance levels.
Performance levels for WAA-SwD have not been adjusted.
Reading
4
5
6
8
10
3
Grade
Students
Tested
Proficient and
Advanced
Students
Tested
Proficient and
Advanced
164
164
187
192
178
192
50.6%
53.0%
50.8%
39.1%
40.4%
44.8%
148
168
162
184
178
205
43.9%
51.2%
50.6%
43.5%
34.3%
50.7%
7 177 44.1% 195 50.3%
Students
Tested
Proficient and
Advanced
167
187
189
171
186
216
50.9%
51.9%
42.9%
39.8%
33.3%
54.6%
180 47.8%
Students
Tested
Proficient and
Advanced
Students
Tested
Proficient and
Advanced
177
147
158
163
184
192
52.5%
42.2%
43.0%
47.2%
46.2%
50.0%
171
186
154
160
188
203
45.0%
53.8%
42.9%
43.8%
42.6%
51.2%
183 56.3% 167 57.5%
Mathematics
4
5
6
3
Grade
Students
Tested
Proficient and
Advanced
Students
Tested
Proficient and
Advanced
164
164
187
192
51.2%
59.1%
55.6%
55.2%
148
171
162
184
57.4%
59.6%
61.1%
50.0%
Students
Tested
Proficient and
Advanced
167
187
189
171
64.7%
59.9%
46.6%
41.5%
Students
Tested
Proficient and
Advanced
Students
Tested
Proficient and
Advanced
177
147
158
163
54.8%
53.7%
57.6%
58.9%
171
186
154
160
60.2%
60.2%
51.3%
50.0%
District Results: Wisconsin Student Assessment System
Port Washington-Saukville
District Report Card Detail | 2013-14 | Assessment Trends
FINAL - PUBLIC REPORT - FOR PUBLIC RELEASE
2013-14
2013-14
2012-13
2012-13
2011-12
2011-12
2010-11
2010-11
2009-10
2009-10
(Wisconsin Department of Public Instruction,
Port Washington, 2015 pp. 18)
District Report Card Detail
2013-14 | Assessment Trends
Wisconsin Department of Public Instruction | dpi.wi.gov Pa
1
The data below are provided for informational purposes only and are not used to calculate a district's Accountability
Score. The data below include both WKCE (Wisconsin Knowledge and Concepts Examinations) and WAA-SwD (Wisconsin
Alternate Assessment for Students with Disabilities) results.
Performance levels have been retroactively adjusted to align WKCE reading and mathematics results with college and
career readiness benchmarks based on the National Assessment of Educational Progress (NAEP) performance levels.
Performance levels for WAA-SwD have not been adjusted.
Reading
4
5
6
8
10
3
Grade
Students
Tested
Proficient and
Advanced
Students
Tested
Proficient and
Advanced
292
322
334
356
327
443
49.7%
50.0%
37.7%
41.0%
47.4%
50.8%
358
298
326
338
392
398
47.5%
50.7%
40.8%
42.0%
38.0%
63.1%
7 384 41.1% 369 46.6%
Students
Tested
Proficient and
Advanced
310
330
351
366
338
416
45.8%
46.1%
35.9%
42.1%
41.7%
54.3%
327 45.0%
Students
Tested
Proficient and
Advanced
Students
Tested
Proficient and
Advanced
319
368
291
322
370
366
52.4%
43.8%
39.5%
42.9%
49.5%
50.3%
312
327
371
304
347
419
42.9%
54.7%
36.9%
43.1%
40.6%
58.9%
344 36.3% 336 50.0%
Mathematics
4
5
6
8
10
3
Grade
Students
Tested
Proficient and
Advanced
Students
Tested
Proficient and
Advanced
292
322
334
356
327
443
69.5%
71.4%
65.6%
71.9%
54.7%
65.2%
358
298
326
338
392
398
74.3%
73.8%
62.6%
66.3%
59.9%
63.8%
7 384 60.4% 369 56.1%
Students
Tested
Proficient and
Advanced
310
330
351
366
338
418
75.2%
72.1%
60.7%
66.9%
54.1%
56.0%
327 54.1%
Students
Tested
Proficient and
Advanced
Students
Tested
Proficient and
Advanced
319
368
291
322
370
366
73.7%
62.0%
60.8%
68.6%
57.6%
66.4%
312
327
371
304
347
419
72.4%
74.6%
52.0%
63.8%
67.1%
67.1%
344 62.5% 336 61.9%
District Results: Wisconsin Student Assessment System
Muskego-Norway
District Report Card Detail | 2013-14 | Assessment Trends
The National Assessment of Educational
Progress (NAEP) is administered to 4th and 8th
grade students every two years in a
representative sample of schools nationwide.
These data are provided for informational
purposes only and are not used to calculate a
district's Accountability Score.
Wisconsin
Nation
40%
34%
8th Grade Percent
Proficient and Advanced
36%
34%
Group
Mathematics Reading
4th Grade Percent
Proficient and Advanced
47%
41%
35%
34%
Mathematics Reading
State Results: National Assessment of Educational Progress 2013
Report cards for different types of schools or districts should not be directly compared.
FINAL - PUBLIC REPORT - FOR PUBLIC RELEASE
2013-14
2013-14
2012-13
2012-13
2011-12
2011-12
2010-11
2010-11
2009-10
2009-10
(Wisconsin Department of Public Instruction,
Muskego, 2015 pp. 18)
District Report Card Detail
2013-14 | Assessment Trends
Wisconsin Department of Public Instructio
The data below are provided for informational purposes only and are not us
Score. The data below include both WKCE (Wisconsin Knowledge and Conce
Alternate Assessment for Students with Disabilities) results.
Performance levels have been retroactively adjusted to align WKCE reading a
career readiness benchmarks based on the National Assessment of Educatio
Performance levels for WAA-SwD have not been adjusted.
Reading
4
5
6
8
10
3
Grade
Students
Tested
Proficient and
Advanced
Students
Tested
Proficient and
Advanced
292
322
334
356
327
443
49.7%
50.0%
37.7%
41.0%
47.4%
50.8%
358
298
326
338
392
398
47.5%
50.7%
40.8%
42.0%
38.0%
63.1%
7 384 41.1% 369 46.6%
Students
Tested
Proficient and
Advanced
310
330
351
366
338
416
45.8%
46.1%
35.9%
42.1%
41.7%
54.3%
327 45.0%
Mathematics
4
5
6
8
10
3
Grade
Students
Tested
Proficient and
Advanced
Students
Tested
Proficient and
Advanced
292
322
334
356
327
443
69.5%
71.4%
65.6%
71.9%
54.7%
65.2%
358
298
326
338
392
398
74.3%
73.8%
62.6%
66.3%
59.9%
63.8%
7 384 60.4% 369 56.1%
Students
Tested
Proficient and
Advanced
310
330
351
366
338
418
75.2%
72.1%
60.7%
66.9%
54.1%
56.0%
327 54.1%
District Results: Wisconsin Student Assessmen
The National Assessment of Educational
Progress (NAEP) is administered to 4th and 8th
grade students every two years in a
representative sample of schools nationwide.
These data are provided for informational
purposes only and are not used to calculate a
district's Accountability Score.
Wisconsin
Nation
Group
4th Grad
Proficient a
47%
41%
Mathematics
State Results: National Assessment of Educati
Report cards for different types of schools or districts should no
2011-12
2011-12
2010-11
2010-11
2009-10
2009-10
Wisconsin Department of Public Instruction | dpi.wi.gov Page
18
The data below are provided for informational purposes only and are not used to calculate a district's Accountability
Score. The data below include both WKCE (Wisconsin Knowledge and Concepts Examinations) and WAA-SwD (Wisconsin
Alternate Assessment for Students with Disabilities) results.
Performance levels have been retroactively adjusted to align WKCE reading and mathematics results with college and
career readiness benchmarks based on the National Assessment of Educational Progress (NAEP) performance levels.
Performance levels for WAA-SwD have not been adjusted.
Reading
4
5
6
8
10
3
Grade
Students
Tested
Proficient and
Advanced
Students
Tested
Proficient and
Advanced
292
322
334
356
327
443
49.7%
50.0%
37.7%
41.0%
47.4%
50.8%
358
298
326
338
392
398
47.5%
50.7%
40.8%
42.0%
38.0%
63.1%
7 384 41.1% 369 46.6%
Students
Tested
Proficient and
Advanced
310
330
351
366
338
416
45.8%
46.1%
35.9%
42.1%
41.7%
54.3%
327 45.0%
Students
Tested
Proficient and
Advanced
Students
Tested
Proficient and
Advanced
319
368
291
322
370
366
52.4%
43.8%
39.5%
42.9%
49.5%
50.3%
312
327
371
304
347
419
42.9%
54.7%
36.9%
43.1%
40.6%
58.9%
344 36.3% 336 50.0%
Mathematics
4
5
6
8
10
3
Grade
Students
Tested
Proficient and
Advanced
Students
Tested
Proficient and
Advanced
292
322
334
356
327
443
69.5%
71.4%
65.6%
71.9%
54.7%
65.2%
358
298
326
338
392
398
74.3%
73.8%
62.6%
66.3%
59.9%
63.8%
7 384 60.4% 369 56.1%
Students
Tested
Proficient and
Advanced
310
330
351
366
338
418
75.2%
72.1%
60.7%
66.9%
54.1%
56.0%
327 54.1%
Students
Tested
Proficient and
Advanced
Students
Tested
Proficient and
Advanced
319
368
291
322
370
366
73.7%
62.0%
60.8%
68.6%
57.6%
66.4%
312
327
371
304
347
419
72.4%
74.6%
52.0%
63.8%
67.1%
67.1%
344 62.5% 336 61.9%
District Results: Wisconsin Student Assessment System
The National Assessment of Educational
Progress (NAEP) is administered to 4th and 8th
grade students every two years in a
representative sample of schools nationwide.
These data are provided for informational
purposes only and are not used to calculate a
district's Accountability Score.
Wisconsin
Nation
40%
34%
8th Grade Percent
Proficient and Advanced
36%
34%
Group
Mathematics Reading
4th Grade Percent
Proficient and Advanced
47%
41%
35%
34%
Mathematics Reading
State Results: National Assessment of Educational Progress 2013
Report cards for different types of schools or districts should not be directly compared.
2013-14
2013-14
2012-13
2012-13
2011-12
2011-12
2010-11
2010-11
2009-10
2009-10
District Report Card Detail
2013-14 | Assessment Trends
(Wisconsin Department of Public Instruction,
Waukesha, 2015 pp. 18)
Wisconsin Department of Public Instruction | dpi.wi.gov Page
18
The data below are provided for informational purposes only and are not used to calculate a district's Accountability
Score. The data below include both WKCE (Wisconsin Knowledge and Concepts Examinations) and WAA-SwD (Wisconsin
Alternate Assessment for Students with Disabilities) results.
Performance levels have been retroactively adjusted to align WKCE reading and mathematics results with college and
career readiness benchmarks based on the National Assessment of Educational Progress (NAEP) performance levels.
Performance levels for WAA-SwD have not been adjusted.
Reading
4
5
6
8
10
3
Grade
Students
Tested
Proficient and
Advanced
Students
Tested
Proficient and
Advanced
850
832
844
853
846
984
37.2%
33.3%
35.2%
37.7%
43.3%
34.7%
863
837
842
849
860
919
33.7%
36.1%
34.7%
35.7%
32.8%
43.9%
7 816 37.5% 881 39.3%
Students
Tested
Proficient and
Advanced
827
849
858
808
817
980
32.6%
35.0%
35.1%
39.0%
30.1%
43.3%
785 41.4%
Students
Tested
Proficient and
Advanced
Students
Tested
Proficient and
Advanced
850
818
829
815
903
942
35.3%
36.3%
36.4%
33.4%
41.4%
42.5%
836
845
823
820
879
929
34.7%
35.9%
34.8%
37.3%
34.7%
45.0%
868 39.1% 838 39.5%
Mathematics
4
5
6
8
10
3
Grade
Students
Tested
Proficient and
Advanced
Students
Tested
Proficient and
Advanced
855
837
848
853
846
985
49.0%
41.5%
41.5%
53.3%
45.7%
44.3%
863
838
843
849
859
918
52.4%
51.4%
47.1%
45.9%
47.8%
45.6%
7 816 44.7% 881 46.5%
Students
Tested
Proficient and
Advanced
844
857
862
809
822
982
53.2%
47.5%
43.6%
50.1%
42.3%
42.4%
786 49.7%
Students
Tested
Proficient and
Advanced
Students
Tested
Proficient and
Advanced
849
819
829
815
903
942
48.6%
48.4%
46.2%
56.2%
45.4%
52.2%
836
845
824
820
879
928
52.8%
51.8%
49.0%
49.6%
46.4%
48.4%
867 47.2% 838 50.7%
District Results: Wisconsin Student Assessment System
Waukesha
District Report Card Detail | 2013-14 | Assessment Trends
The National Assessment of Educational
Progress (NAEP) is administered to 4th and 8th
grade students every two years in a
representative sample of schools nationwide.
These data are provided for informational
purposes only and are not used to calculate a
district's Accountability Score.
Wisconsin
Nation
40%
34%
8th Grade Percent
Proficient and Advanced
36%
34%
Group
Mathematics Reading
4th Grade Percent
Proficient and Advanced
47%
41%
35%
34%
Mathematics Reading
State Results: National Assessment of Educational Progress 2013
Report cards for different types of schools or districts should not be directly compared.
FINAL - PUBLIC REPORT - FOR PUBLIC RELEASE
2013-14
2013-14
2012-13
2012-13
2011-12
2011-12
2010-11
2010-11
2009-10
2009-10
Wisconsin Department of Public Instructio
The data below are provided for informational purposes only and are not us
Score. The data below include both WKCE (Wisconsin Knowledge and Conce
Alternate Assessment for Students with Disabilities) results.
Performance levels have been retroactively adjusted to align WKCE reading a
career readiness benchmarks based on the National Assessment of Educatio
Performance levels for WAA-SwD have not been adjusted.
Reading
4
5
6
8
10
3
Grade
Students
Tested
Proficient and
Advanced
Students
Tested
Proficient and
Advanced
850
832
844
853
846
984
37.2%
33.3%
35.2%
37.7%
43.3%
34.7%
863
837
842
849
860
919
33.7%
36.1%
34.7%
35.7%
32.8%
43.9%
7 816 37.5% 881 39.3%
Students
Tested
Proficient and
Advanced
827
849
858
808
817
980
32.6%
35.0%
35.1%
39.0%
30.1%
43.3%
785 41.4%
Mathematics
4
5
6
8
10
3
Grade
Students
Tested
Proficient and
Advanced
Students
Tested
Proficient and
Advanced
855
837
848
853
846
985
49.0%
41.5%
41.5%
53.3%
45.7%
44.3%
863
838
843
849
859
918
52.4%
51.4%
47.1%
45.9%
47.8%
45.6%
7 816 44.7% 881 46.5%
Students
Tested
Proficient and
Advanced
844
857
862
809
822
982
53.2%
47.5%
43.6%
50.1%
42.3%
42.4%
786 49.7%
District Results: Wisconsin Student Assessmen
Waukesha
District Report Card Detail | 2013-
The National Assessment of Educational
Progress (NAEP) is administered to 4th and 8th
grade students every two years in a
representative sample of schools nationwide.
These data are provided for informational
purposes only and are not used to calculate a
district's Accountability Score.
Wisconsin
Nation
Group
4th Grad
Proficient a
47%
41%
Mathematics
State Results: National Assessment of Educati
Report cards for different types of schools or districts should no
FINAL - PUBLIC REPORT - FOR PUBLIC RELEA
2011-12
2011-12
2010-11
2010-11
2009-10
2009-10The data below are provided for informational purposes only and are not used to calculate a district's Accountability
Score. The data below include both WKCE (Wisconsin Knowledge and Concepts Examinations) and WAA-SwD (Wisconsin
Alternate Assessment for Students with Disabilities) results.
Performance levels have been retroactively adjusted to align WKCE reading and mathematics results with college and
career readiness benchmarks based on the National Assessment of Educational Progress (NAEP) performance levels.
Performance levels for WAA-SwD have not been adjusted.
Reading
4
5
6
8
10
3
Grade
Students
Tested
Proficient and
Advanced
Students
Tested
Proficient and
Advanced
850
832
844
853
846
984
37.2%
33.3%
35.2%
37.7%
43.3%
34.7%
863
837
842
849
860
919
33.7%
36.1%
34.7%
35.7%
32.8%
43.9%
7 816 37.5% 881 39.3%
Students
Tested
Proficient and
Advanced
827
849
858
808
817
980
32.6%
35.0%
35.1%
39.0%
30.1%
43.3%
785 41.4%
Students
Tested
Proficient and
Advanced
Students
Tested
Proficient an
Advanced
850
818
829
815
903
942
35.3%
36.3%
36.4%
33.4%
41.4%
42.5%
836
845
823
820
879
929
34.7%
35.9%
34.8%
37.3%
34.7%
45.0%
868 39.1% 838 39.5%
Mathematics
4
5
6
3
Grade
Students
Tested
Proficient and
Advanced
Students
Tested
Proficient and
Advanced
855
837
848
853
49.0%
41.5%
41.5%
53.3%
863
838
843
849
52.4%
51.4%
47.1%
45.9%
Students
Tested
Proficient and
Advanced
844
857
862
809
53.2%
47.5%
43.6%
50.1%
Students
Tested
Proficient and
Advanced
Students
Tested
Proficient an
Advanced
849
819
829
815
48.6%
48.4%
46.2%
56.2%
836
845
824
820
52.8%
51.8%
49.0%
49.6%
District Results: Wisconsin Student Assessment System
Waukesha
District Report Card Detail | 2013-14 | Assessment Trends
FINAL - PUBLIC REPORT - FOR PUBLIC RELEASE
2013-14
2013-14
2012-13
2012-13
2011-12
2011-12
2010-11
2010-11
2009-10
2009-10
13. 10
District Report Card Detail
2013-14 | Assessment Trends
(Wisconsin Department of Public Instruction,
De Pere, 2015 pp. 18)
Wisconsin Department of Public Instruction | dpi.wi.gov Page
18
The data below are provided for informational purposes only and are not used to calculate a district's Accountability
Score. The data below include both WKCE (Wisconsin Knowledge and Concepts Examinations) and WAA-SwD (Wisconsin
Alternate Assessment for Students with Disabilities) results.
Performance levels have been retroactively adjusted to align WKCE reading and mathematics results with college and
career readiness benchmarks based on the National Assessment of Educational Progress (NAEP) performance levels.
Performance levels for WAA-SwD have not been adjusted.
Reading
4
5
6
8
10
3
Grade
Students
Tested
Proficient and
Advanced
Students
Tested
Proficient and
Advanced
267
261
269
306
274
312
48.7%
45.6%
50.9%
51.6%
63.9%
49.0%
244
276
261
273
281
324
41.4%
55.8%
43.3%
59.7%
48.4%
48.5%
7 274 55.8% 325 55.7%
Students
Tested
Proficient and
Advanced
249
257
299
265
291
281
40.6%
56.4%
45.8%
46.8%
43.6%
45.6%
265 54.3%
Students
Tested
Proficient and
Advanced
Students
Tested
Proficient and
Advanced
267
235
285
267
332
311
43.4%
45.1%
52.3%
50.6%
57.2%
58.5%
235
260
251
290
312
299
47.7%
52.3%
44.2%
57.6%
53.5%
59.9%
297 59.6% 279 55.9%
Mathematics
4
5
6
8
10
3
Grade
Students
Tested
Proficient and
Advanced
Students
Tested
Proficient and
Advanced
267
261
269
306
274
312
67.0%
63.6%
69.1%
72.9%
62.8%
50.3%
244
276
261
273
281
323
69.7%
73.9%
65.1%
70.7%
55.2%
55.1%
7 274 69.3% 325 69.5%
Students
Tested
Proficient and
Advanced
249
257
299
265
291
281
67.1%
72.0%
66.6%
68.7%
53.6%
50.2%
265 73.6%
Students
Tested
Proficient and
Advanced
Students
Tested
Proficient and
Advanced
267
235
285
267
333
311
59.2%
67.7%
67.7%
62.5%
55.9%
60.8%
235
260
251
290
312
299
69.4%
69.2%
67.3%
70.0%
60.6%
65.2%
297 65.7% 279 68.1%
District Results: Wisconsin Student Assessment System
The National Assessment of Educational
Progress (NAEP) is administered to 4th and 8th
grade students every two years in a
representative sample of schools nationwide.
These data are provided for informational
purposes only and are not used to calculate a
district's Accountability Score.
Wisconsin
Nation
40%
34%
8th Grade Percent
Proficient and Advanced
36%
34%
Group
Mathematics Reading
4th Grade Percent
Proficient and Advanced
47%
41%
35%
34%
Mathematics Reading
State Results: National Assessment of Educational Progress 2013
Report cards for different types of schools or districts should not be directly compared.
2013-14
2013-14
2012-13
2012-13
2011-12
2011-12
2010-11
2010-11
2009-10
2009-10
Wisconsin Department of Public Instruction | dpi.wi.gov
The data below are provided for informational purposes only and are not used to calculate a district's Acco
Score. The data below include both WKCE (Wisconsin Knowledge and Concepts Examinations) and WAA-Sw
Alternate Assessment for Students with Disabilities) results.
Performance levels have been retroactively adjusted to align WKCE reading and mathematics results with
career readiness benchmarks based on the National Assessment of Educational Progress (NAEP) performa
Performance levels for WAA-SwD have not been adjusted.
Reading
4
5
6
8
10
3
Grade
Students
Tested
Proficient and
Advanced
Students
Tested
Proficient and
Advanced
267
261
269
306
274
312
48.7%
45.6%
50.9%
51.6%
63.9%
49.0%
244
276
261
273
281
324
41.4%
55.8%
43.3%
59.7%
48.4%
48.5%
7 274 55.8% 325 55.7%
Students
Tested
Proficient and
Advanced
249
257
299
265
291
281
40.6%
56.4%
45.8%
46.8%
43.6%
45.6%
265 54.3%
Students
Tested
Proficient and
Advanced
Studen
Teste
267
235
285
267
332
311
43.4%
45.1%
52.3%
50.6%
57.2%
58.5%
235
260
251
290
312
299
297 59.6% 279
Mathematics
4
5
6
8
10
3
Grade
Students
Tested
Proficient and
Advanced
Students
Tested
Proficient and
Advanced
267
261
269
306
274
312
67.0%
63.6%
69.1%
72.9%
62.8%
50.3%
244
276
261
273
281
323
69.7%
73.9%
65.1%
70.7%
55.2%
55.1%
7 274 69.3% 325 69.5%
Students
Tested
Proficient and
Advanced
249
257
299
265
291
281
67.1%
72.0%
66.6%
68.7%
53.6%
50.2%
265 73.6%
Students
Tested
Proficient and
Advanced
Studen
Teste
267
235
285
267
333
311
59.2%
67.7%
67.7%
62.5%
55.9%
60.8%
235
260
251
290
312
299
297 65.7% 279
District Results: Wisconsin Student Assessment System
The National Assessment of Educational
Progress (NAEP) is administered to 4th and 8th
grade students every two years in a
representative sample of schools nationwide.
These data are provided for informational
purposes only and are not used to calculate a
district's Accountability Score.
Wisconsin
Nation
40%
34%
8th Grad
Proficient aGroup
Mathematics
4th Grade Percent
Proficient and Advanced
47%
41%
35%
34%
Mathematics Reading
State Results: National Assessment of Educational Progress 2013
Report cards for different types of schools or districts should not be directly compared.
2012-13
2012-13
2011-12
2011-12
2010-11
2010-11
2009-10
2009-10
Wisconsin Department of Public Instruction | dpi.wi.gov Page
18
The data below are provided for informational purposes only and are not used to calculate a district's Accountability
Score. The data below include both WKCE (Wisconsin Knowledge and Concepts Examinations) and WAA-SwD (Wisconsin
Alternate Assessment for Students with Disabilities) results.
Performance levels have been retroactively adjusted to align WKCE reading and mathematics results with college and
career readiness benchmarks based on the National Assessment of Educational Progress (NAEP) performance levels.
Performance levels for WAA-SwD have not been adjusted.
Reading
4
5
6
8
10
3
Grade
Students
Tested
Proficient and
Advanced
Students
Tested
Proficient and
Advanced
267
261
269
306
274
312
48.7%
45.6%
50.9%
51.6%
63.9%
49.0%
244
276
261
273
281
324
41.4%
55.8%
43.3%
59.7%
48.4%
48.5%
7 274 55.8% 325 55.7%
Students
Tested
Proficient and
Advanced
249
257
299
265
291
281
40.6%
56.4%
45.8%
46.8%
43.6%
45.6%
265 54.3%
Students
Tested
Proficient and
Advanced
Students
Tested
Proficient and
Advanced
267
235
285
267
332
311
43.4%
45.1%
52.3%
50.6%
57.2%
58.5%
235
260
251
290
312
299
47.7%
52.3%
44.2%
57.6%
53.5%
59.9%
297 59.6% 279 55.9%
Mathematics
4
5
6
8
10
3
Grade
Students
Tested
Proficient and
Advanced
Students
Tested
Proficient and
Advanced
267
261
269
306
274
312
67.0%
63.6%
69.1%
72.9%
62.8%
50.3%
244
276
261
273
281
323
69.7%
73.9%
65.1%
70.7%
55.2%
55.1%
7 274 69.3% 325 69.5%
Students
Tested
Proficient and
Advanced
249
257
299
265
291
281
67.1%
72.0%
66.6%
68.7%
53.6%
50.2%
265 73.6%
Students
Tested
Proficient and
Advanced
Students
Tested
Proficient and
Advanced
267
235
285
267
333
311
59.2%
67.7%
67.7%
62.5%
55.9%
60.8%
235
260
251
290
312
299
69.4%
69.2%
67.3%
70.0%
60.6%
65.2%
297 65.7% 279 68.1%
District Results: Wisconsin Student Assessment System
De Pere
District Report Card Detail | 2013-14 | Assessment Trends
The National Assessment of Educational
Progress (NAEP) is administered to 4th and 8th
grade students every two years in a
representative sample of schools nationwide.
These data are provided for informational
purposes only and are not used to calculate a
district's Accountability Score.
Wisconsin
Nation
40%
34%
8th Grade Percent
Proficient and Advanced
36%
34%
Group
Mathematics Reading
4th Grade Percent
Proficient and Advanced
47%
41%
35%
34%
Mathematics Reading
State Results: National Assessment of Educational Progress 2013
Report cards for different types of schools or districts should not be directly compared.
FINAL - PUBLIC REPORT - FOR PUBLIC RELEASE
2013-14
2013-14
2012-13
2012-13
2011-12
2011-12
2010-11
2010-11
2009-10
2009-10
Wisconsin Department of Public Instruction | dpi.wi.gov Page
18
The data below are provided for informational purposes only and are not used to calculate a district's Accountability
Score. The data below include both WKCE (Wisconsin Knowledge and Concepts Examinations) and WAA-SwD (Wisconsin
Alternate Assessment for Students with Disabilities) results.
Performance levels have been retroactively adjusted to align WKCE reading and mathematics results with college and
career readiness benchmarks based on the National Assessment of Educational Progress (NAEP) performance levels.
Performance levels for WAA-SwD have not been adjusted.
Reading
4
5
6
8
10
3
Grade
Students
Tested
Proficient and
Advanced
Students
Tested
Proficient and
Advanced
266
255
229
240
293
284
35.0%
31.8%
38.9%
40.4%
46.1%
50.7%
226
269
255
228
248
258
36.3%
34.2%
35.7%
45.2%
38.3%
56.2%
7 244 43.0% 244 50.0%
Students
Tested
Proficient and
Advanced
254
226
243
227
269
301
38.2%
48.2%
39.1%
43.2%
42.4%
58.1%
294 49.0%
Students
Tested
Proficient and
Advanced
Students
Tested
Proficient and
Advanced
256
234
273
258
248
294
32.8%
29.9%
38.8%
41.1%
53.6%
48.3%
256
263
237
269
245
243
40.2%
31.6%
31.2%
43.1%
41.6%
53.5%
253 47.4% 268 44.4%
Mathematics
4
5
6
8
10
3
Grade
Students
Tested
Proficient and
Advanced
Students
Tested
Proficient and
Advanced
266
255
229
240
293
284
47.7%
53.3%
59.4%
71.7%
66.6%
69.4%
226
268
255
228
246
258
61.1%
58.2%
59.6%
58.3%
61.0%
70.2%
7 244 62.7% 244 73.0%
Students
Tested
Proficient and
Advanced
253
226
243
227
269
301
56.1%
61.1%
70.4%
62.1%
63.9%
71.1%
294 71.1%
Students
Tested
Proficient and
Advanced
Students
Tested
Proficient and
Advanced
256
234
273
258
248
294
48.8%
53.8%
59.0%
64.7%
66.1%
68.4%
257
263
237
269
245
243
61.9%
55.9%
52.7%
59.1%
65.3%
66.7%
253 62.5% 268 63.8%
District Results: Wisconsin Student Assessment System
Pulaski Community
District Report Card Detail | 2013-14 | Assessment Trends
The National Assessment of Educational
Progress (NAEP) is administered to 4th and 8th
grade students every two years in a
representative sample of schools nationwide.
These data are provided for informational
purposes only and are not used to calculate a
district's Accountability Score.
Wisconsin
Nation
40%
34%
8th Grade Percent
Proficient and Advanced
36%
34%
Group
Mathematics Reading
4th Grade Percent
Proficient and Advanced
47%
41%
35%
34%
Mathematics Reading
State Results: National Assessment of Educational Progress 2013
Report cards for different types of schools or districts should not be directly compared.
FINAL - PUBLIC REPORT - FOR PUBLIC RELEASE
2013-14
2013-14
2012-13
2012-13
2011-12
2011-12
2010-11
2010-11
2009-10
2009-10
Wisconsin Department of Public Instruction | dpi.wi.gov
The data below are provided for informational purposes only and are not used to calculate a district's Acco
Score. The data below include both WKCE (Wisconsin Knowledge and Concepts Examinations) and WAA-Sw
Alternate Assessment for Students with Disabilities) results.
Performance levels have been retroactively adjusted to align WKCE reading and mathematics results with
career readiness benchmarks based on the National Assessment of Educational Progress (NAEP) performa
Performance levels for WAA-SwD have not been adjusted.
Reading
4
5
6
8
10
3
Grade
Students
Tested
Proficient and
Advanced
Students
Tested
Proficient and
Advanced
266
255
229
240
293
284
35.0%
31.8%
38.9%
40.4%
46.1%
50.7%
226
269
255
228
248
258
36.3%
34.2%
35.7%
45.2%
38.3%
56.2%
7 244 43.0% 244 50.0%
Students
Tested
Proficient and
Advanced
254
226
243
227
269
301
38.2%
48.2%
39.1%
43.2%
42.4%
58.1%
294 49.0%
Students
Tested
Proficient and
Advanced
Studen
Teste
256
234
273
258
248
294
32.8%
29.9%
38.8%
41.1%
53.6%
48.3%
256
263
237
269
245
243
253 47.4% 268
Mathematics
4
5
6
8
10
3
Grade
Students
Tested
Proficient and
Advanced
Students
Tested
Proficient and
Advanced
266
255
229
240
293
284
47.7%
53.3%
59.4%
71.7%
66.6%
69.4%
226
268
255
228
246
258
61.1%
58.2%
59.6%
58.3%
61.0%
70.2%
7 244 62.7% 244 73.0%
Students
Tested
Proficient and
Advanced
253
226
243
227
269
301
56.1%
61.1%
70.4%
62.1%
63.9%
71.1%
294 71.1%
Students
Tested
Proficient and
Advanced
Studen
Teste
256
234
273
258
248
294
48.8%
53.8%
59.0%
64.7%
66.1%
68.4%
257
263
237
269
245
243
253 62.5% 268
District Results: Wisconsin Student Assessment System
Pulaski Community
District Report Card Detail | 2013-14 | Assessment Tre
The National Assessment of Educational
Progress (NAEP) is administered to 4th and 8th
grade students every two years in a
representative sample of schools nationwide.
These data are provided for informational
purposes only and are not used to calculate a
district's Accountability Score.
Wisconsin
Nation
40%
34%
8th Grad
Proficient aGroup
Mathematics
4th Grade Percent
Proficient and Advanced
47%
41%
35%
34%
Mathematics Reading
State Results: National Assessment of Educational Progress 201
Report cards for different types of schools or districts should not be directly compared.
FINAL - PUBLIC REPORT - FOR PUBLIC RELEASE
2012-13
2012-13
2011-12
2011-12
2010-11
2010-11
2009-10
2009-10The data below are provided for informational purposes only and are not used to calculate a district's Accountability
Score. The data below include both WKCE (Wisconsin Knowledge and Concepts Examinations) and WAA-SwD (Wisconsin
Alternate Assessment for Students with Disabilities) results.
Performance levels have been retroactively adjusted to align WKCE reading and mathematics results with college and
career readiness benchmarks based on the National Assessment of Educational Progress (NAEP) performance levels.
Performance levels for WAA-SwD have not been adjusted.
Reading
4
5
6
8
10
3
Grade
Students
Tested
Proficient and
Advanced
Students
Tested
Proficient and
Advanced
266
255
229
240
293
284
35.0%
31.8%
38.9%
40.4%
46.1%
50.7%
226
269
255
228
248
258
36.3%
34.2%
35.7%
45.2%
38.3%
56.2%
7 244 43.0% 244 50.0%
Students
Tested
Proficient and
Advanced
254
226
243
227
269
301
38.2%
48.2%
39.1%
43.2%
42.4%
58.1%
294 49.0%
Students
Tested
Proficient and
Advanced
Students
Tested
Proficient and
Advanced
256
234
273
258
248
294
32.8%
29.9%
38.8%
41.1%
53.6%
48.3%
256
263
237
269
245
243
40.2%
31.6%
31.2%
43.1%
41.6%
53.5%
253 47.4% 268 44.4%
Mathematics
4
5
6
8
3
Grade
Students
Tested
Proficient and
Advanced
Students
Tested
Proficient and
Advanced
266
255
229
240
293
47.7%
53.3%
59.4%
71.7%
66.6%
226
268
255
228
246
61.1%
58.2%
59.6%
58.3%
61.0%
7 244 62.7% 244 73.0%
Students
Tested
Proficient and
Advanced
253
226
243
227
269
56.1%
61.1%
70.4%
62.1%
63.9%
294 71.1%
Students
Tested
Proficient and
Advanced
Students
Tested
Proficient and
Advanced
256
234
273
258
248
48.8%
53.8%
59.0%
64.7%
66.1%
257
263
237
269
245
61.9%
55.9%
52.7%
59.1%
65.3%
253 62.5% 268 63.8%
District Results: Wisconsin Student Assessment System
Pulaski Community
District Report Card Detail | 2013-14 | Assessment Trends
FINAL - PUBLIC REPORT - FOR PUBLIC RELEASE
2013-14
2013-14
2012-13
2012-13
2011-12
2011-12
2010-11
2010-11
2009-10
2009-10
District Report Card Detail
2013-14 | Assessment Trends
(Wisconsin Department of Public Instruction,
Pulaski, 2015 pp. 18)
14. APPENDIX E.
STATEWIDE AVERAGES IN ADVANCED PLUS PROFICIENT
MATHEMATICS SKILLS 2012-2014
(Wisconsin Department of Public Instruction, 2015)
(Wisconsin Department of Public Instruction, 2015)
11
Achievement Test Results
WKCE/WAA Combined - All Students - November 2012–2013
Advanced + Proficient Levels Statewide
Mathematics
Mathematics
Statewide
Statewide
60,720
61,439
49.0%
52.0%
Grade 4
Grade 4
Enrolled
FAY
Enrolled
FAY
Advanced +
Proficient
Advanced +
Proficient
Achievement Test Results
WKCE/WAA Combined - All Students - November 2013–2014
Advanced + Proficient Levels Statewide
15. WORKS CITED
Desilver, D. (2015, February 2). U.S. students improving – slowly – in math and science, but still lagging
internationally. Retrieved November 25, 2015, from http://www.pewresearch.org/fact-tank/2015/02/02/
u-s-students-improving-slowly-in-math-and-science-but-still-lagging-internationally/
Freedberg, L. & Harrington, T. (2015, November 15). Curriculum materials a sticking point in Common
Core implementation. Retrieved November 25, 2015, from http://edsource.org/2015/curriculum-
materials-a-sticking-point-in-common-core-implementation/90524
Fletcher, G., Schaauser, D, & Levin, D. (2012). Out of Print: Reimagining the K–12 Textbook in a Digital
Age. Washington, DC: State Educational Technology Directors Association (SETDA). Retrieved February
1, 2016, from http://www.setda.org/wp-content/uploads/2013/11/SETDA_Out_of_Print_FNL.pdf
National Governors Association Center for Best Practices, Council of Chief State School Officers (2010).
Common Core State Standards. Retrieved November 25, 2015, from http://www.corestandards.org/
Math/
Wisconsin Department of Public Instruction. (2011, September 11). WISCONSIN STANDARDS for
Mathematics. Retrieved November 23, 2015 from http://dpi.wi.gov/sites/default/files/imce/standards/
pdf/common-core-math-standards.pdf
Wisconsin Department of Public Instruction (2012). Wisconsin District and School Performance Reports.
Wisconsin District and School Performance Reports. The Wisconsin Department of Public Instruction.
Retrieved November 30, 2015, from https://apps2.dpi.wi.gov/sdpr/spr.action
Wisconsin Department of Public Instruction (2015). De Pere District Report Card 2013–2014. Pg. 1–20.
Retrieved from https://apps2.dpi.wi.gov/reportcards/
Wisconsin Department of Public Instruction (2015). Grafton District Report Card 2013–2014. 1–20.
Retrieved from https://apps2.dpi.wi.gov/reportcards/
Wisconsin Department of Public Instruction (2015). Port Washington–Saukville District Report Card
2013–2014. 1–20. Retrieved from https://apps2.dpi.wi.gov/reportcards/
Wisconsin Department of Public Instruction (2015). Pulaski Community District Report Card 2013–2014.
1–20. Retrieved from https://apps2.dpi.wi.gov/reportcards/
Wisconsin Department of Public Instruction (2015). Muskego–Norway District Report Card 2013–2014.
1–20. Retrieved from https://apps2.dpi.wi.gov/reportcards/
Wisconsin Department of Public Instruction (2015). Waukesha Report Card 2013–2014. 1–20. Retrieved
from https://apps2.dpi.wi.gov/reportcards/
Wu, Hung–Hsi (2011). “Phoenix Rising, Bringing the Common Core State Mathematics Standards to Life”
American Educator. Fall 2011: 3–13.
12
16. BIBLIOGRAPHY
National Governors Association Center for Best Practices, Council of Chief State School Officers (2010).
Common Core State Standards. Retrieved November 25, 2015, from http://www.corestandards.org/
other-resources/key-shifts-in-mathematics/
Welcome to Muskego-Norway Schools (2015). Retrieved November 30, 2015, from http://www.
muskegonorway.org
Port Washington-Saukville District Schools – Home (2015). Retrieved November, 23 2015, from http://
www.pwssd.k12.wi.us/education/district/district.php?sectionid=1
The National Center for Education Statistics (2015, April 30). National Assessment of Education Progress.
Retrieved December 4, 2015, from http://nces.ed.gov/nationsreportcard/about/
Unified School District of De Pere School Boundaries (2015). Retrieved November 30, 2015, from http://
www.depere.k12.wi.us/boundaries.html
Wikimedia Foundation. “Waukesha, Wisconsin.” Wikipedia. Wikimedia Foundation, Retrieved
November 25, 2015, from https://en.wikipedia.org/wiki/Waukesha,_Wisconsin
Wisconsin Department of Public Instruction (2015, November 19). Homepage. Retrieved November 30,
2015, from http://dpi.wi.gov
13