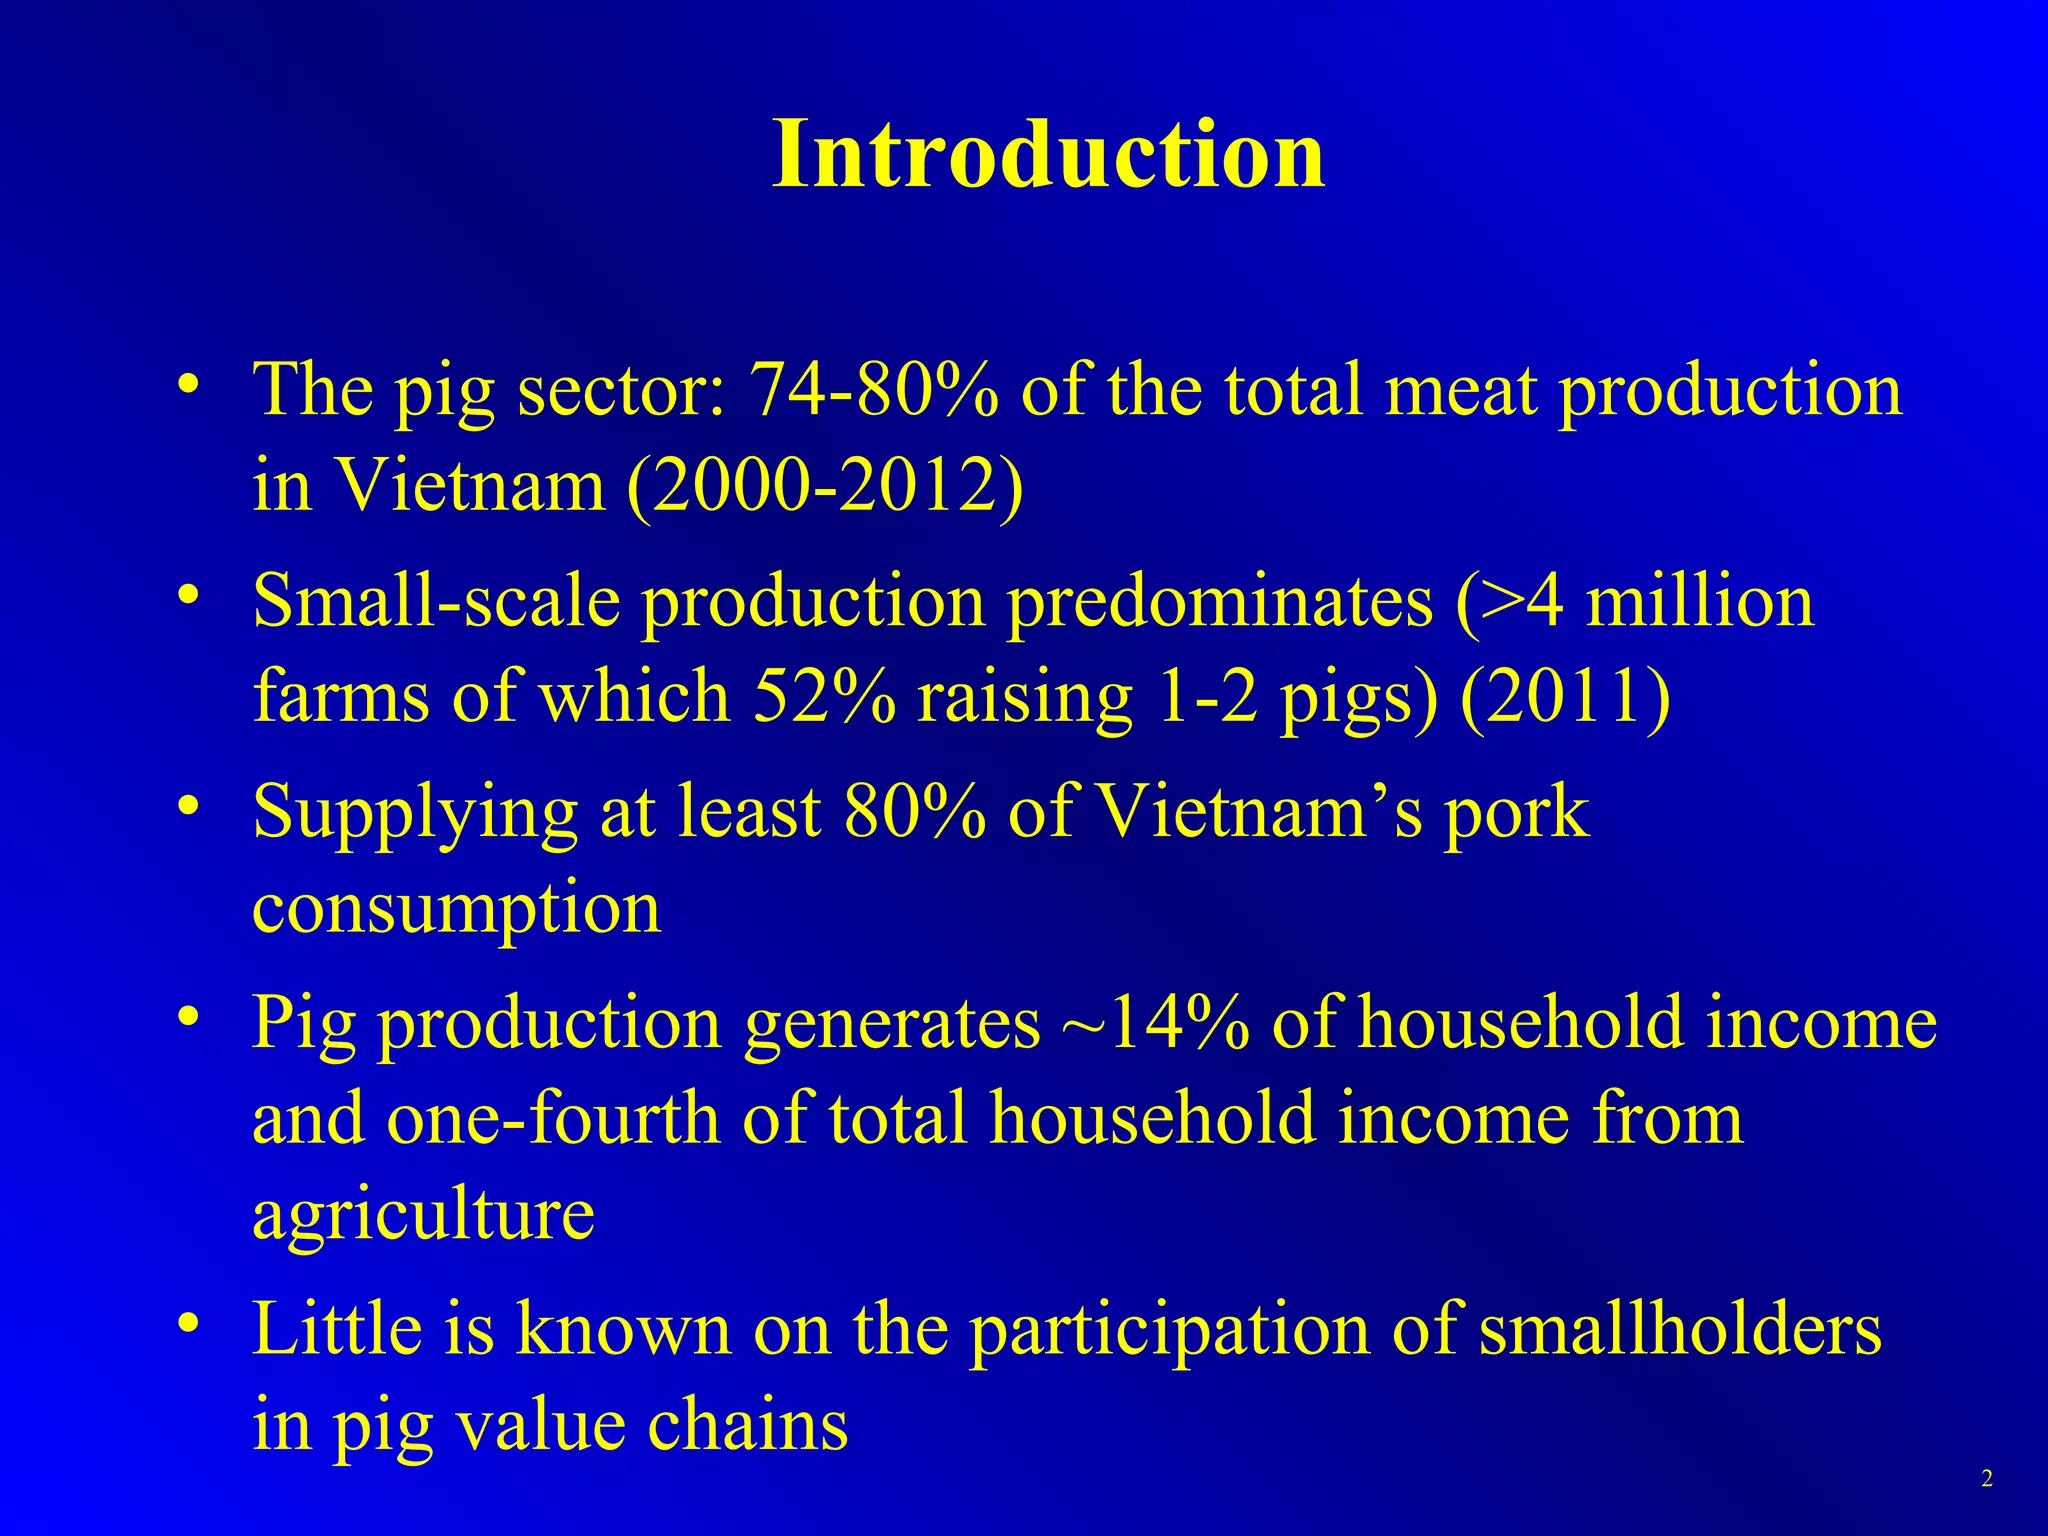
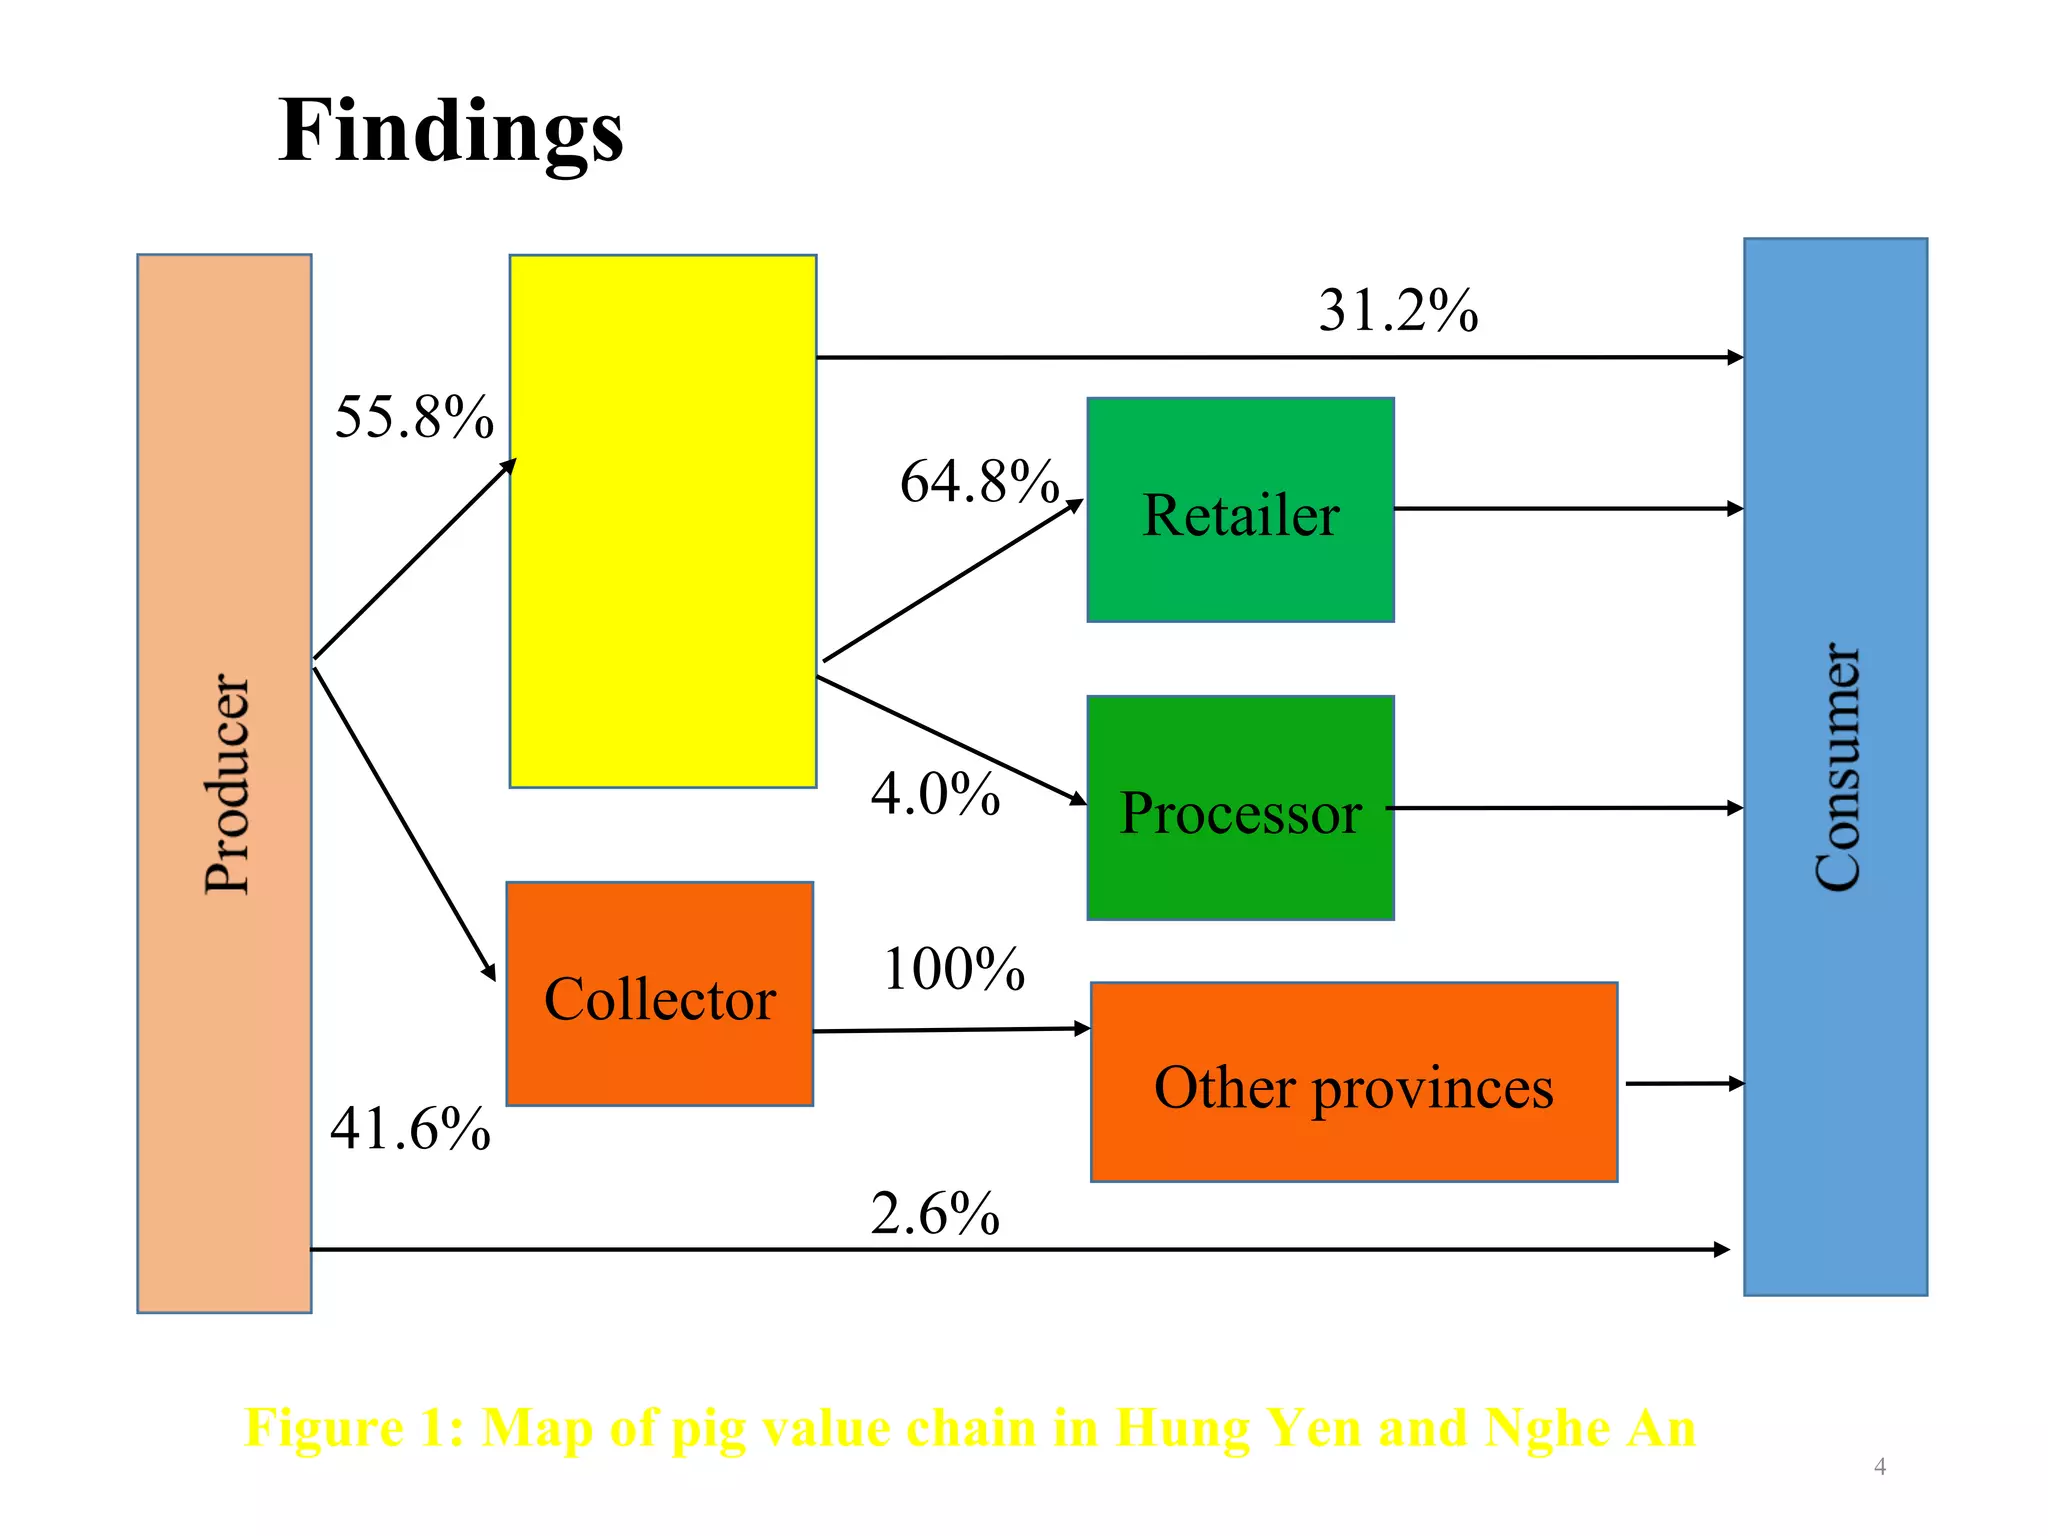
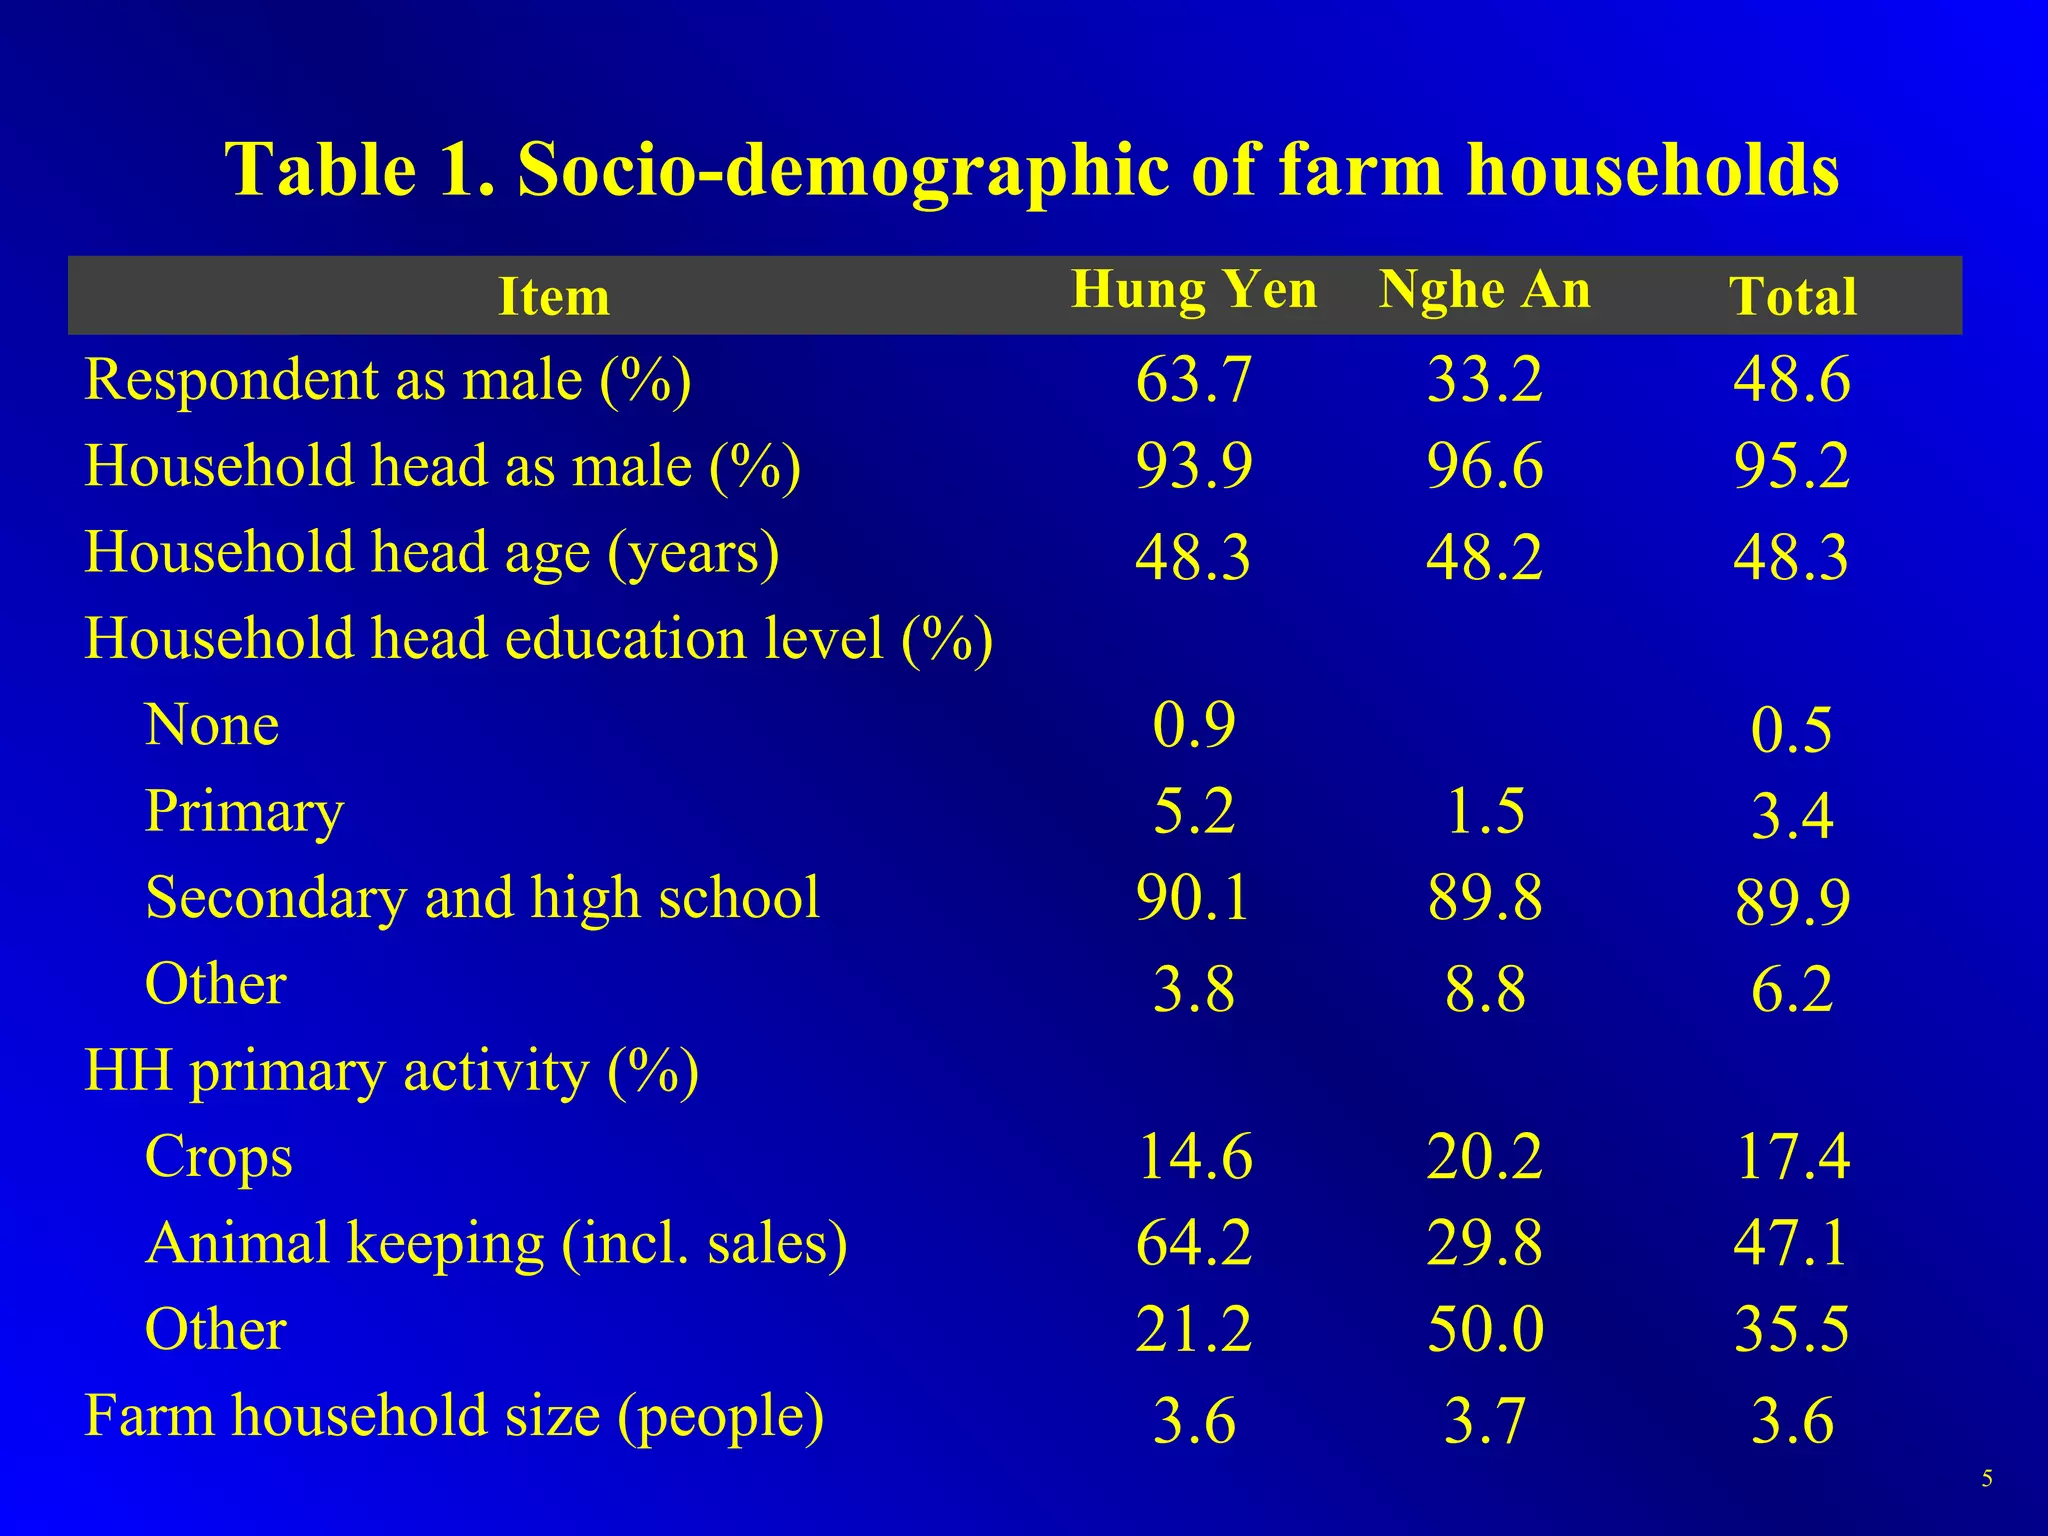
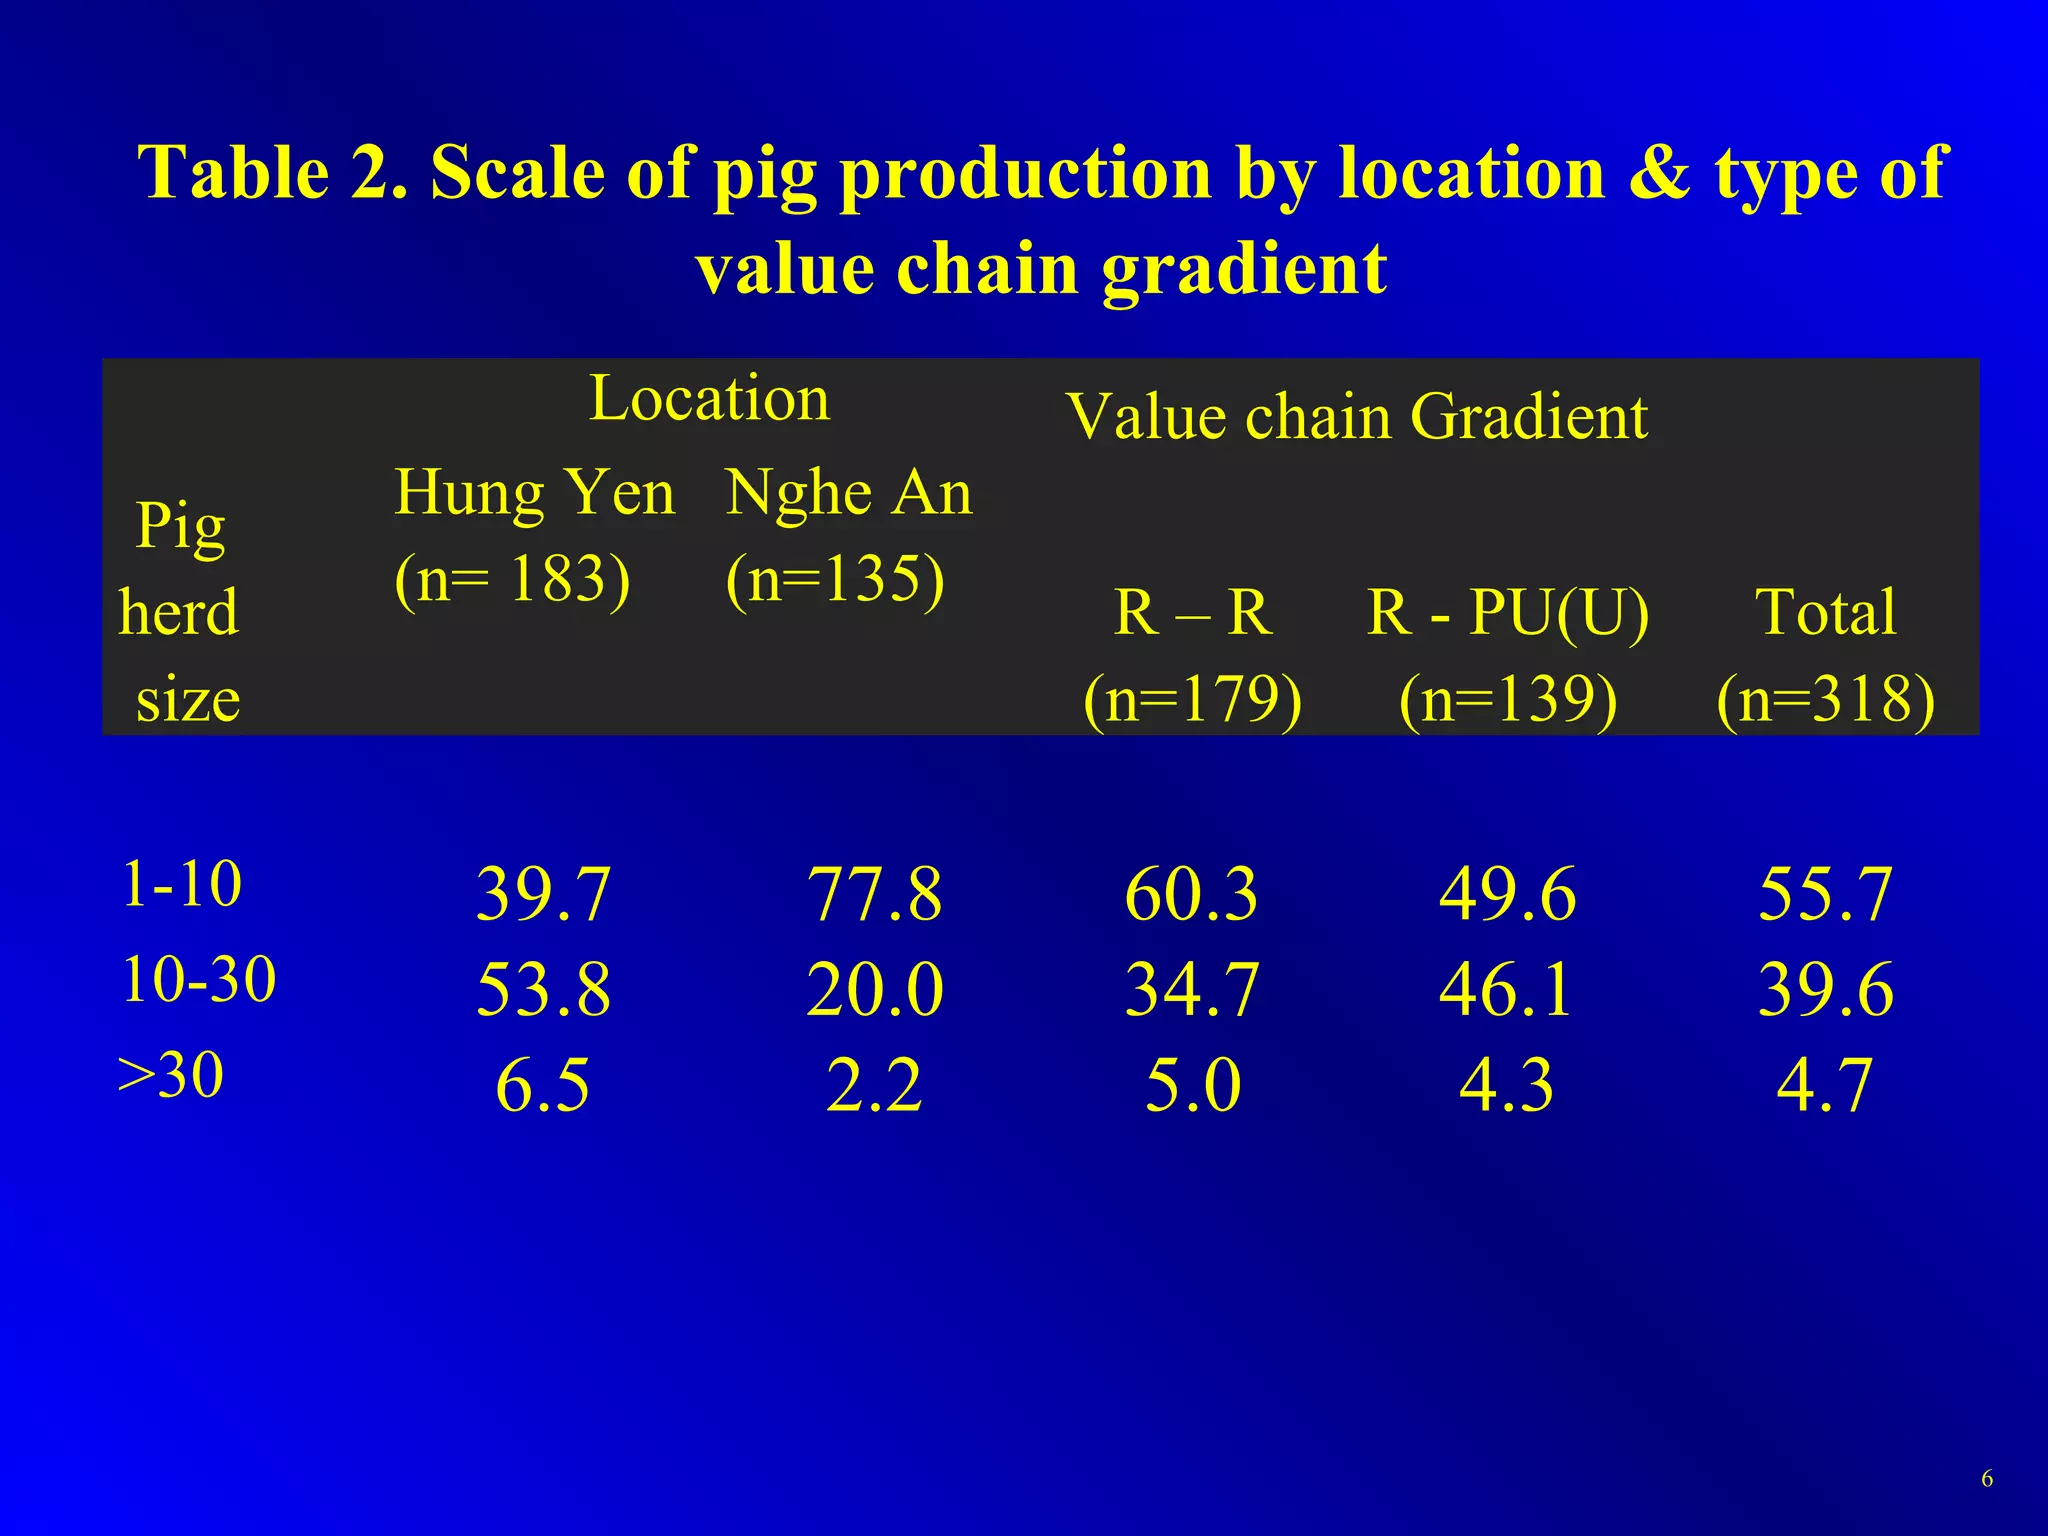
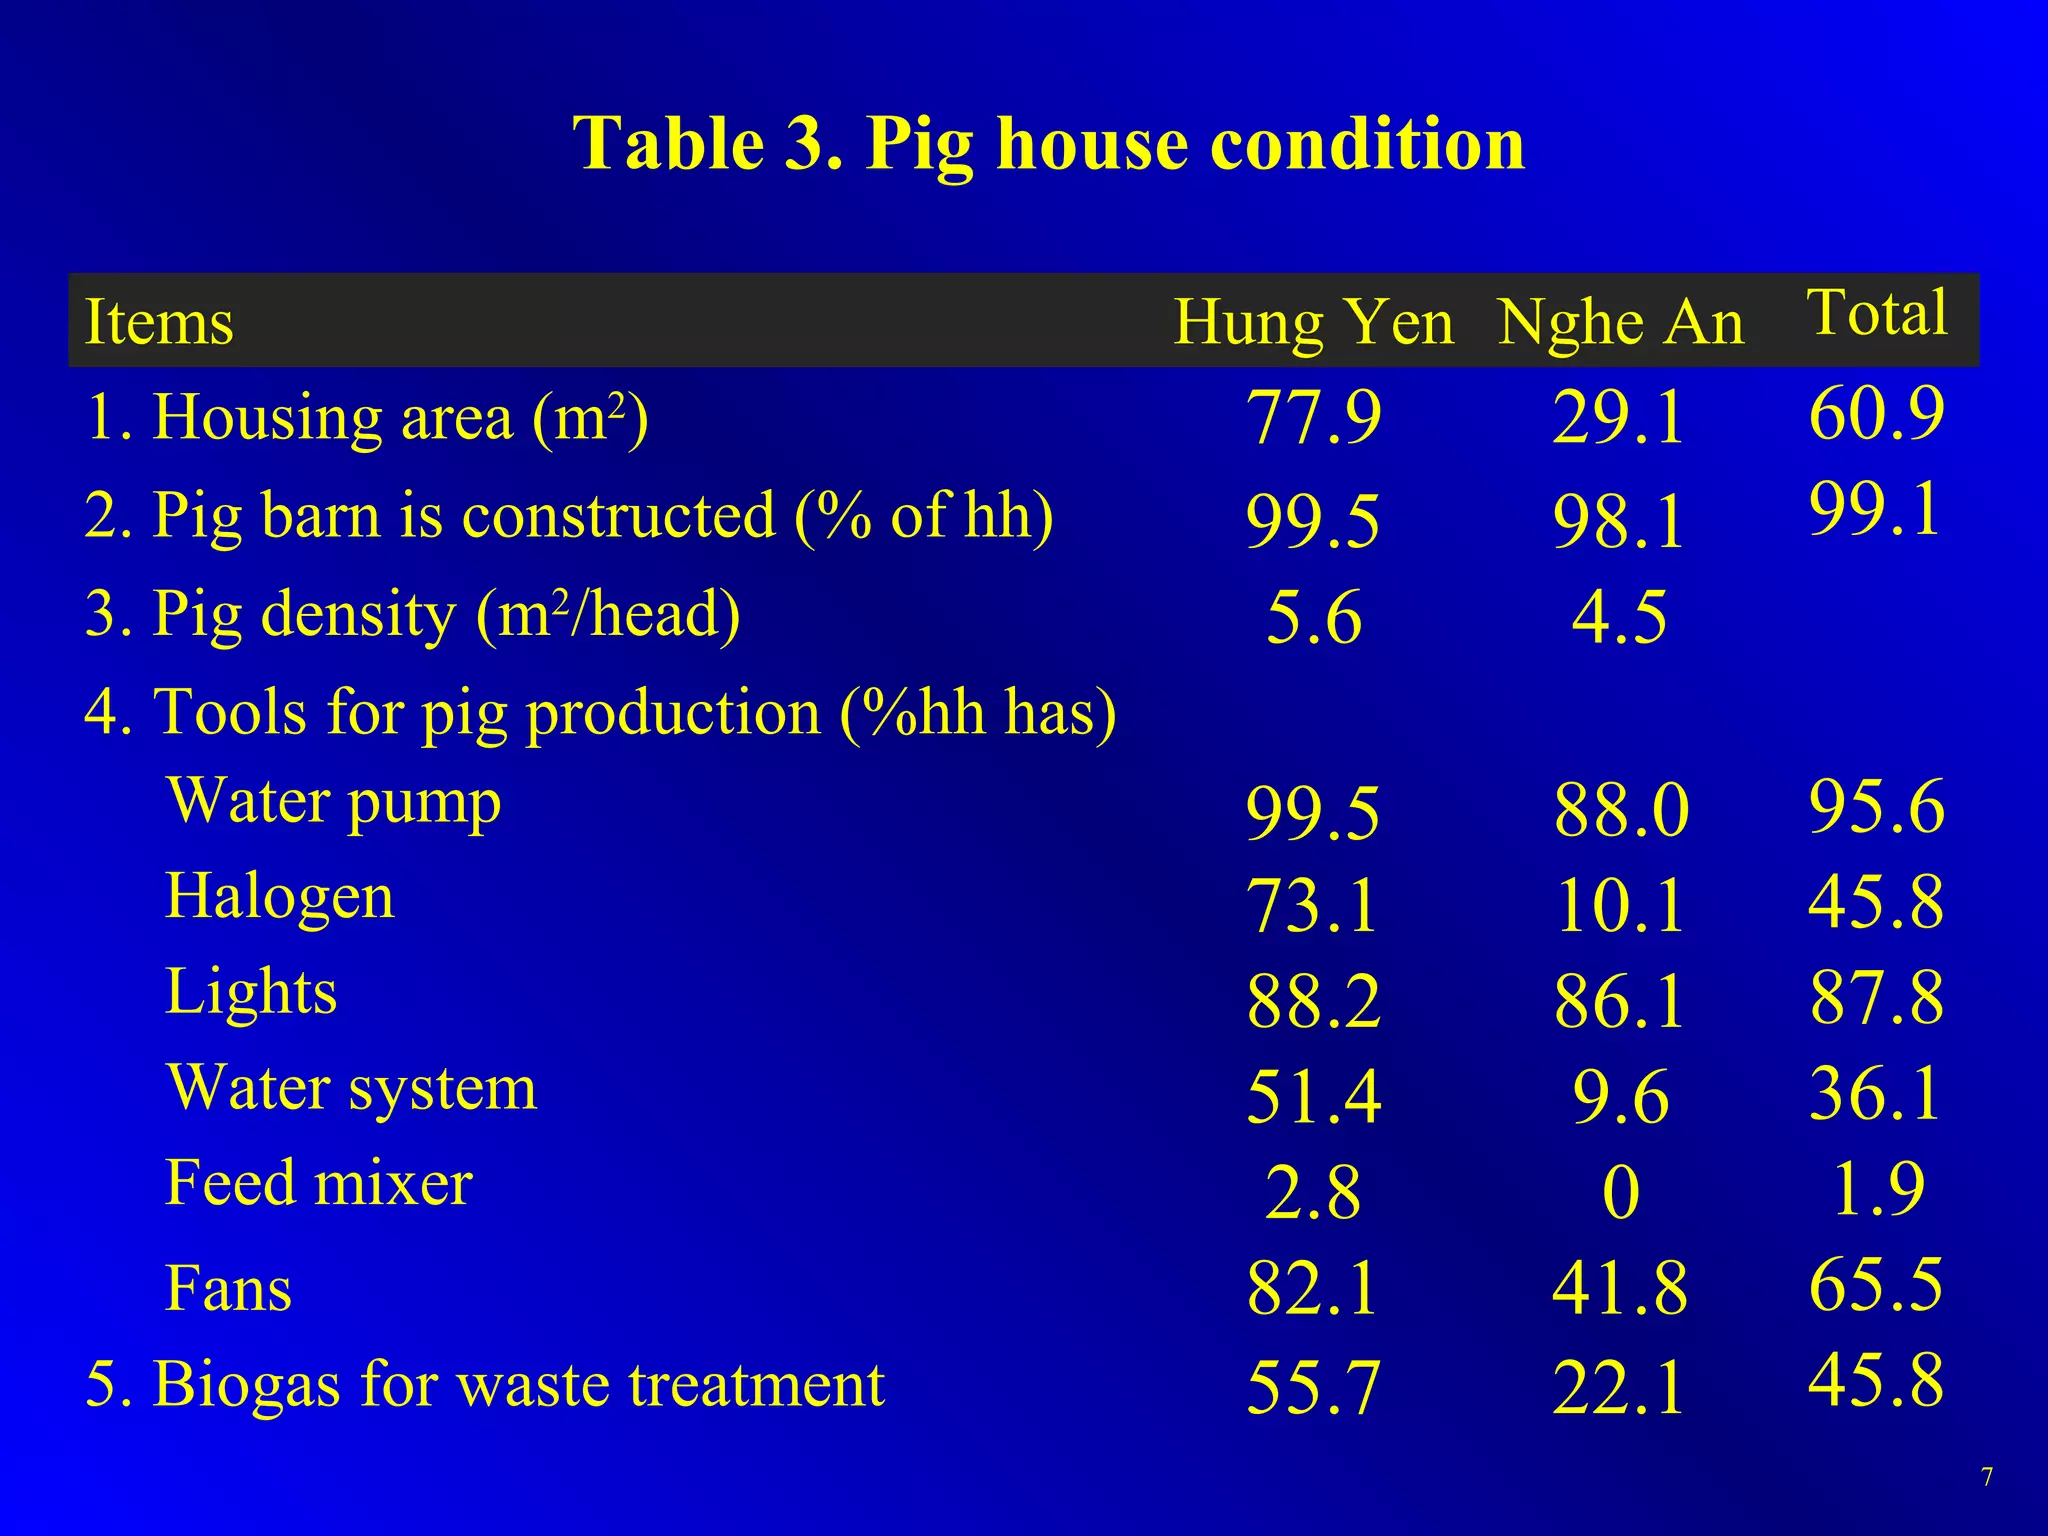
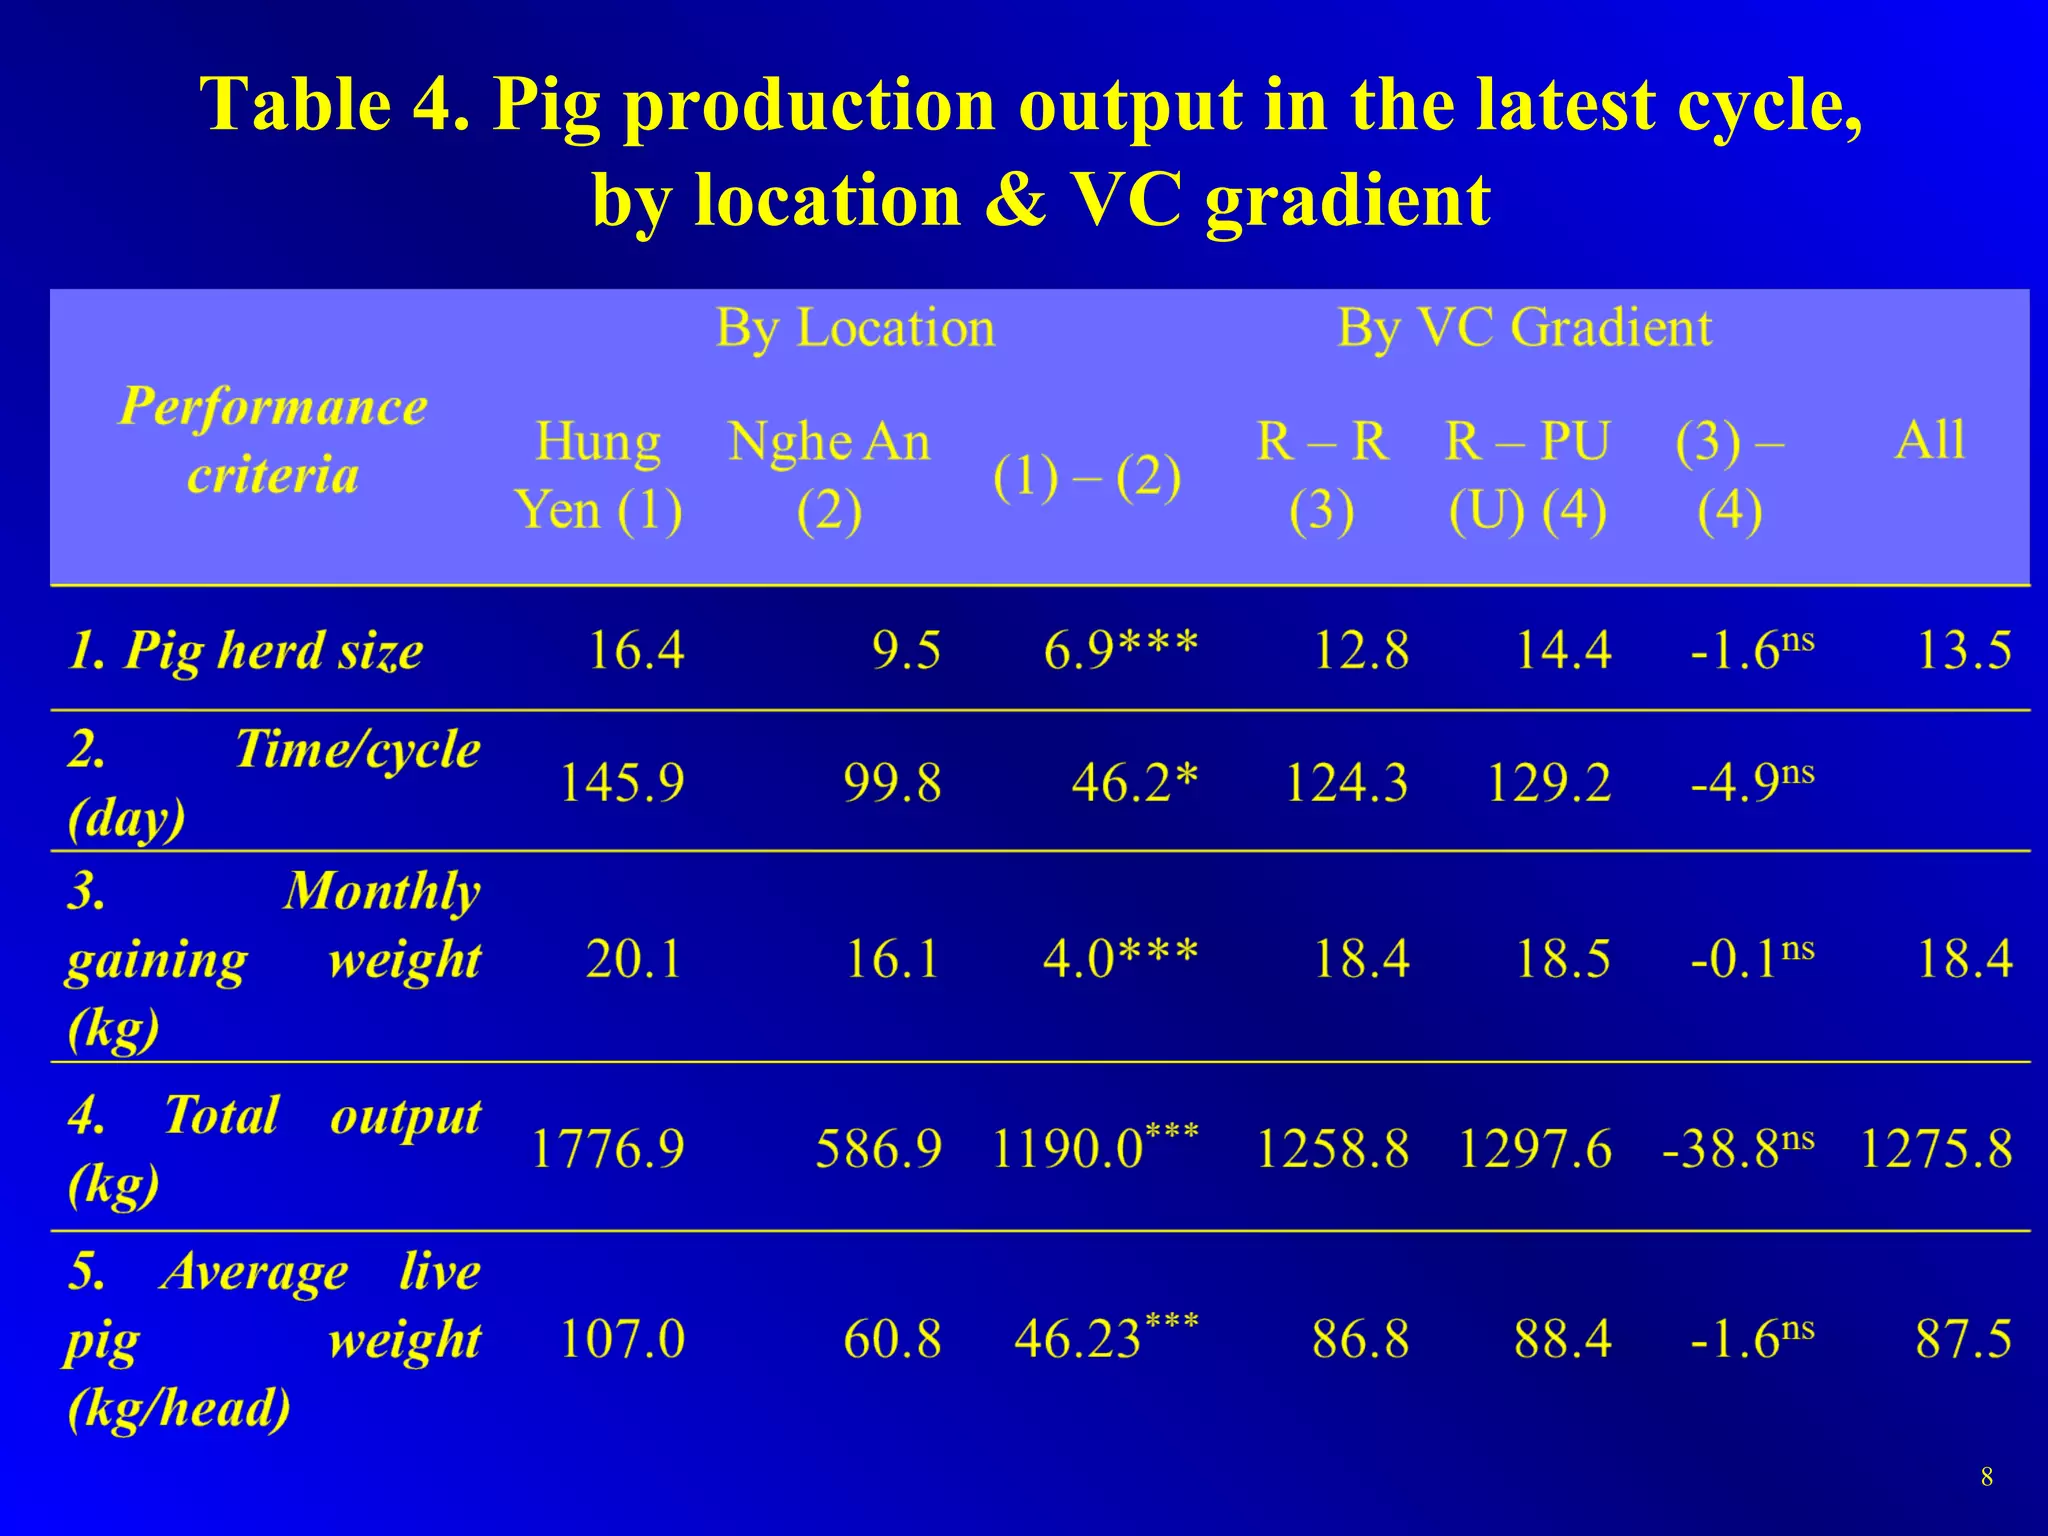
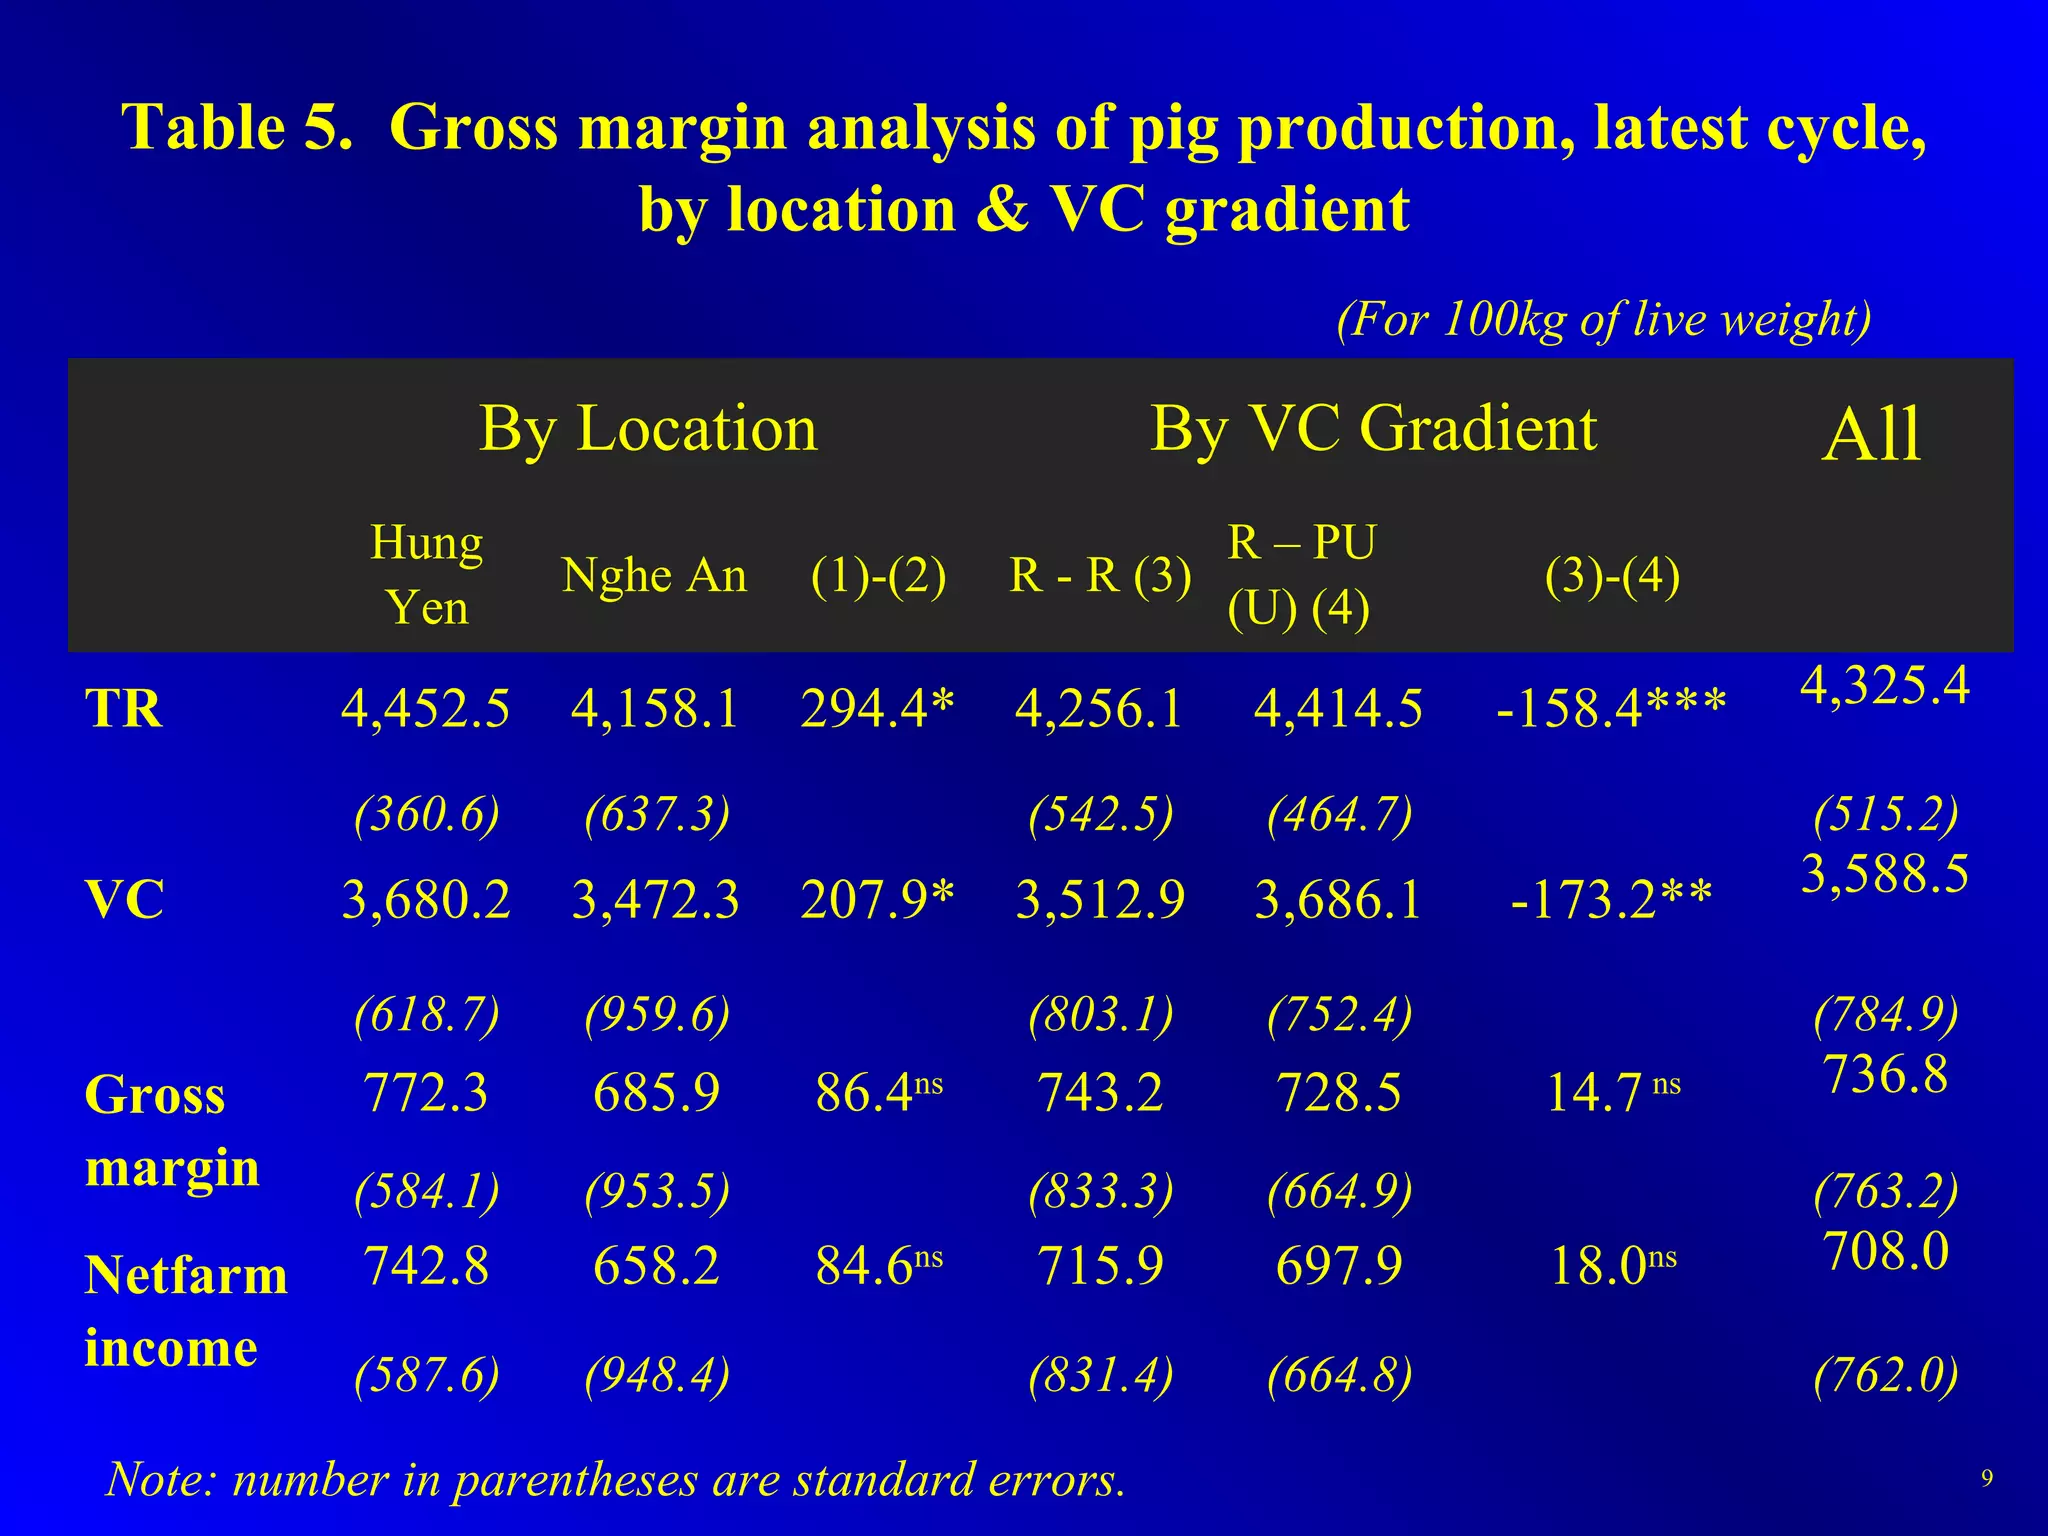
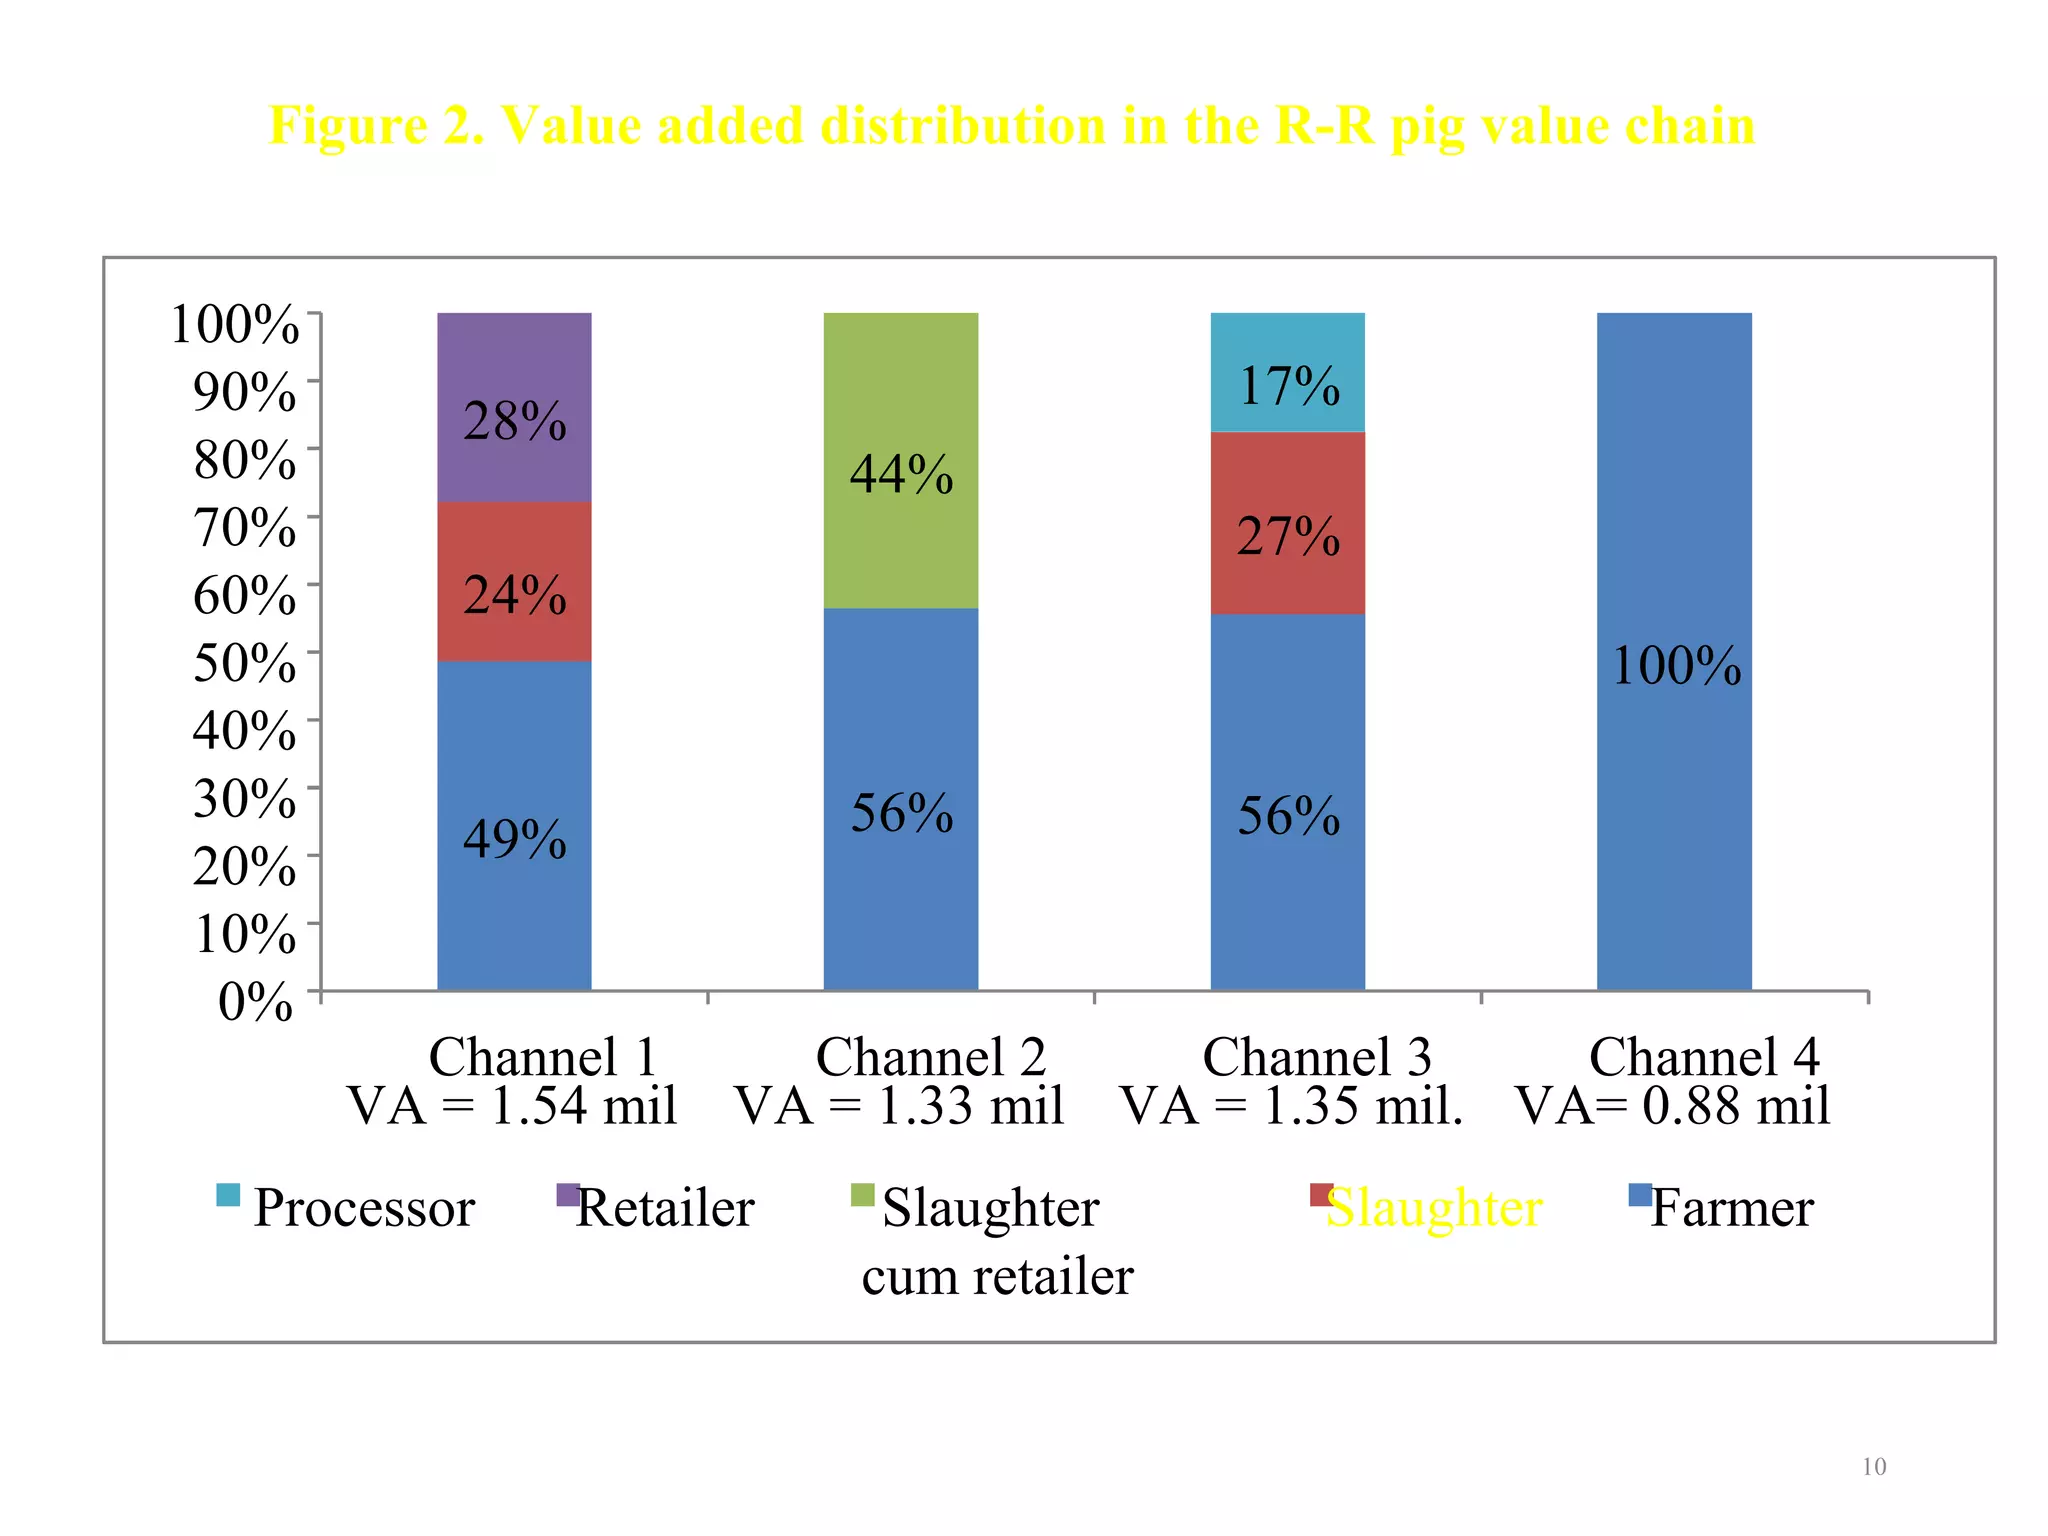
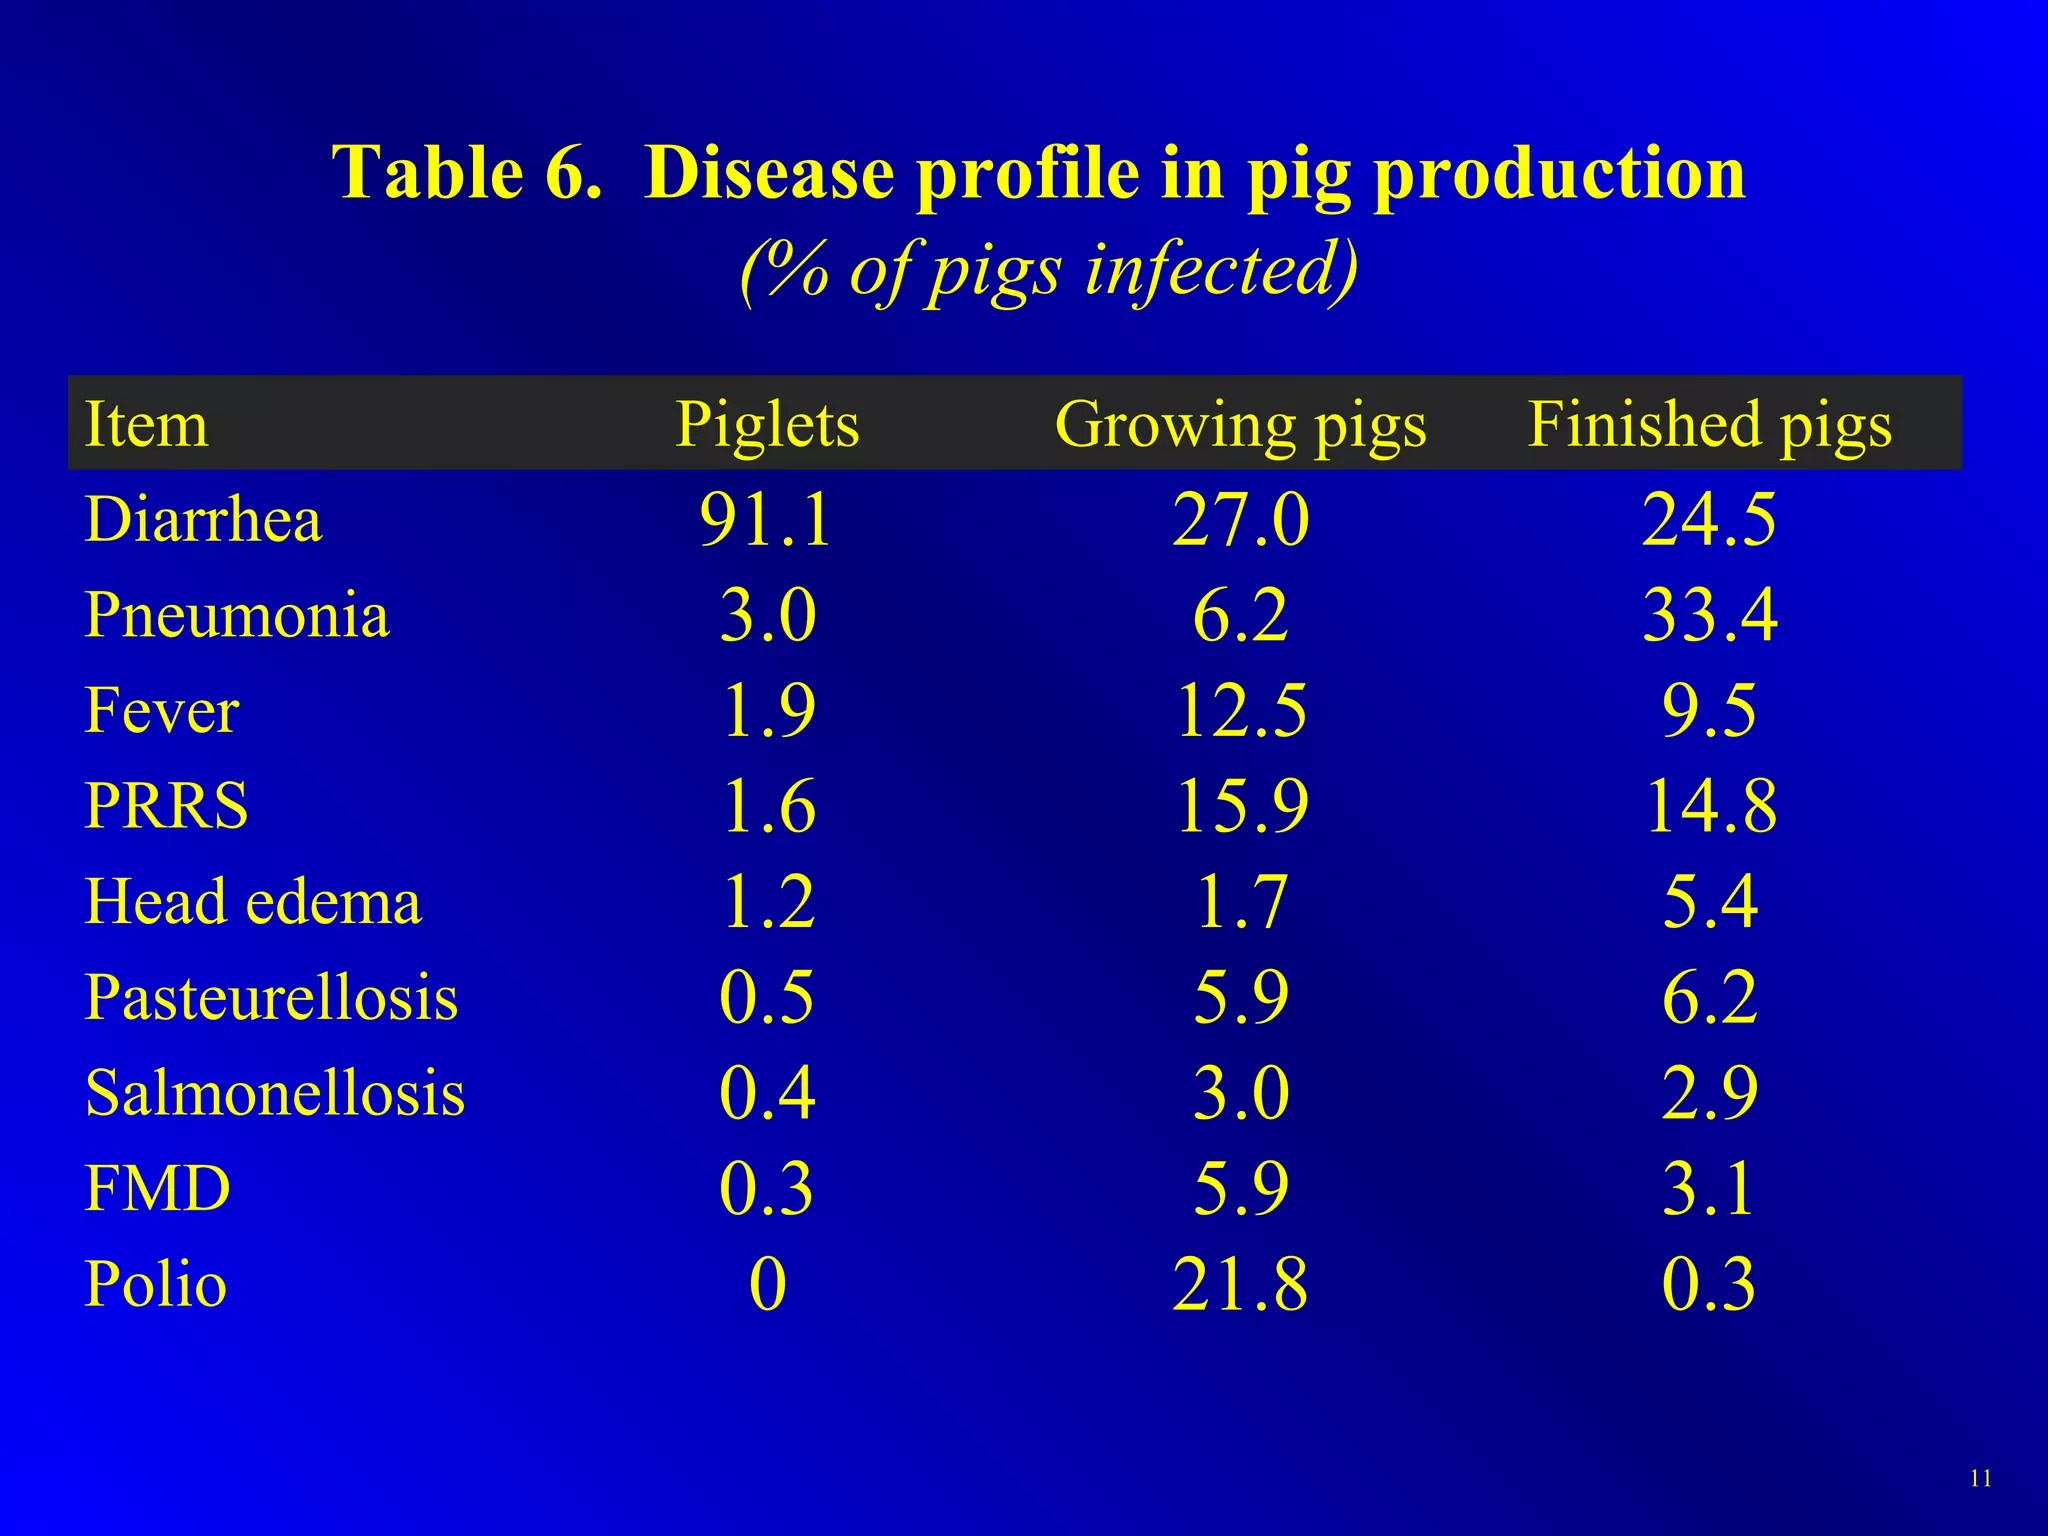
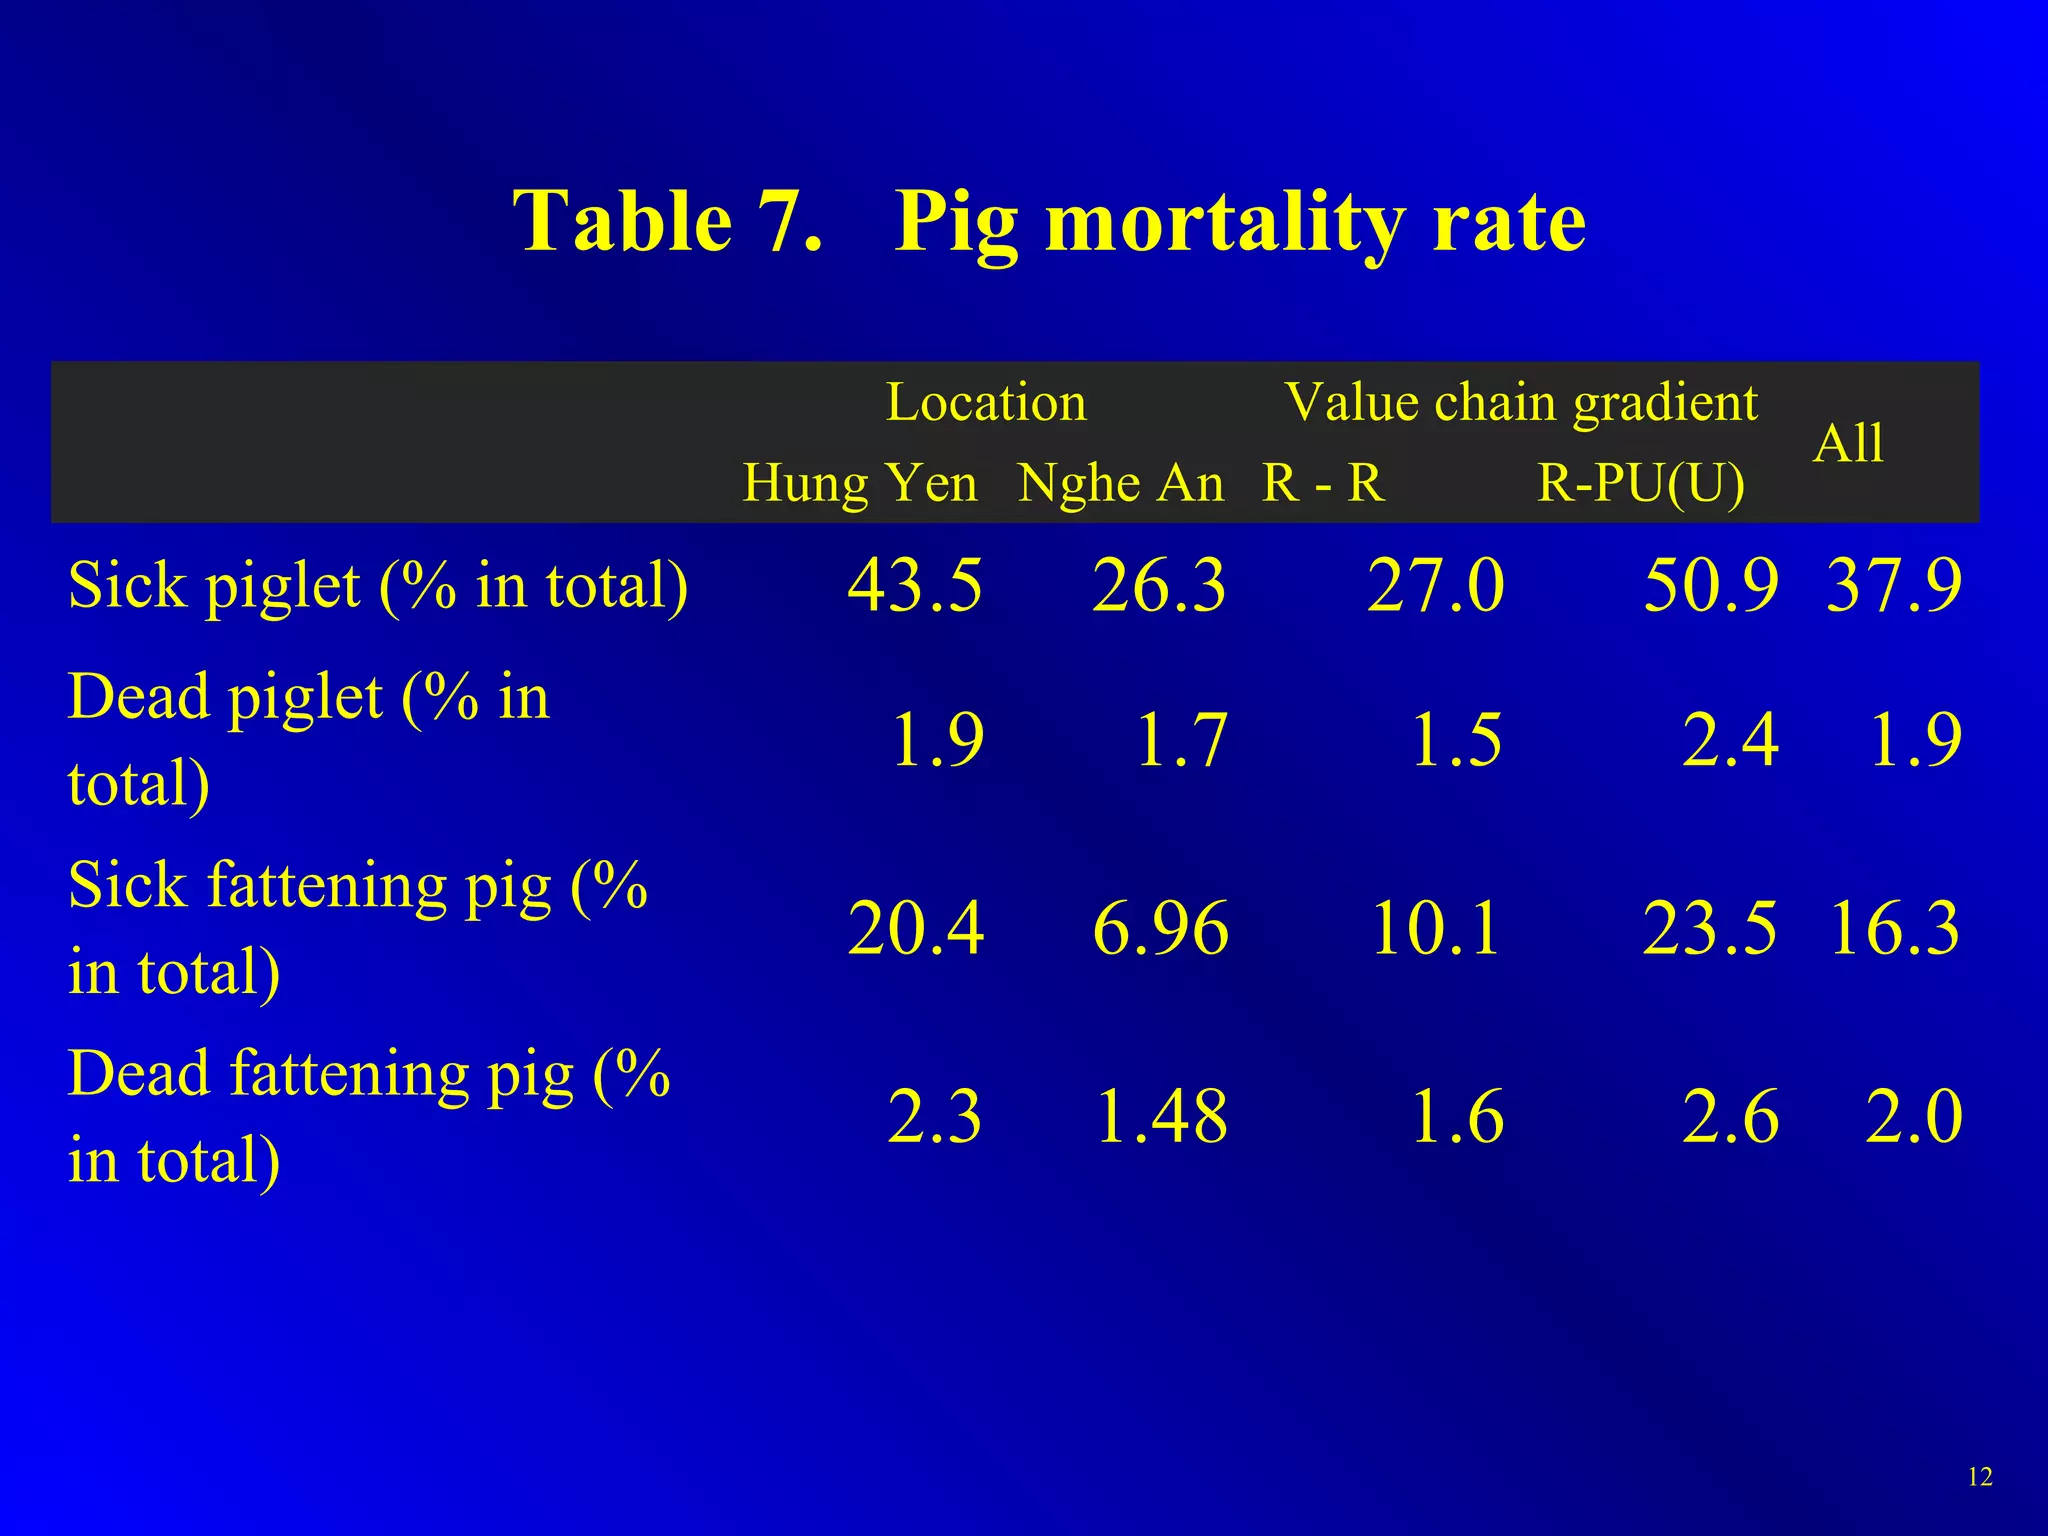
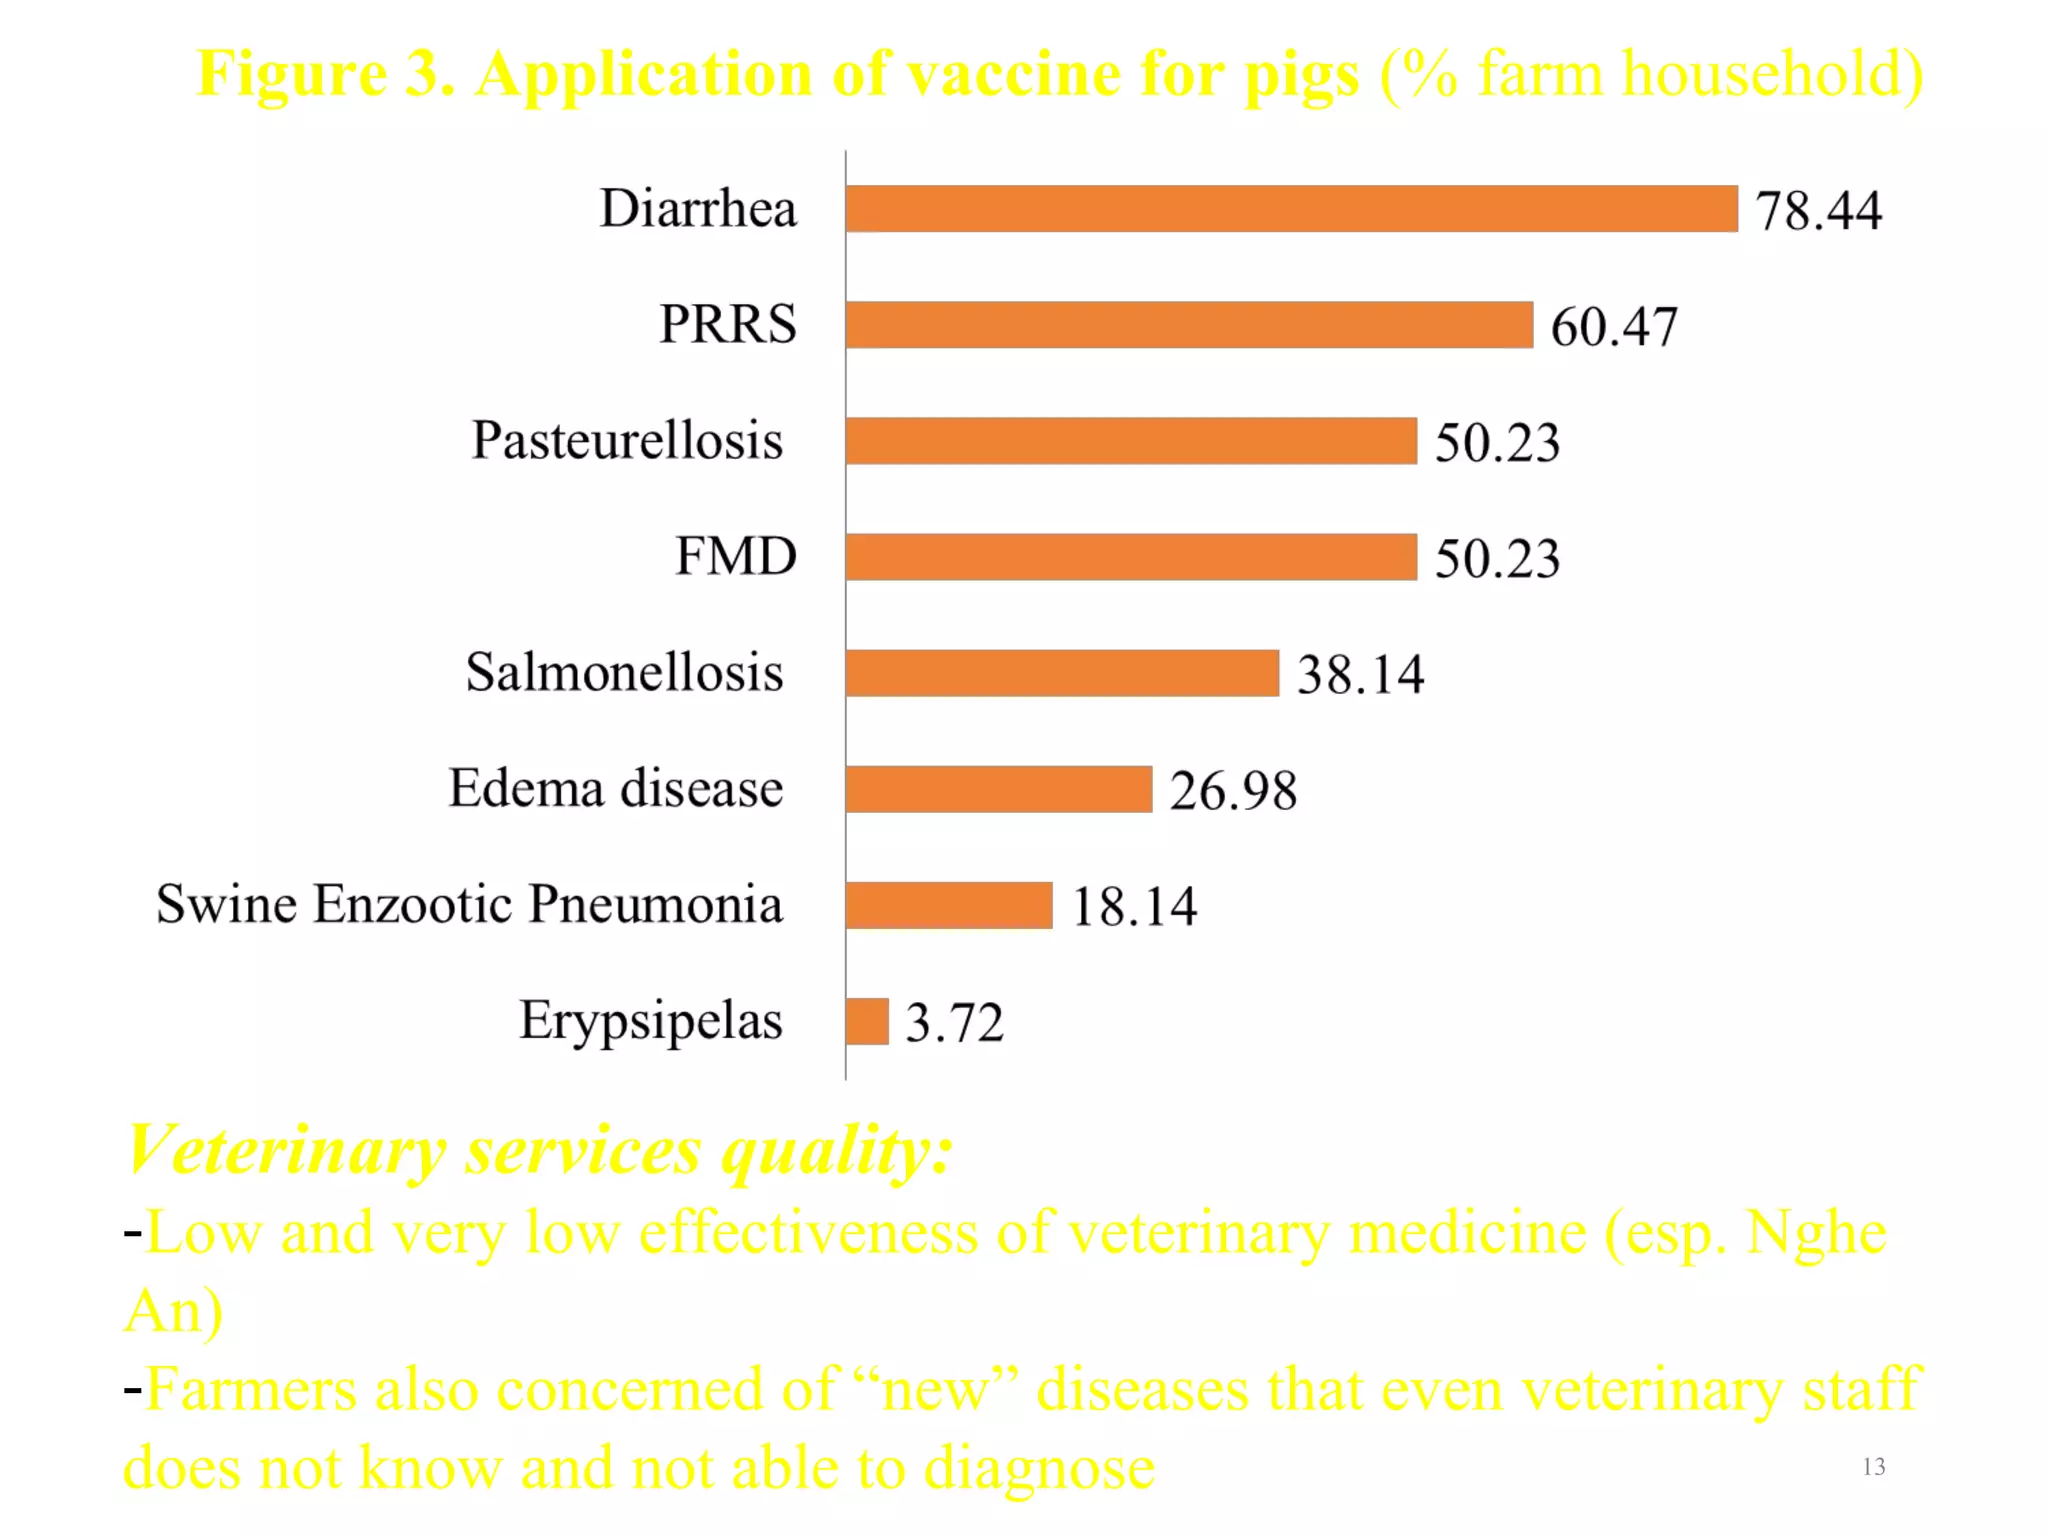
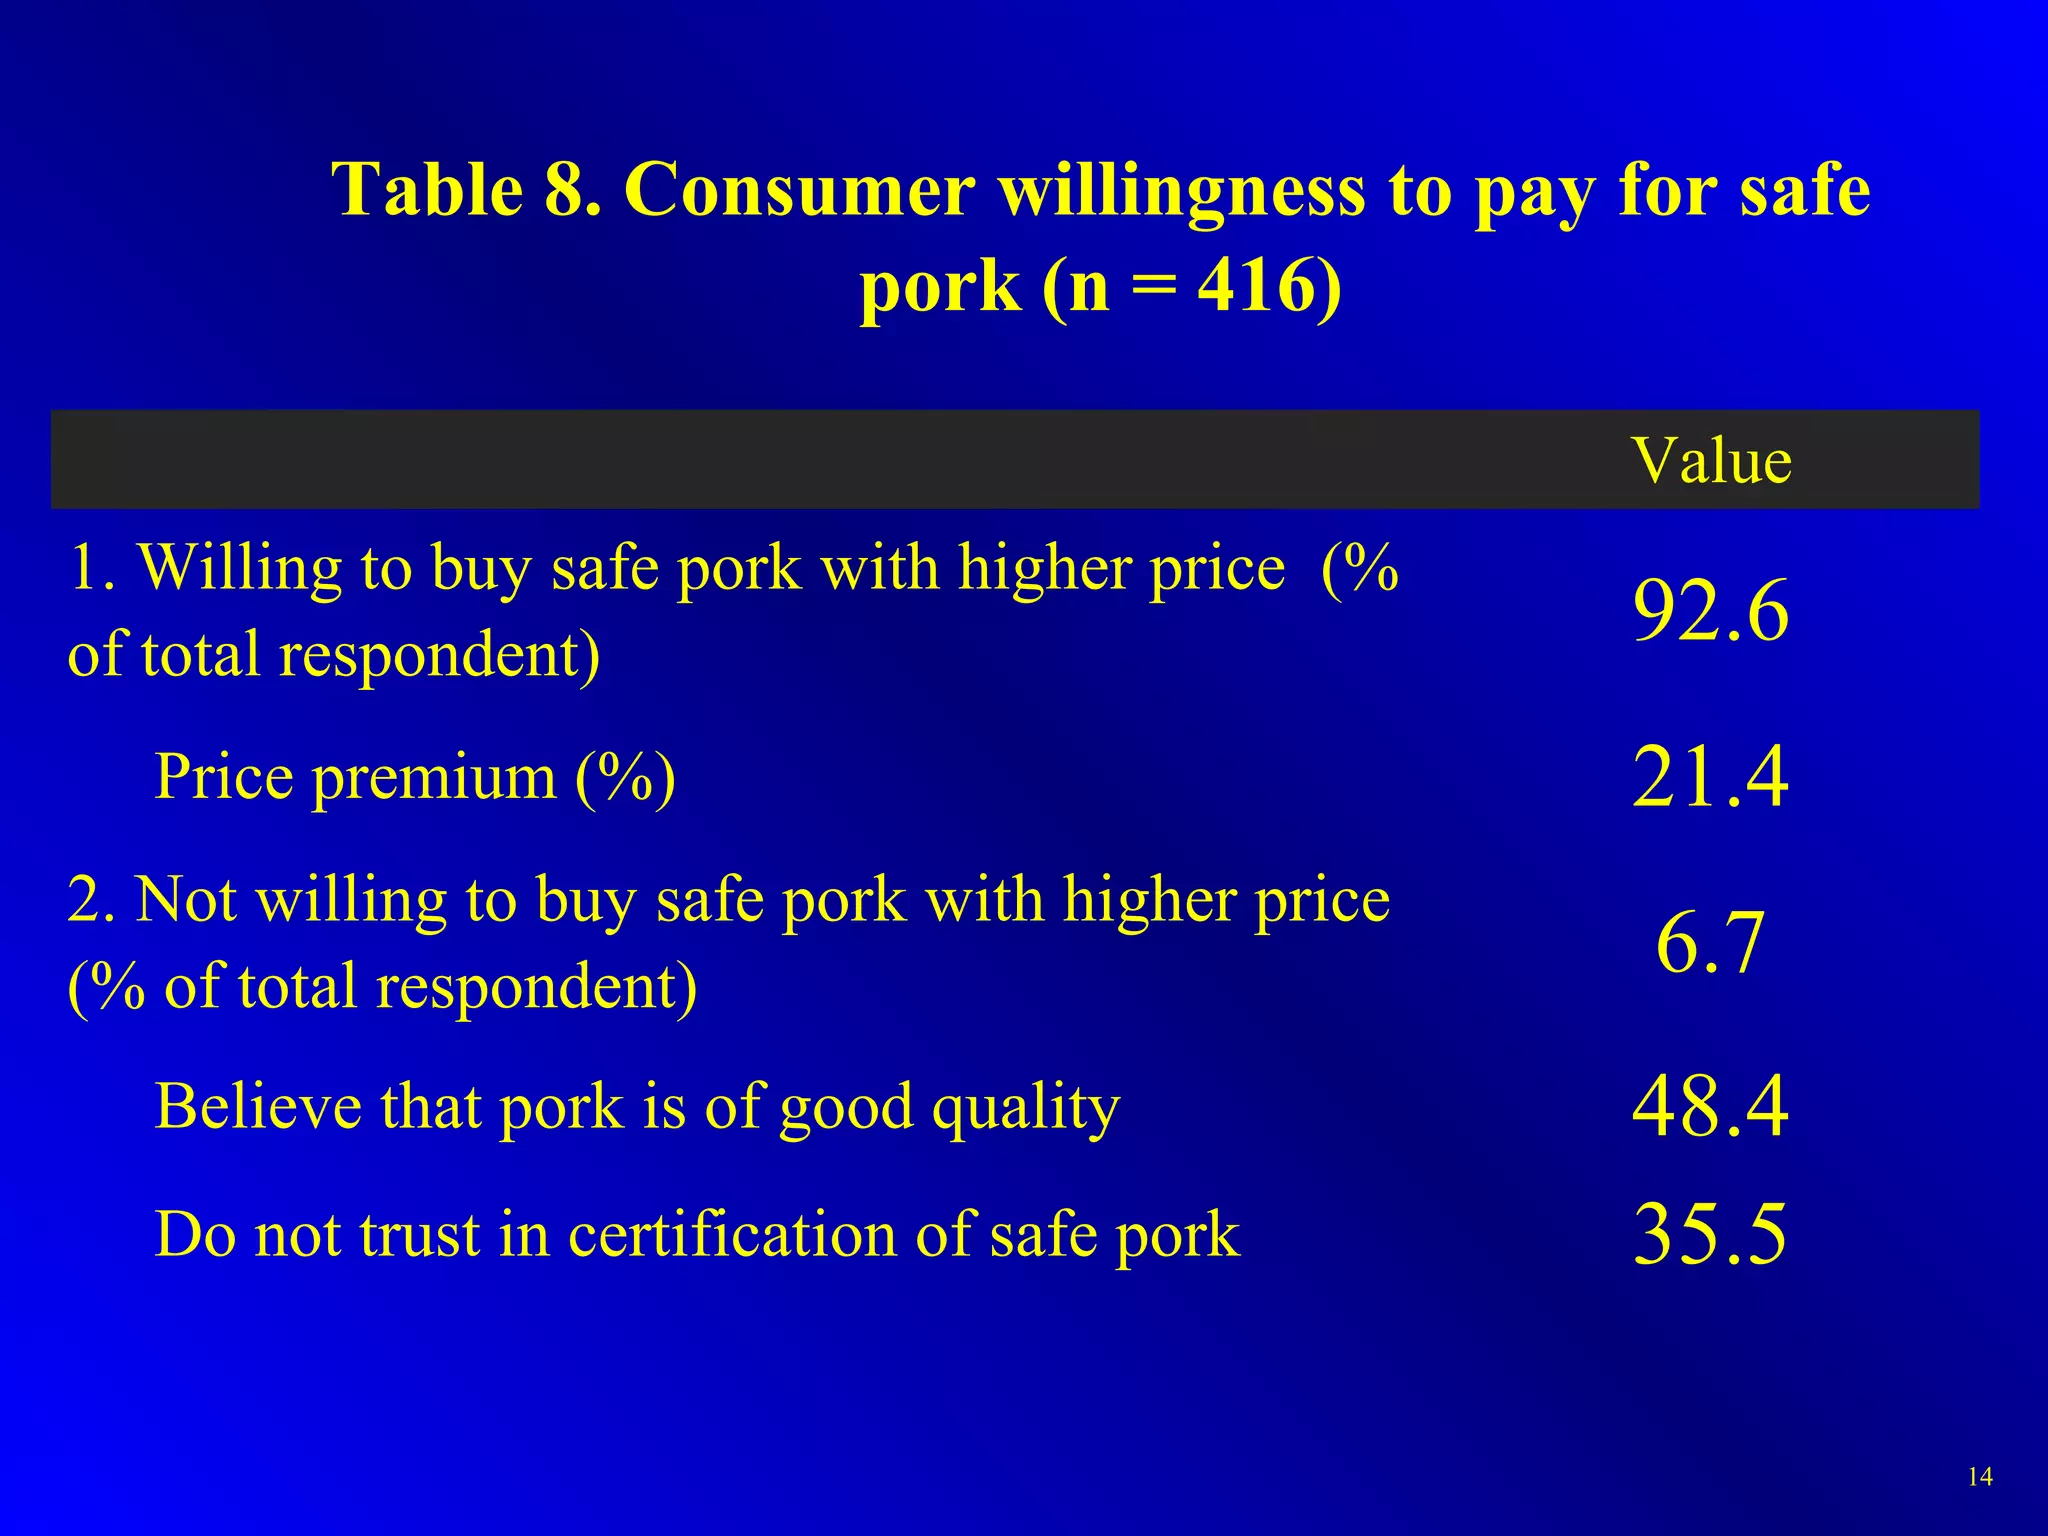
IMPROVING THE LIVELIHOOD OF SMALL
FARMERS IN THE PIG VALUE CHAIN:
EXPERIENCES IN THE NORTH OF VIETNAM
1
Pham Van Hung, VNUA
VIETNAM NATIONAL UNIVERSITY OF AGRICULTURE
(VNUA)
Regional seminar on 'Agriculture Development
for the Mekong Delta: How to Increase the
Livelihood of Farmers‘
Can Tho City, Vietnam, 24 April 2015
And
Nguyen Thi Duong Nga (VNUA), Lucia Lapar (ILRI)
Introduction
• The pig sector: 74-80% of the total meat production
in Vietnam (2000-2012)
• Small-scale production predominates (>4 million
farms of which 52% raising 1-2 pigs) (2011)
• Supplying at least 80% of Vietnam’s pork
consumption
• Pig production generates ~14% of household income
and one-fourth of total household income from
agriculture
• Little is known on the participation of smallholders
in pig value chains 2
Methodology
• Sites:
– Hung Yen: more developed production
– Nghe An: more rural and less developed pig value chain
• Sample:
– 3 districts each prov. representing different pig VC
gradients: Rural – Rural (R-R), and Rural- Peri urban/ Urban
(R-PU/U)
• Nghe An (Do Luong, Hung Nguyen, and Dien Chau)
• Hung Yen (Tien Lu, Van Giang, and Khoai Chau)
– 18 communes selected by pig density groups (low, medium,
and high)
– Total sample size is 1025 (incl.: 318/420 farmers*, 416
consumers) 3
4
41.6%
2.6%
Slaughter-
house
Collector
Processor
Retailer
Other provinces
64.8%
4.0%
55.8%
100%
31.2%
Figure 1: Map of pig value chain in Hung Yen and Nghe An
Findings
5
Item Hung Yen Nghe An Total
Respondent as male (%) 63.7 33.2 48.6
Household head as male (%) 93.9 96.6 95.2
Household head age (years) 48.3 48.2 48.3
Household head education level (%)
None 0.9 0.5
Primary 5.2 1.5 3.4
Secondary and high school 90.1 89.8 89.9
Other 3.8 8.8 6.2
HH primary activity (%)
Crops 14.6 20.2 17.4
Animal keeping (incl. sales) 64.2 29.8 47.1
Other 21.2 50.0 35.5
Farm household size (people) 3.6 3.7 3.6
Table 1. Socio-demographic of farm households
Table 2. Scale of pig production by location & type of
value chain gradient
6
 Pig 
herd
 size
Location Value chain Gradient
Total
(n=318)
Hung Yen
(n= 183)
Nghe An
(n=135) R – R
(n=179)
R - PU(U)
(n=139)
1-10  39.7 77.8 60.3 49.6 55.7
10-30  53.8 20.0 34.7 46.1 39.6
>30  6.5 2.2 5.0 4.3 4.7
Table 3. Pig house condition
7
Items Hung Yen Nghe An Total
1. Housing area (m2
) 77.9 29.1 60.9
2. Pig barn is constructed (% of hh) 99.5 98.1 99.1
3. Pig density (m2
/head) 5.6 4.5  
4. Tools for pig production (%hh has)      
Water pump 99.5 88.0 95.6
Halogen 73.1 10.1 45.8
Lights 88.2 86.1 87.8
Water system 51.4 9.6 36.1
Feed mixer 2.8 0 1.9
Fans 82.1 41.8 65.5
5. Biogas for waste treatment 55.7 22.1 45.8
Table 4. Pig production output in the latest cycle,
by location & VC gradient
8
Table 5. Gross margin analysis of pig production, latest cycle,
by location & VC gradient
9
 
By Location By VC Gradient All 
Hung 
Yen
Nghe An (1)-(2) R - R (3)
R – PU 
(U) (4)
(3)-(4)
TR 4,452.5 4,158.1 294.4* 4,256.1 4,414.5 -158.4*** 4,325.4
(360.6) (637.3)   (542.5) (464.7)   (515.2)
VC 3,680.2 3,472.3 207.9* 3,512.9 3,686.1 -173.2** 3,588.5
(618.7) (959.6)   (803.1) (752.4)   (784.9)
Gross
margin
772.3 685.9 86.4ns
743.2 728.5 14.7 ns 736.8
(584.1) (953.5)   (833.3) (664.9)   (763.2)
Netfarm
income
742.8 658.2 84.6ns
715.9 697.9 18.0ns 708.0
(587.6) (948.4)   (831.4) (664.8)   (762.0)
(For 100kg of live weight)
Note: number in parentheses are standard errors.
10
Figure 2. Value added distribution in the R-R pig value chain
49% 56% 56%
100%
24%
27%
44%
28%
17%
0%
10%
20%
30%
40%
50%
60%
70%
80%
90%
100%
Channel 1
VA = 1.54 mil
Channel 2
VA = 1.33 mil
Channel 3
VA = 1.35 mil.
Channel 4
VA= 0.88 mil
Processor Retailer Slaughter 
cum retailer
Slaughter Farmer
Table 6. Disease profile in pig production
(% of pigs infected)
11
Item Piglets Growing pigs Finished pigs
Diarrhea 91.1 27.0 24.5
Pneumonia 3.0 6.2 33.4
Fever 1.9 12.5 9.5
PRRS 1.6 15.9 14.8
Head edema 1.2 1.7 5.4
Pasteurellosis 0.5 5.9 6.2
Salmonellosis 0.4 3.0 2.9
FMD 0.3 5.9 3.1
Polio 0 21.8 0.3
Table 7. Pig mortality rate
Location Value chain gradient
All
Hung Yen Nghe An R - R R-PU(U)
Sick piglet (% in total) 43.5 26.3 27.0 50.9 37.9
Dead piglet (% in
total)
1.9 1.7 1.5 2.4 1.9
Sick fattening pig (%
in total)
20.4 6.96 10.1 23.5 16.3
Dead fattening pig (%
in total)
2.3 1.48 1.6 2.6 2.0
12
13
Figure 3. Application of vaccine for pigs (% farm household)
Veterinary services quality:
-Low and very low effectiveness of veterinary medicine (esp. Nghe
An)
-Farmers also concerned of “new” diseases that even veterinary staff
does not know and not able to diagnose
Table 8. Consumer willingness to pay for safe
pork (n = 416)
Value
1. Willing to buy safe pork with higher price (%
of total respondent)
92.6
Price premium (%) 21.4
2. Not willing to buy safe pork with higher price
(% of total respondent)
6.7
Believe that pork is of good quality 48.4
Do not trust in certification of safe pork 35.5
14
Conclusion
• Generally, pig smallholders in Vietnam still perform
a weak market orientation
• Lacking of info. about markets and constraints in
resources including knowledge and capabilities
discouraging farmers to participate successfully in
the pig VCs
• Moreover, institutional issues should be taken into
consideration (not be covered in this paper)
• >> Government initiatives in facilitating innovation
and upgrading are conditional for the development
of pig VCs
15
Policy implications
• Government to improve small pig farmers’ capability in
production as well as veterinary network
• Strengthening government mgt. on I/O markets
• Establishing a effective & transparent system of
quarantine & certification of meat
• Encouraging and facilitating the private sector to
participate in the VCs
• Raising awareness of food safety for consumers and other
actors while establishing a market information system
• Reviewing policies & regulations to be consistent and
transparent 16
THANK YOU!
17

Improving the livelihood of small farmers in the pig value chain: Experiences in the north of Vietnam

  • 1.
    IMPROVING THE LIVELIHOODOF SMALL FARMERS IN THE PIG VALUE CHAIN: EXPERIENCES IN THE NORTH OF VIETNAM 1 Pham Van Hung, VNUA VIETNAM NATIONAL UNIVERSITY OF AGRICULTURE (VNUA) Regional seminar on 'Agriculture Development for the Mekong Delta: How to Increase the Livelihood of Farmers‘ Can Tho City, Vietnam, 24 April 2015 And Nguyen Thi Duong Nga (VNUA), Lucia Lapar (ILRI)
  • 2.
    Introduction • The pigsector: 74-80% of the total meat production in Vietnam (2000-2012) • Small-scale production predominates (>4 million farms of which 52% raising 1-2 pigs) (2011) • Supplying at least 80% of Vietnam’s pork consumption • Pig production generates ~14% of household income and one-fourth of total household income from agriculture • Little is known on the participation of smallholders in pig value chains 2
  • 3.
    Methodology • Sites: – HungYen: more developed production – Nghe An: more rural and less developed pig value chain • Sample: – 3 districts each prov. representing different pig VC gradients: Rural – Rural (R-R), and Rural- Peri urban/ Urban (R-PU/U) • Nghe An (Do Luong, Hung Nguyen, and Dien Chau) • Hung Yen (Tien Lu, Van Giang, and Khoai Chau) – 18 communes selected by pig density groups (low, medium, and high) – Total sample size is 1025 (incl.: 318/420 farmers*, 416 consumers) 3
  • 4.
  • 5.
    5 Item Hung YenNghe An Total Respondent as male (%) 63.7 33.2 48.6 Household head as male (%) 93.9 96.6 95.2 Household head age (years) 48.3 48.2 48.3 Household head education level (%) None 0.9 0.5 Primary 5.2 1.5 3.4 Secondary and high school 90.1 89.8 89.9 Other 3.8 8.8 6.2 HH primary activity (%) Crops 14.6 20.2 17.4 Animal keeping (incl. sales) 64.2 29.8 47.1 Other 21.2 50.0 35.5 Farm household size (people) 3.6 3.7 3.6 Table 1. Socio-demographic of farm households
  • 6.
    Table 2. Scaleof pig production by location & type of value chain gradient 6  Pig  herd  size Location Value chain Gradient Total (n=318) Hung Yen (n= 183) Nghe An (n=135) R – R (n=179) R - PU(U) (n=139) 1-10  39.7 77.8 60.3 49.6 55.7 10-30  53.8 20.0 34.7 46.1 39.6 >30  6.5 2.2 5.0 4.3 4.7
  • 7.
    Table 3. Pighouse condition 7 Items Hung Yen Nghe An Total 1. Housing area (m2 ) 77.9 29.1 60.9 2. Pig barn is constructed (% of hh) 99.5 98.1 99.1 3. Pig density (m2 /head) 5.6 4.5   4. Tools for pig production (%hh has)       Water pump 99.5 88.0 95.6 Halogen 73.1 10.1 45.8 Lights 88.2 86.1 87.8 Water system 51.4 9.6 36.1 Feed mixer 2.8 0 1.9 Fans 82.1 41.8 65.5 5. Biogas for waste treatment 55.7 22.1 45.8
  • 8.
    Table 4. Pigproduction output in the latest cycle, by location & VC gradient 8
  • 9.
    Table 5. Grossmargin analysis of pig production, latest cycle, by location & VC gradient 9   By Location By VC Gradient All  Hung  Yen Nghe An (1)-(2) R - R (3) R – PU  (U) (4) (3)-(4) TR 4,452.5 4,158.1 294.4* 4,256.1 4,414.5 -158.4*** 4,325.4 (360.6) (637.3)   (542.5) (464.7)   (515.2) VC 3,680.2 3,472.3 207.9* 3,512.9 3,686.1 -173.2** 3,588.5 (618.7) (959.6)   (803.1) (752.4)   (784.9) Gross margin 772.3 685.9 86.4ns 743.2 728.5 14.7 ns 736.8 (584.1) (953.5)   (833.3) (664.9)   (763.2) Netfarm income 742.8 658.2 84.6ns 715.9 697.9 18.0ns 708.0 (587.6) (948.4)   (831.4) (664.8)   (762.0) (For 100kg of live weight) Note: number in parentheses are standard errors.
  • 10.
    10 Figure 2. Valueadded distribution in the R-R pig value chain 49% 56% 56% 100% 24% 27% 44% 28% 17% 0% 10% 20% 30% 40% 50% 60% 70% 80% 90% 100% Channel 1 VA = 1.54 mil Channel 2 VA = 1.33 mil Channel 3 VA = 1.35 mil. Channel 4 VA= 0.88 mil Processor Retailer Slaughter  cum retailer Slaughter Farmer
  • 11.
    Table 6. Diseaseprofile in pig production (% of pigs infected) 11 Item Piglets Growing pigs Finished pigs Diarrhea 91.1 27.0 24.5 Pneumonia 3.0 6.2 33.4 Fever 1.9 12.5 9.5 PRRS 1.6 15.9 14.8 Head edema 1.2 1.7 5.4 Pasteurellosis 0.5 5.9 6.2 Salmonellosis 0.4 3.0 2.9 FMD 0.3 5.9 3.1 Polio 0 21.8 0.3
  • 12.
    Table 7. Pigmortality rate Location Value chain gradient All Hung Yen Nghe An R - R R-PU(U) Sick piglet (% in total) 43.5 26.3 27.0 50.9 37.9 Dead piglet (% in total) 1.9 1.7 1.5 2.4 1.9 Sick fattening pig (% in total) 20.4 6.96 10.1 23.5 16.3 Dead fattening pig (% in total) 2.3 1.48 1.6 2.6 2.0 12
  • 13.
    13 Figure 3. Applicationof vaccine for pigs (% farm household) Veterinary services quality: -Low and very low effectiveness of veterinary medicine (esp. Nghe An) -Farmers also concerned of “new” diseases that even veterinary staff does not know and not able to diagnose
  • 14.
    Table 8. Consumerwillingness to pay for safe pork (n = 416) Value 1. Willing to buy safe pork with higher price (% of total respondent) 92.6 Price premium (%) 21.4 2. Not willing to buy safe pork with higher price (% of total respondent) 6.7 Believe that pork is of good quality 48.4 Do not trust in certification of safe pork 35.5 14
  • 15.
    Conclusion • Generally, pigsmallholders in Vietnam still perform a weak market orientation • Lacking of info. about markets and constraints in resources including knowledge and capabilities discouraging farmers to participate successfully in the pig VCs • Moreover, institutional issues should be taken into consideration (not be covered in this paper) • >> Government initiatives in facilitating innovation and upgrading are conditional for the development of pig VCs 15
  • 16.
    Policy implications • Governmentto improve small pig farmers’ capability in production as well as veterinary network • Strengthening government mgt. on I/O markets • Establishing a effective & transparent system of quarantine & certification of meat • Encouraging and facilitating the private sector to participate in the VCs • Raising awareness of food safety for consumers and other actors while establishing a market information system • Reviewing policies & regulations to be consistent and transparent 16
  • 17.

Editor's Notes

  • #5 Mapping of the pig value chain
  • #6 Farmer profile
  • #7 Scale of production. Tổng có 319 hộ nhưng khi phân loại bán theo R_R, R_PU(U) thì có 1 hộ bán cho cả 2 loại hộ là thương lái và giết mổ địa phương nên loại 1 hộ
  • #8 Basic pig production infrastructure: The pig density in both provinces is fairly low. The reason is that farmers remained some slots of their barns empty due to low pig prices during the survey time.
  • #9 Production performance: There is no significant difference in these performance criteria in pig production between two types of value chain gradient
  • #10 Cost and income from pig production: Even though the variable costs are different between locations and value chain gradients, gross margins and net farm incomes are not statistically different. It could be seen that net farm incomes from pig production in Nghe An varied drastically, with farmers incurring lost in the last pig cycle
  • #11 Value added along the pig value chain: On average, farmers generated a value added of approximately VND 750,000 per 100 kg pig (live weight), accounting for about half of value added in the chain
  • #12 Disease & farmer capability to respond: farmers reported that PRRS, FMD, head edema are of the most serious diseases affecting pigs (hamper growth, prolong time cycle, and death in pig production).
  • #13 In 2012, about 2% of piglets and growing/fattening pigs were dead because of diseases (Table 7). This incurred a higher cost for production.
  • #14 Farmers (especially in Hung Yen) reported they were lack of knowledge and skills in diagnosing and curing diseases in a timely and effectively fashion. In addition, about 8% of farmers sold sick pigs away or slaughtered for home consumption, and about 8% of farmers threw dead sick pigs away. These practices might be a source of disease spread.
  • #15 Food safety. Food safety in pork supply has become of much concern recently with use of antibiotic substances and Beta-agonist, with residues excessed the permission, and it is believed to have negative effect to human health Price premium about 20% higher >> This is likely to be a market opportunity for pig farmers.