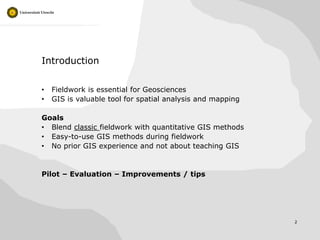
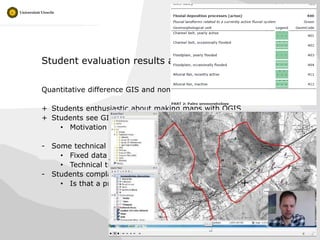
1. Improving fieldwork with GIS
quantitative exploration, data
management and digital mapping
Wouter Marra1, Koko Alberti1, Liesbeth van de Grint2 &
Derek Karssenberg1
1 Dep. Physical Geography
2 Centre for education and learning
Faculty of Geosciences
Funders:
Stimuleringsfonds Onderwijs, Utrecht University and Faculty of Geosciences
2. Introduction
• Fieldwork is essential for Geosciences
• GIS is valuable tool for spatial analysis and mapping
Goals
• Blend classic fieldwork with quantitative GIS methods
• Easy-to-use GIS methods during fieldwork
• No prior GIS experience and not about teaching GIS
Pilot – Evaluation – Improvements / tips
2
3. Fieldwork French Alps
• First-year BSc, final quarter
• Individual research areas (~16 km²)
• Geology and geomorphology
• Staff visits students occasionally
3
4. Fieldwork French Alps
• First-year BSc, final quarter
• Individual research areas (~16 km²)
• Geology and geomorphology
• Staff visits students occasionally
4
5. Learning goals – changed workflow
Learning goal Change Benefit
Preparation
Explore area remotely GoogleEarth & QGIS More ways to view area
Formulate hypothesis Use GIS data Quantitative evidence
Fieldwork
Collect field data Unchanged Freedom and creativity in fieldbook
Analyse Excel & QGIS Spatial patterns, make map
Interpret QGIS Sat. image and DEM - extra data
Map QGIS Use data sources, logical workflow
7. Learning goals – changed workflow
Learning goal Change Benefit
Preparation
Explore area remotely GoogleEarth & QGIS More ways to view area
Formulate hypothesis Use GIS data Quantitative evidence
Fieldwork
Collect field data Unchanged Freedom and creativity in fieldbook
Analyse Excel & QGIS Spatial patterns, make map
Interpret QGIS Sat. image and DEM - extra data
Map QGIS Use data sources, logical workflow
8. Paper maps Fieldbook
Fieldmap
Digital fieldbook (excel)
+
++
+
Neat map
+
++
+
Digital map QGIS
Field Accommodation
ObservationsGPS
GIS DataMapping workflow
9. Evaluations
• All students had new preparation (70)
• 23 students used GIS in the field
• Questionnaires before and after fieldwork
• Interview after fieldwork
• Difference between groups?
• Easier acquainted, useful hypotheses?
• Problems / drawbacks
• Attitude towards GIS
• Staff opinions
9
11. Student evaluation results after the fieldwork
Quantitative difference GIS and non-GIS users was hard to tell
+ Students enthusiastic about making maps with QGIS
+ Students see GIS as a relevant skill (also some that don’t like it)
• Motivation
- Some technical issues
• Fixed data structure, prescribed legend,
• Technical tutorial, and screencasts
- Students complain that hypotheses are superseded
• Is that a problem or a valuable lesson?
11
12. Staff evaluation
+ Results above expectation
- Same technical issues as students
- A few have doubts in their ability to help students with QGIS
• Screencasts for students – no supervisor required
Lots of discussions on type of legend: drawn symbols vs. polygons
12
13. Summary / lessons learned
• Hybrid approach – paper and GIS – was a success
• QGIS – useful in the field and for students without prior experience
• Technical instructions are required (screencasts)
• GIS was supporting the fieldwork not the focus
13
w.a.marra@uu.nl – fieldwork.geo.uu.nl