Download to read offline
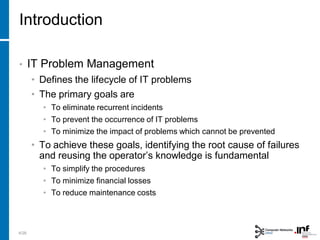
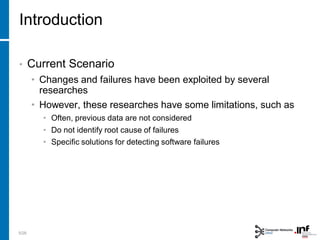
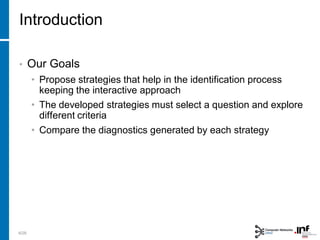
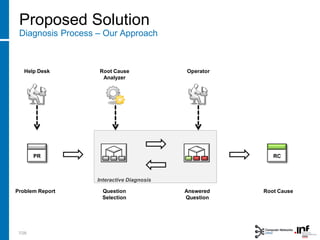
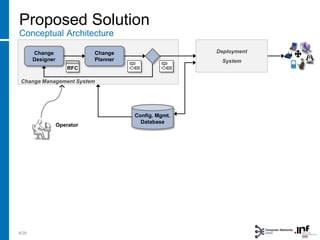
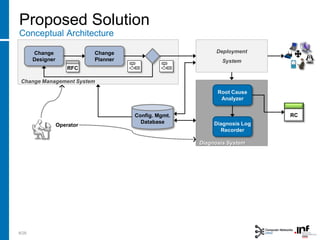
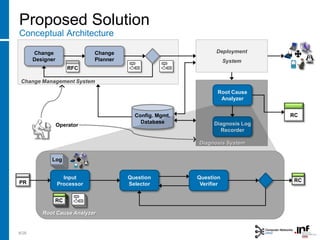
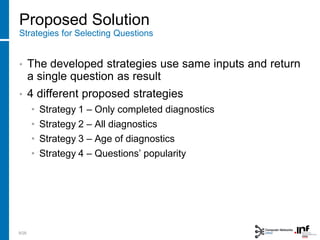
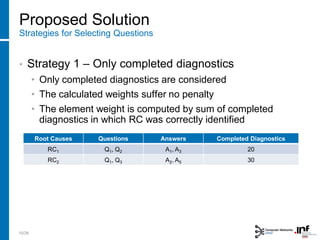
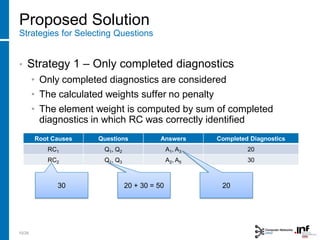
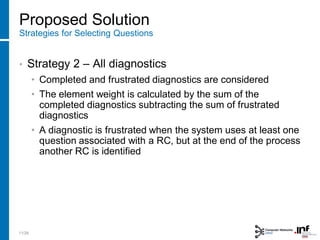
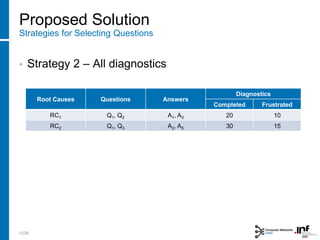
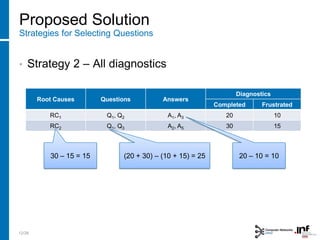
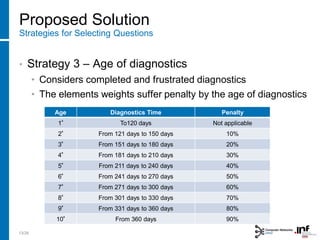
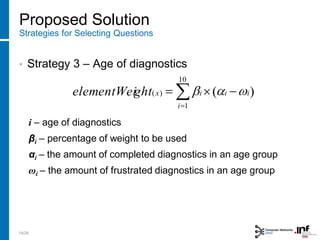
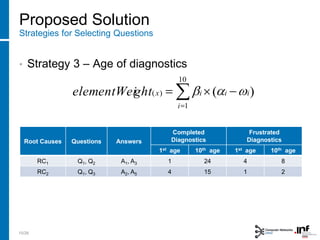
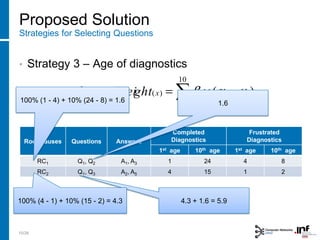
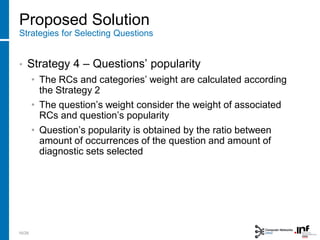
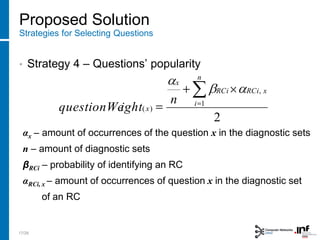
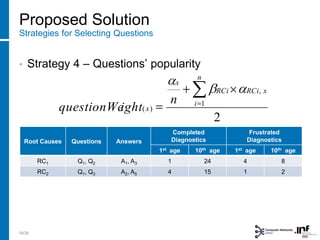
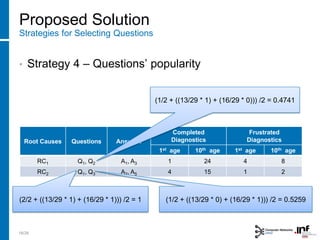
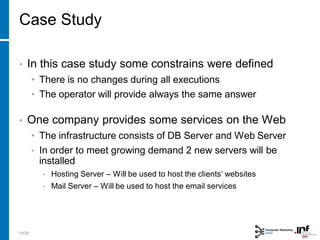
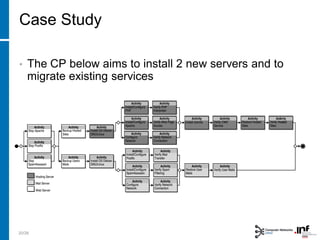
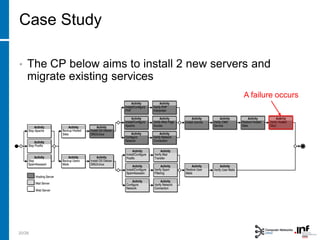
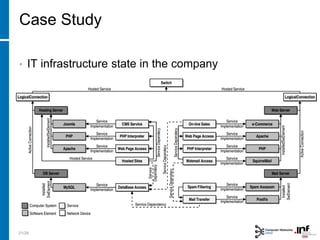
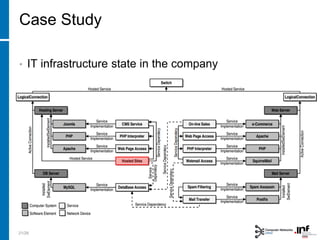
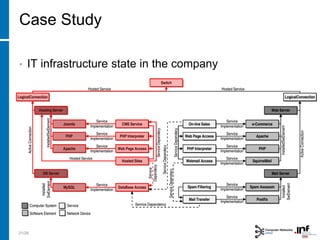
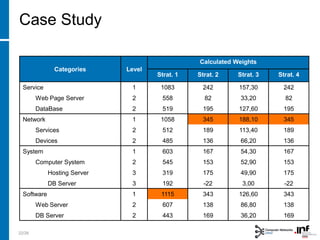
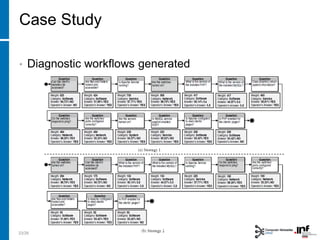
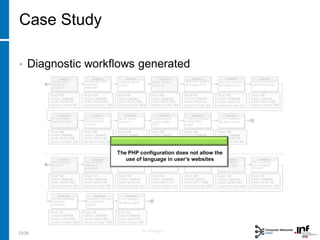
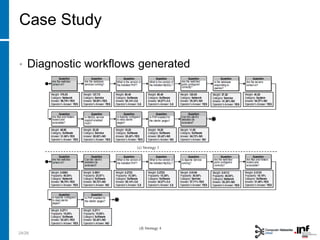
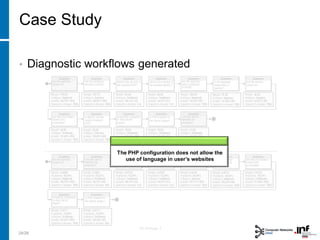
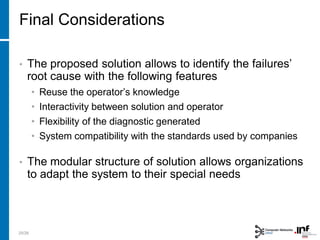
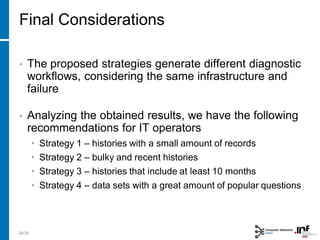
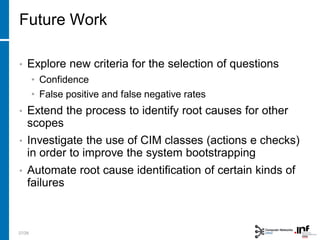
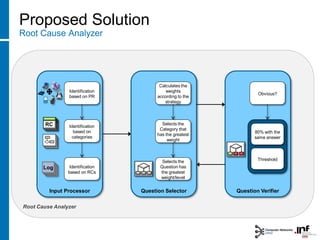
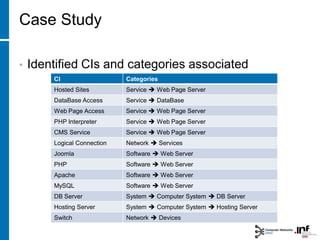
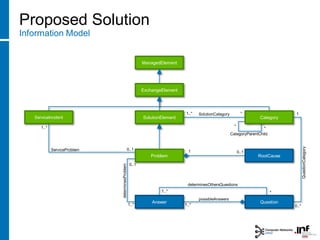
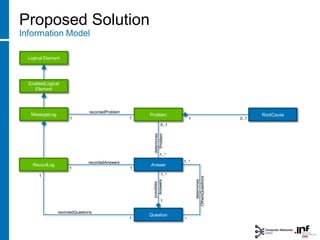

The document proposes strategies to identify the root causes of failures in IT changes through an interactive diagnosis process. It presents a conceptual architecture with a root cause analyzer that selects questions using different strategies, including only considering completed diagnostics, all diagnostics, the age of diagnostics, and questions' popularity. A case study demonstrates the diagnosis workflows generated for a failure occurring during a change involving installing new servers. The solution allows reusing operators' knowledge and flexibility in diagnostics generated.


![Lea Dit 2010 Td Presentation Au Email[1]](https://cdn.slidesharecdn.com/ss_thumbnails/leadit2010tdpresentationauemail1-12916760571454-phpapp01-thumbnail.jpg?width=640&height=640&fit=bounds)


