Download to read offline
![D. A. Nimkar et al Int. Journal of Engineering Research and Applications www.ijera.com
ISSN : 2248-9622, Vol. 4, Issue 4( Version 1), April 2014, pp.47-51
www.ijera.com 47 | P a g e
Removal of Congo red Dye from Aqueous Solution by Using Saw
Dust as an Adsorbent
D. A. Nimkar*, S. K. Chavan**
* Department of Chemistry, D. B. F. Dayanand College of Arts and Science, Solapur. (413002) India.
**Department of Chemistry, D. B. F. Dayanand College of Arts and Science, Solapur. (413002) India.
ABSTRACT
The removal of this dye from the industry waste water is environmentally significant. In the present work, easily
available, and low cost adsorbent i. e. saw dust was employed to remove congo red dye from water. The effects
of parameters like pH, amount of adsorbent dose, contact time, temperature were studied. The result showed that
90% dye was removed when pH
= 9 and contact time is 120 minutes.when the temperature increases from 298
K, 303 K and 308 K, the rate of adsorption also increases. The Freundlich and Langmuir adsorption isotherm
were also studied. The kinetic study shows that the system follows pseudo 2nd
order. The ultrasonic velocities of
dye solution were studied. The result shows that the velocity increases with adsorption increases.
Key words: adsorption, adsorption isotherm, congo red, kinetc study, saw dust.
I. INTRODUCTION
The release of large quantities of dyes into
water by textile industries possesses serious
environmental problems [1] due to its persistent
nature. The coloured effluent have an inhibitory
effect[2] on the process of photosynthesis and
affecting aquatic eco system. Azo dye like congo red
not degradate completely produces toxic amines in
water [3]. Dyes have a tendency to produce metal
ions in textile water produces micro toxicity in the
life of fish [4]. Thus the removal of dyes from
coloured effluents in textile industry is one of the
major environmental problem.
There are various methods which have been
employed for removal of dyes from effluent [5].
Most of these methods are expensive. The adsorption
process [6] has been found to be more effective
method over all other treatments. Therefore proposed
work were undertaken using agriculture waste like
saw dust for the removal of dye material[7-11] from
aqueous solution.
II. MATERIALS AND METHODS
2.1 MATERIALS
Saw dust was collected from a local saw
mill in Solapur city. It was then washed with distilled
water and dried in an oven at 1200
C. It was then
seived through sieve no. 100(150µm).
The BET surface area of saw dust was 40.2
m2
/gm. obtained from BET technique. Congo red dye
used was (AR grade Finar chemicals limited.).
Molecular formula : C32H22N6Na2O6S2
The X-ray diffraction study of saw dust was
carried out by X-ray Fluoroscence spectrometer
(Philip model PW 2400). The morphological and
XRD study clearly indicates that the adsorbent is
porous and amorphous in nature.
X-ray diffraction pattern of saw dust.
The IR spectrum of saw dust was also studied.
IR spectrum of saw dust
From the SEM analysis it was found that
there were holes and cave type openings on the
surface of adsorbent which would have more surface
area available for adsorption[12] as shown in fig 1.
Saw dust Saw dust
(Before adsorption) (After adsorption)
RESEARCH ARTICLE OPEN ACCESS](https://image.slidesharecdn.com/i0444751-140528053936-phpapp01/75/I0444751-1-2048.jpg)
![D. A. Nimkar et al Int. Journal of Engineering Research and Applications www.ijera.com
ISSN : 2248-9622, Vol. 4, Issue 4( Version 1), April 2014, pp.47-51
www.ijera.com 48 | P a g e
Scanning electron micrograph (SEM) of the
adsorbent
2.2 CHARACTERIZATION OF ADSORBENT
1. The BET Data shows that the saw dust is having
a surface area 40.4 m2
/ gm.
2. The Scanning Electron Microscope (SEM)
technique was used to study the structure and
porosity of saw dust before adsorption and after
adsorption. The photographs shows that the size
of the pores reduces after adsorption.
2.3 BATCH ADSORPTION EXPERIMENTS
Batch adsorption experiments were
conducted by shaking 150 ml of dye solution having
concentration (50mg/l) i.e. 50 ppm with different
amount of adsorbent and having different pH
values,
at different temperatures as well as different time
intervals. The adsorbent was then removed by
filteration and the concentration of dye was estimated
spectrophotometrically at λmax= 580 nm. The amount
of dye adsorbed was then calculated by mass balance
relationship equation,
qe = Co-Ce
X
Where,
Co = Initial dye concentration
Ce= Equilibrium dye concentration
qe =Amount of dye adsorbed per unit mass
of adsorbent.
x=dose of adsorbent
III. RESULT AND DISCUSSION
For getting highest amount of dye removal
various factors were optimized.
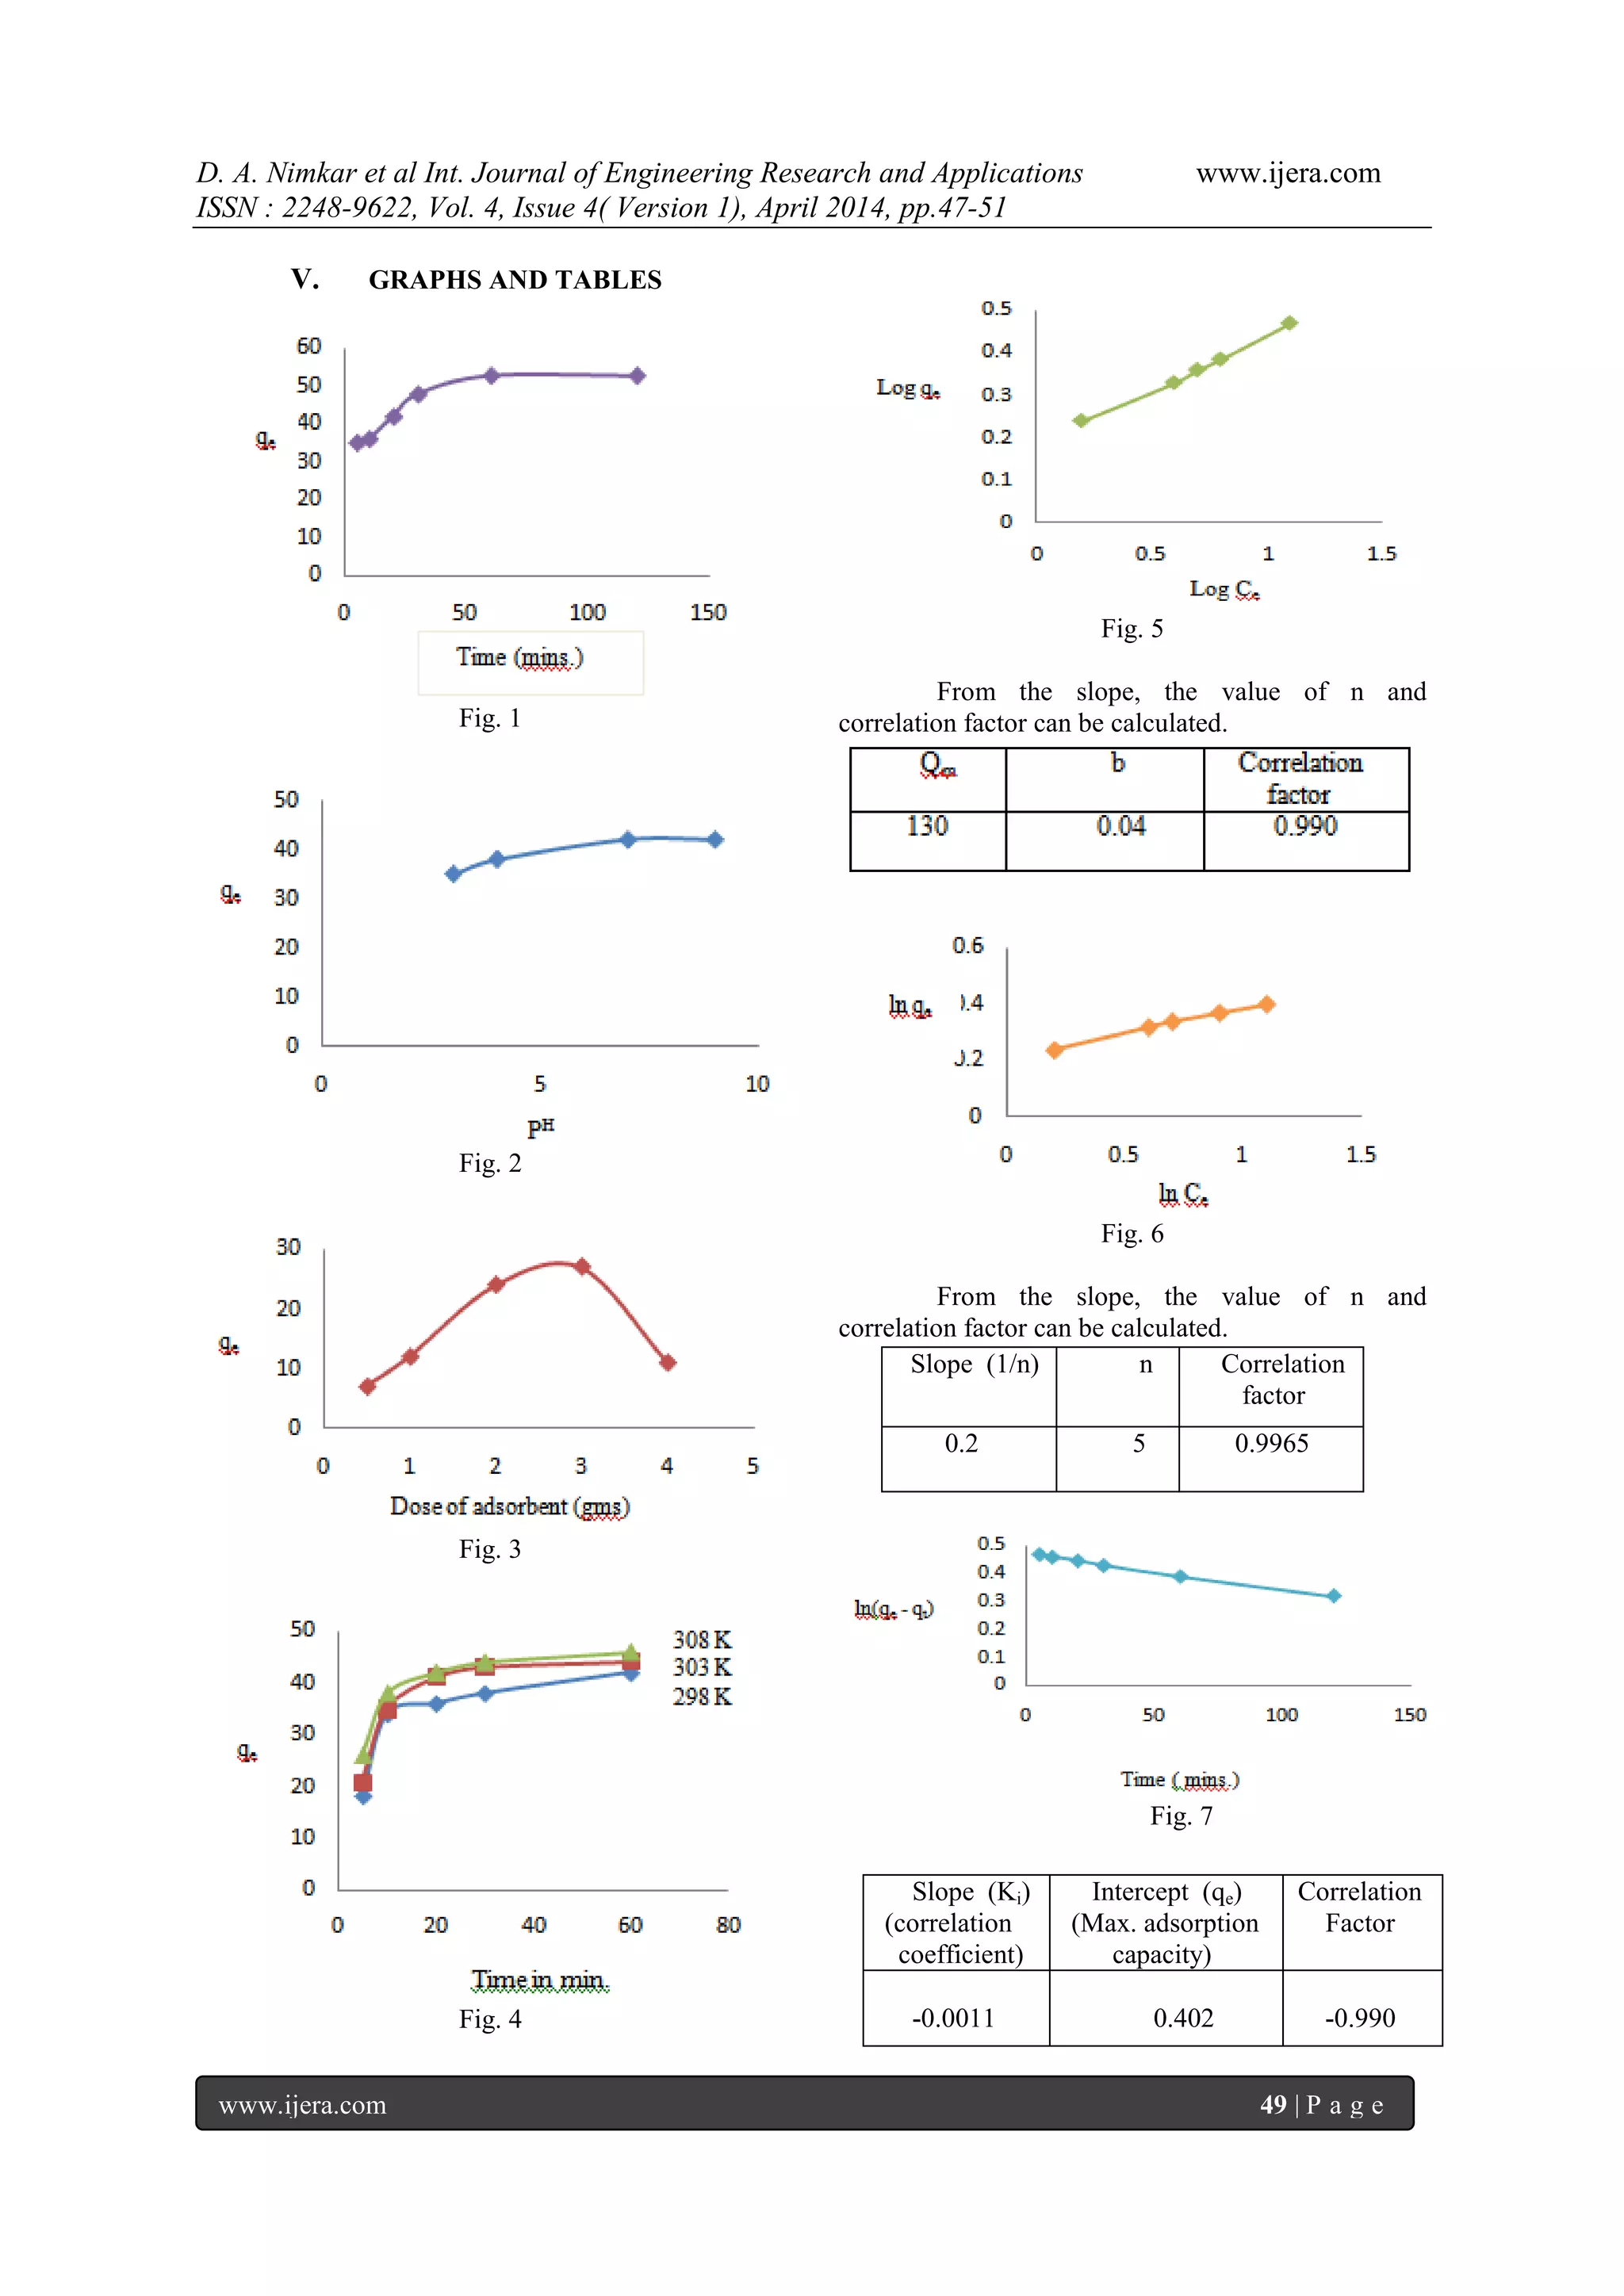
3.1 EFFECT OF CONTACT TIME:
In order to get minimum amount of
adsorbent for removal of maximum amount of dye.
The contact time was optimized. The results showed
that the extent of adsorption is rapid at the initial
stage, after 70 minutes the rate of adsorption is
constant. About 80% dye was removed.(fig.1).
3.2 EFFECT OF PH
:
From fig.2 it reveals that an increase in pH
is
accompanied with increase in percentage of dye
removal. At pH
= 8, adsorption is maximum.
Therefore it is chosen as optimum pH
. The percentage
removal of basic cationic dye increases with increase
in pH
[13,14]. By further increase in pH
adsorption
slightly decreases.
3.3 EFFECT OF ADSORBENT DOSE:
From the results, it is clear that the optimum
dose is 3gm/150ml. (Fig.3). By further increase of
adsorbent dose, the removal of adsorbent decreases
due to some of the adsorption sites remains
unsaturated during the process [15].
3.4 EFFECT OF TEMPERATURE:
The perusal of fig.4 it is clear that
adsorption capacity of adsorbent increases as the
temperature increases due to increase in the mobility
of dye ions increasing temperature also causes a
swelling effect within the internal structure of
adsorbent. So that large number of dye molecules can
easily penetrate through it[16,17].
IV. ADSORPTION ISOTHERM
4.1 LANGMUIR ISOTHERM
In order to study the adsorption of dye
according to Langmuir isotherm, following equation
was used.
Ce/qe = 1/Qm x b + Ce/Qm
A graph of Ce/ qe against Ce was plotted.
The correlation factor is closely related to
unity, which indicates that the Langmuir isotherm
model is applicable [18, 19]. The formation of
monolayer takes place on the surface of the adsorbent
[20,21].
4.2 FREUNDLICH ISOTHERM
In order to study the Freundlich isotherm
the following equation was used[22].
log qe = log Kf + log Ce/ n
The graph of ln qe against ln Ce was plotted.
The value of correlation factor is closely
related to one. So it indicates that the Freundlich
isotherm also satisfied. The value of n is greater than
1. So the Freundlich adsorption develops
appropriately.
4.3 ADSORPTION KINETICS
4.3.1 PSEUDO 1ST
ORDER MODEL
The pseudo 1st
order kinetics model is used
to understand the kinetic behavior of the system [23,
24]. It is given by the equation.
𝑑𝑞
𝑑𝑡
= ki (qe - qt)
A graph of ln(qe - qt) vs time was plotted.
4.3.2 PSEUDO 2ND
ORDER MODEL
The pseudo 2nd
order kinetic model was studied using
equation [25].
t/qt = qe
2
/K2 + t/ qe
Where qe = dye adsorbed at equilibrium
qt = dye adsorbed at time t
A graph t/ qt of against time was plotted.](https://image.slidesharecdn.com/i0444751-140528053936-phpapp01/75/I0444751-2-2048.jpg)
![D. A. Nimkar et al Int. Journal of Engineering Research and Applications www.ijera.com
ISSN : 2248-9622, Vol. 4, Issue 4( Version 1), April 2014, pp.47-51
www.ijera.com 50 | P a g e
Fig. 8
In case of pseudo 1st
order kinetic model, the
value of slope and correlation factor are negative.
While in case of pseudo 2nd
order kinetic model, the
value of slope and correlation factors are positive.
Which implies that, the system is more fevourable for
pseudo 2nd
order kinetics.
VI. CONCLUSION
Saw dust an agriculture by-product acts as
an effective adsorbant for the removal of basic dye
like congo red from its aqueous solution. Batch
adsorption study was shown that the percentage of
colour removal increases with increase in adsorbant
dosage upto certain limit, increasing contact time,
increasing pH
as well as increase in temperature. The
optimum conditon for equilibrium is achieved after
120 min. When adsorbent dose increases above 3gm.,
the adsorption decreases. The Langmuir isotherm
model is applicable for this system, which shows
that, there is a formation of monolayer, present on the
surface of adsorbent. Similarly the kinetic study
shows that the pseudo 2nd
order kinetc model was
more fevourable for the present system.
VII. ACKNOWLEDGEMENT
Authors are thankful for financial support to
University Grants commission, Western Regional
Office, Ganesh khind, Pune, India, under Minor
research project.
REFERENCES
[1] Mcmullan G., Meehan C., Conneely A.,
Kirby N., Robinson T., et. al., Microbial
decolourization and degradation of textile
dyes, Appl Microbiol Biotechnol 56, (2001),
81-7.
[2] Nigam P., Armour G., Bonant I. M., Singh
D., Marchant R., Physical removal of textile
dyes and solid state fermentation of dye-
adsorbed agricultural residues, Bioresour
Technol, 72, (2000), 219-226.
[3] Wolfe N. L., Weber E., Environ. Toxicol
Chem., 6 (1987) 911-927.
[4] Nagda, G. K. , Diwan A. M.and Ghole, V.
S., App. Eco. & Enviro. Res. 2 (2007) 1, 2.
[5] Bozdogan A., Gokunil H., The removal of
colour of textile dyes in waste water by use
of recycled coagulant, M. U. Fena Billimleri
Dergisi, 4 (1987) 83-96.
[6] Khatri S. D., Singh M. K., Colour removal
from synthetic dye waste water using a
biadsorbent, Water Air Soil pollut. 120
(2000) 283-294.
[7] Singh B. K., Rawat N. S., Comparative
sorption equilibrium studies of toxic phenols
on fly ash and impregnated fly ash, J. Chem.
Technol. Biotechnol. 61 (1994) 307-317.
[8] McKay G., Prasad G. R., Mowli P. R.,
Equilibrium studies for the adsorption of
dyestuff from aqueous solutions by low cost
materials, Water Air Soil Pollut. 29 (1986)
273-283.
[9] Khare S. K., Panday K. K., Srivastava R.
M., Singh V. N., Removal of Victoria blue
from aqueous solution by fly ash. J. Chem.
Technol, Biotechnol. 38 (1987) 99-104.
[10] Juang R. S., Wu F. C., Tsang R. L., The
ability of activated clay for the adsorption of
dyes from aqueous solutions. Environ.
Technol. 18 (1997) 525-531.
[11] Theng B. K. G., Wells N., Assessing the
capacity of some New zealand clays for
decolourizing vegetable oil and butter. Appl.
Clay. Sci. 9 (1995) 321-326.
[12] Khatri S. D., Singh M. K., Adsorption of
basic dyes from aqueous solutions by natural
adsorbent. Ind. Chem. Technol. 6 (1999)
112-116.
[13] Ferro F., Journal of Hazardous Material 142
(2007) 144.
[14] Jain R. and Sikarwar S., Journal of
Hazardous Material 152 (2008) 942.
[15] K. Bhatti, Z. M. Pervez, Journal of the
Chemical Society of Pakistan, 33 (2011)
522.
[16] Garg V. K., Kumar Rakesh, Gupta Renuka,
Basic dye (Methylene blue) removal from
simulated waste water using Indian Rose
wood Saw dust a timber industry waste
Dyes and pigments 63 (2004) 243-250.
[17] Yamin Yasin, Mohd. Zobir Hussein, Faujan
Hj Ahmad, Adsorption of Methylene blue
on to treated activated carbon. Malaysian
Journal of analytical sciences. 11 (2007)
400-406.
[18] Reuy-Shin Juang, Tseng Ru-Ling, Feng-
Chin Wu, and Suen Ji-Lin. Use of CChitin
and Chitosan in Lobse shell waste for colour
Slope (K2) Intercept (qe) Correlation factor
0.0032 0.120 0.9996](https://image.slidesharecdn.com/i0444751-140528053936-phpapp01/75/I0444751-4-2048.jpg)
![D. A. Nimkar et al Int. Journal of Engineering Research and Applications www.ijera.com
ISSN : 2248-9622, Vol. 4, Issue 4( Version 1), April 2014, pp.47-51
www.ijera.com 51 | P a g e
removal from aq. Solution. J. Environ. Sci.
Health A31 (1996) 325-338.
[19] Sen A. K. and De. A. K., Adsorption of
mercury (II) by coal fly ash. Water Res. 21
(1987) 885.
[20] Thievarasu C., Mylsamy S. and Sivakumar
N., Cocoa shellas adsorbent for the removal
of the methylene blue from aqeous solution
for kinetcs and equilibrium study. Universal
Journal of Env. Research and Tech. 1 (2011)
70-78.
[21] Parvathi C. Sivamani S., Prakash C.
“Biosorption studies on Malenchite green
dye.” Colourage Environmental solution.
LV I 10 (Oct 2009) 54-56.
[22] Arivoli S., Hema N., “Comparative study on
the adsorption kinetics and thermodynamics
of dyes on to acid activated low cost
carbon.” Int. J. Phys. Sci. 2 (2007) 10-17.
[23] Karabulut S. “Batch removal of Copper (II)
and zinc (II) from aqueous solution with low
rank Turkish coals.” Sep. purif. Tech. 18
(2000) 177-187.
[24] Guruswami, Annadurai, Ruey-Shin Juang,
Duu-Jong Lef. “Use of cellulose based
waste for adsorption of dyes from aq.
Solutions.” J. Hazard. Water B92 (2002)
263-274.
[25] Paul S. A., Chavan S. K., Oriental Jr. Chem.
27 (2011) 41-44.](https://image.slidesharecdn.com/i0444751-140528053936-phpapp01/75/I0444751-5-2048.jpg)

The study investigates the removal of Congo red dye from wastewater using sawdust as a low-cost adsorbent. The research identifies optimal conditions for maximum dye removal, showing that 90% of the dye was removed at pH 9 within 120 minutes using an optimal adsorbent dose of 3g in 150ml of solution. Results indicate that both Langmuir and Freundlich isotherm models are applicable, with the pseudo second-order model being the most favorable for adsorption kinetics.


![Coded Agents – with UiPath SDK + LangGraph [Virtual Hands-on Workshop]](https://cdn.slidesharecdn.com/ss_thumbnails/codedagentsdeck-251215155422-5497c599-thumbnail.jpg?width=640&height=640&fit=bounds)


