Download to read offline


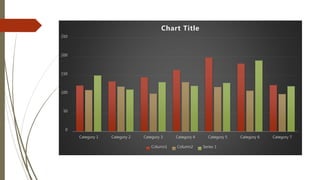
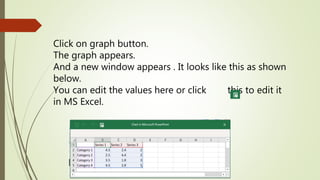
Graphs can be added and edited in 3 steps: click the graph button to insert a graph, which will open a new window to configure the graph title, categories, and values that can be edited directly or in Excel; this allows customization of the data and labels displayed in the graph.


