Download to read offline
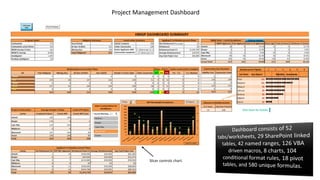
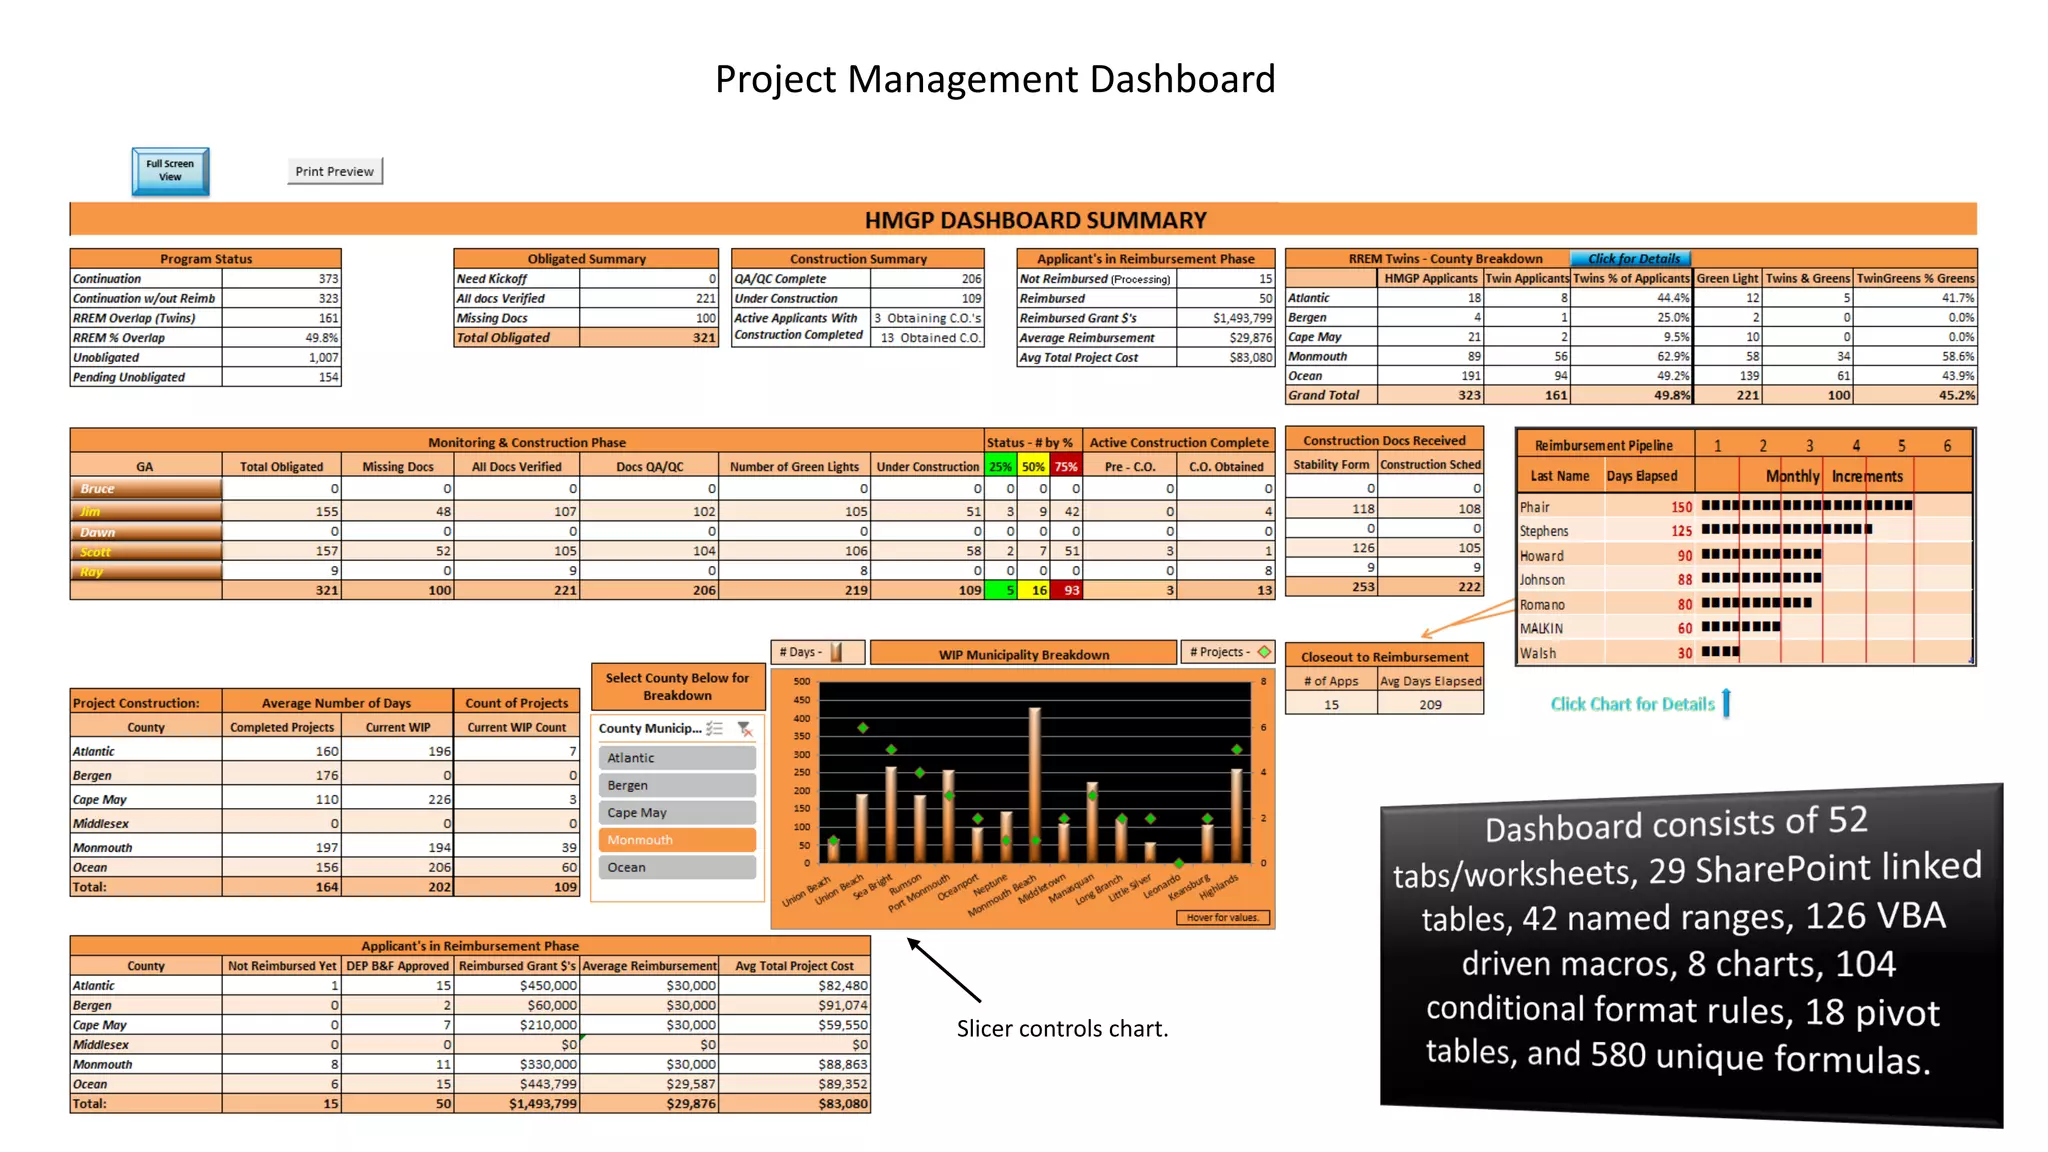
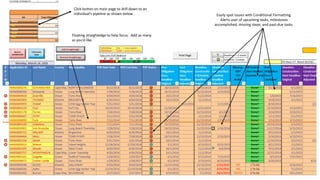
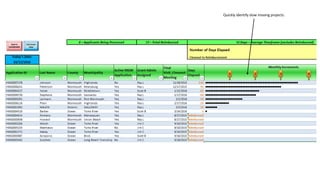
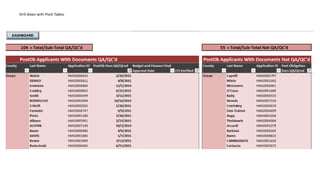


The document describes a project management dashboard that allows users to easily monitor project progress through various interactive visualizations. The dashboard includes slicers and charts to filter data, conditional formatting to spot issues, and alerts for upcoming tasks and milestones. It also enables drilling down into individual pipelines or projects using pivot tables, pivot charts, and links to get additional help with projects.


