HLM FINAL PROJECT
By 임현숙, 신철균, 고은희
Class: Multivariate Analyses
Instructor: Park, Hyun Jung
Semester: Fall Semester 2007
1
2.
HLM Question 1
1.데이터에 사용된 변수들에 대한 설명
Variable Name Description
Student level (Level 1)
MATH ACHIEVEMENT A measure of mathematics achievement (mean=12.75, sd=6.88)
A standardized scale constructed from variables measuring parental
SES
education, occupation, and income
MINORITY An indicator for student ethnicity (1=minority, 0 =others)
FEMALE An indicator for student gender (1=female, 0=male)
School level (Level 2)
SIZE School enrollment
SECTOR 1= Catholic, 2=Public
PRACAD Proportion of students in the academic track
DISCLIM A scale measuring disciplinary climate
HIMNTY 1=More than 40% minority enrollment, 0=less than 40%
Mean of the SES values for the students in this school who are included in
MEANSES
the level-1 file
2. 기술통계
(1) Level 1
(i) 기술통계량
Minority에 따른 Math achievement의 기술통계량 (평균, 표준편차, 왜도, 첨도 등)은 다음과
같다.
[표 1] Minority에 따른 Math Achievement의 기술통계
minority Statistic Std. Error
mathach 0 Mean 13.88239 .092219
Variance 44.316
Std. Deviation 6.657021
Skewness -.331 .034
Kurtosis -.789 .068
2
3.
1 Mean 9.75288 .147363
Variance 42.867
Std. Deviation 6.547308
Skewness .190 .055
Kurtosis -.825 .110
(ii) 변수 분포
3
5,321
2
1
0
-1
-2
4,599
5,009
4,899
-3
6,033
-4
ses minority female
원 자료의 분포가 제대로 되어 있는지, 결측치가 존재하는지 확인을 하기 위해 각 변수들에
대한 box-plot 도표와 잔차 도표를 구한 결과, 3 개의 outlier값들 (case 번호 4899, 5321,
6033)이 관찰되었다. 가설 검증을 위한 데이터 사례수 가 충분하므로 여기서는 보다 정확한
추정을 위해 이 3 개의 outlier 값을 제거하고 분석을 시작하였다.
(ⅲ) 정규성 검증
[표 2] Minority에 따른 Math Acheivement의 정규성 검증
Kolmogorov-Smirnov(a) Shapiro-Wilk
minority Statistic df Sig. Statistic df Sig.
mathach 0 .058 5211 .000
1 .054 1974 .000 .980 1974 .000
a Lilliefors Significance Correction
3
4.
[표 3] Female에따른 Math Achievement의 정규성 검증
Kolmogorov-Smirnov(a) Shapiro-Wilk
female Statistic df Sig. Statistic df Sig.
mathach 0 .059 3390 .000 .965 3390 .000
1 .047 3795 .000 .980 3795 .000
a Lilliefors Significance Correction
[표 2]와 [표 3] 결과 정규성 영가설이 기각되어 정규성 가정을 만족시키지 못하는 것으로
나타났다. 하지만, 일반적으로 표본의 수가 어느 정도 많은 경우, 잔차에 대한 분포가
정규분포를 따르지 않더라도, 종모양의 비슷한 형태를 나타내기만 한다면 정규성 가정이
1
만족되지 못하더라도 심각한 문제가 발생하지 않는다 . 실제, 빈도분석 결과, 전반적으로
종모양의 형태를 띠는 것으로 나타났으므로 정규성 가정에 문제가 없다고 판단을 내리고
분석을 진행하였다.
(iv) 등분산성 검증
[표 4] Minority에 따른 Math Achievement의 등분산성 검증
Levene
Statistic df1 df2 Sig.
mathach Based on Mean 1.034 1 7183 .309
Based on Median .765 1 7183 .382
Based on Median and with
.765 1 7178.133 .382
adjusted df
Based on trimmed mean .875 1 7183 .350
[표 4] 결과, Minority에 따른 Math Achievement의 등분산성에 대한 영가설이 지지되었으므로
등분산성 조건을 만족시켰다.
1
이군희 (2000). 사회과학 연구방법론, 법문사
4
5.
[표 5] Female에따른 Math Achievement의 등분산성 검증
Levene
Statistic df1 df2 Sig.
mathach Based on Mean 13.411 1 7183 .000
Based on Median 11.710 1 7183 .001
Based on Median and with
11.710 1 7150.795 .001
adjusted df
Based on trimmed mean 12.547 1 7183 .000
반면, Female에 따른 Math Achievement의 등분산성 검증은 영가설이 기각되어 등분산성
조건을 만족시키지 못하였으므로 차후 위계적 선형 모형에서 Female 변수의 분산을
이질적으로 설정하고 분석하고자 한다.
Var (rij ) = σ ij and log(σ ij ) = α 0 + α 1 ( FEMALEij )
2 2
[표 6] Comparison of Homogeneous and Heterogeneous Level-1 Variance Models for
Mathematics Achievement
(i) Results for Homogeneous Variance Model Standard Approx.
Fixed Effect Coefficient Error T-ratio d.f. P-value
For INTRCPT1, B0
INTRCPT2, G00 12.629710 0.135239 93.388 155 0.000
SECTOR, G01 0.618126 0.372608 1.659 155 0.099
PRACAD, G02 3.184714 0.905697 3.516 155 0.001
HIMINTY, G03 -1.121324 0.343665 -3.263 155 0.002
MEANSES, G04 3.841524 0.486533 7.896 155 0.000
For MINORITY slope, B1
INTRCPT2, G10 -3.090744 0.255884 -12.079 155 0.000
SECTOR, G11 2.493258 0.709652 3.513 155 0.001
PRACAD, G12 -0.754729 1.616671 -0.467 155 0.641
HIMINTY, G13 0.167364 0.544001 0.308 155 0.759
MEANSES, G14 -0.258677 0.810272 -0.319 155 0.750
For FEMALE slope, B2
INTRCPT2, G20 -1.104894 0.201094 -5.494 155 0.000
SECTOR, G21 0.238812 0.560862 0.426 155 0.670
PRACAD, G22 0.295424 1.368173 0.216 155 0.830
5
PRACAD, G22 0.373889 1.333972 0.280 155 0.780
HIMINTY, G23 0.275401 0.480888 0.573 155 0.567
MEANSES, G24 0.160079 0.718553 0.223 155 0.824
For SES slope, B3
INTRCPT2, G30 1.921190 0.111235 17.271 155 0.000
SECTOR, G31 -1.111562 0.303874 -3.658 155 0.001
PRACAD, G32 -0.297446 0.739653 -0.402 155 0.688
HIMINTY, G33 -0.633772 0.275030 -2.304 155 0.023
MEANSES, G34 0.749275 0.397081 1.887 155 0.061
Random Effect Standard Variance df Chi-square P-value
Deviation Component
INTRCPT1, U0 1.41086 1.99053 95 294.98419 0.000
MINORITY slope, U1 0.97644 0.95344 95 113.04221 0.100
FEMALE slope, U2 0.86431 0.74703 95 117.72762 0.057
SES slope, U3 0.23885 0.05705 95 94.34888 >.500
Standard
Parameter Coefficient Error Z-ratio P-value
INTRCPT1 ,alpha0 3.55983 0.017308 205.680 0.000
FEMALE ,alpha1 -0.17011 0.040660 -4.184 0.000
Number of
Model Parameters Deviance
1. Homogeneous level-1 variance 31 46211.467967
2. Heterogeneous level-1 variance 32 46193.332169
Chi-square df P-value
Model 1 versus Model 2 18.135798 1 0.000
(2) Level 2
(i) 기술통계량
ELL_ENG 각 집단의 Aggregated Math achievement의 기술통계량 (평균, 표준편차, 왜도,
첨도 등)은 다음과 같다.
7
8.
기술통계량
N 평균 표준편차 분산 왜도 첨도
통계량 통계량 통계량 통계량 통계량 표준오차 통계량 표준오차
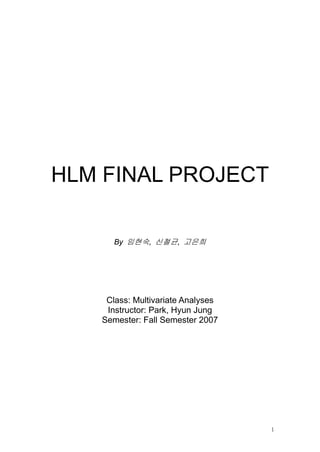
size 160 1097.8250 629.50643 396278.347 .470 .192 -.555 .381
sector 160 .44 .498 .248 .254 .192 -1.960 .381
pracad 160 .5139 .25590 .065 .266 .192 -.803 .381
disclim 160 -.0151 .97698 .954 .239 .192 -.207 .381
himinty 160 .28 .448 .201 1.017 .192 -.977 .381
meanses 160 -.0002 .41397 .171 -.287 .192 -.394 .381
mathach 160 12.6245 3.11932 9.730 -.279 .192 .007 .381
유효수 (목록별) 160
(ii) 변수 분포
1.00
0.50
0.00
-0.50
-1.00
-1.50
sector pracad himinty meanses
집단 수준에서도 원 자료의 분포가 제대로 되어 있는지, 결측치가 존재하는지 확인을 하기
위해 각 변수들에 대한 box-plot 도표를 구한 결과 결측치가 존재하지 않아 이 데이터를
바탕으로 분석을 실시하였다.
8
9.
(ⅲ) 정규성 검증
0.30000
Standard Error of Predicted Value
0.25000
0.20000
0.15000
2.00000 4.00000 6.00000 8.00000 10.00000 12.00000 14.00000 16.00000
Mahalanobis Distance
위 제시된 Mahalanobis 도표를 보면, level 2 수준에서 전반적으로 정규성 가정을 만족하고
있음을 알 수 있다.
(iv) 등분산성 검증
집단 2 수준에서의 등분산성 검증은 likelihood-ratio test을 통해 검증할 수 있으나,
대안적으로 Levene test를 통해서도 검증할 수 있다. 여기서는 likelihood-ratio test 사용법을
모르므로 대신 Levene test를 통해 검증하고자 한다.
SECTOR, HIMINORITY 각각의 Levene test 결과는 다음과 같이 나타난다 (PREACAD,
MEAN SES는 집단 수가 너무 많아 등분산성 검증 실시가 안되어 제시하지 않음).
mathach
Levene
통계량 자유도1 자유도2 유의확률
.250 1 158 .618
mathach
Levene
통계량 자유도1 자유도2 유의확률
1.666 1 158 .199
이를 통해, 집단 수준의 등분산성 가정도 만족되었음을 알 수 있다.
(3) Level 1 과 Level 2 변수 요약
기초통계 결과를 바탕으로, 3 개의 outlier 값들을(level 1 수준) 제거하고 분석을 시작하였으며
9
10.
전반적으로 Level 1,Level 2 모두 선형 모형 가설 검증에 필요한 가정들을 모두 만족시키고
있으므로 이 데이터를 기초로 하여 위계적 선형 모형 (HLM) 검증을 시작하였다.
3. 위계적 선형 모형 (Hierarchical Linear Model, HLM)
(1) 기본 모형 (null model) 설정 및 Intraclass correlation
MATHACH ij = β 0 j + rij
β 0 j = γ 00 + µ 0 j
위와 같이 기본 모형을 설정하고 이를 토대로 구한 Intraclass correlation 값은 다음과 같다.
Intraclass correlation = 8.61431/(8.61431+39.14831)=0.18036
즉, 학교간 변량의 차이가 약 18%임을 알 수 있다.
(2) Level 1 의 모형 결정
(i) Level 1 변수 설정
[표 7] Random Coefficient Model of Mathematics Achievement
Fixed Effect Coefficient se t Ratio
School Mean Achievement , γ 00 12.635 0.245 51.637
Minority Gap, γ 10 -2.930 0.267 -10.956
Female, γ 20 -1.128 0.185 -6.097
SES, γ 30 1.891 0.121 15.622
Random Effect, Variance df χ2 p value
Component
8.729 99 924.381 .000
Mean Achievement, u0 j
2.429 99 125.395 .038
Minority Gap, u1 j
0.725 99 121.728 .060
Female, u2 j
0.428 99 113.667 0.149
SES, u3 j
35.264
Level-1 effect, rij
Correlation Among School Effects Minority Female SES Mean
10
11.
Achievement
Minority - .013 -.273 -.268
Female .013 - -.069 -.123
SES -.273 -.069 - .361
Mean Achievement -.268 -.123 .361 -
Reliability of OLS Regression-Coefficient Estimations
Mean Achievement .908
Minority Gap .227
Female .166
SES .178
[표 7]에서 제시된 상관관계표 결과, SES(- .361), MINORITY(-.268), FEMALE (-.123) 등의
순으로 MATH ACHIEVEMENT와 높은 상관관계를 가짐을 알 수 있다. 따라서, SES를 제일
먼저 모형에 입력하고 그 다음이 minority, female 순으로 모형에 입력하였다.
(ii) Centering 결정
Centering은 집단 평균으로 교정하였다 (group mean centering). 이는, 강상진과 정혜경
(2002)이 “연구자가 가장 안정적인 절편 모수 γ 00 를 얻고자 한다면, Level 1 에서 예측변수의
중심점을 교정하고 Level 2 예측변수를 전체평균으로 교정하는 방식을 권장한다”는 주장에
근거하여 설정하였다 2. 또한, 실제 각 개인들의 예측변수들은 전체 집단보다는 그 개인이
속한 집단의 특성에 더 많은 영향을 받으므로 전체평균에 의한 교정보다는 집단평균에 의한
교정이 더 적절하다고 판단되어 이 연구에서는 level 1 수준에서는 집단수준의 평균에 의한
교정을 적용하였다.
(iii) OLS 모수치에 대한 신뢰도 계수 - Random, Non-Random, Fixed 변수 선정
Level 1 수준의 변인들을 선정함에 있어서 centering 이외에도 각 변수들을 random, non-
random 또는 fixed로 봐야하는지에 대한 결정이 이루어져야 한다. 이를 결정하는 방법 중
하나가 OLS 모수치에 대한 신뢰도 계수이다. 계산 결과, Mean Achievement (.908), Minority
Gap (.227), Female (.166), 그리고 SES (.178)으로 나타났다 (표 7 참조). 모든 변수들의
신뢰도 계수가 .05 보다 크므로 random으로 설정하였다.
(3) Level 2 의 모형 결정
2
강상진, 정혜경 (2002). 다층모형에서 예측변수 척도의 중심점 교정과 모수추정치의 변화,
교육평가 연구, 제 15권 제 2호.
11
12.
(i) Level 2변수 설정
Level 2 의 변수를 설정하기 위해 Level 2 수준에서의 탐색적 분석 (Exploratory Analysis)를
수행하였다.
[표 8] Exploratory Analysis: estimated level-2 coefficients and their standard errors
Level-1 Coefficient Potential Level-2 Predictors
SIZE SECTOR PRACAD DISCLIM HIMINTY MEANSES
INTRCPT1,B0
Coefficient -0.000 2.564 7.503 -1.350 -2.400 5.375
Standard Error 0.000 0.402 0.643 0.203 0.463 0.334
t value -1.290 6.372 11.668 -6.647 -5.177 16.112
분석 결과, 가장 많은 영향을 미치는 변수가 meanses (16.112), pracad (11.668), disclaim(-
6.647), sector(6.372), himinty(-5.177), size(-1.290) 순이다. size는 영향이 극히 작으므로
변수에서 제외한다. 그리고, sector와 disclim의 상관이 -.712 로서 절대값 .70 을 넘으므로
disclim을 삭제해주는 것이 바람직하다. 나머지 변수들의 상관은 .70 이하이므로 모두 level
2 의 모형에 투입하였다. 결과적으로 level 2 수준에 포함되는 변수들은 meanses, pracad,
sector, himinty으로 결정하였다.
위와 같은 level 1 과 level 2 수준 각각의 변인들을 기반으로 다음과 같은 연구모형을
설정하였다.
Level 1
Yij = β 0 j + β1 j ( SES ) ij + β 2 j ( MINORITY ) ij + β 3 j ( FEMALE ) ij + rij .
Level 2
β 0 j = γ 00 + γ 01 ( SECTOR ) ij + γ 02 ( PRACAD) ij + γ 03 ( HIMINTY ) ij + γ 04 ( MEAN SES ) ij + u 0 j
β 1 j = γ 10 + γ 11 ( SECTOR) ij + γ 12 ( PRACAD) ij + γ 13 ( HIMINTY ) ij + γ 14 ( MEAN SES ) ij + u1 j
β 2 j = γ 20 + γ 21 ( SECTOR) ij + γ 22 ( PRACAD) ij + γ 23 ( HIMINTY ) ij + γ 24 ( MEAN SES ) ij + u 2 j
β 3 j = γ 30 + γ 31 ( SECTOR) ij + γ 32 ( PRACAD) ij + γ 33 ( HIMINTY ) ij + γ 34 ( MEAN SES ) ij + u 3 j
(4) Level 1 에서의 specification issue
12
13.
[표 9] ConfoundingEffects of Minority
With Fixed Effects of Minority
Original Model Estimates
Added
Fixed Effect Coefficient Standard Error Coefficient Standard Error
Model for school mean, B0j
INTERCEPT, G00 12.632 0.140 12.632 0.141
MEAN SES, G01 4.478 0.446 4.477 0.446
PREACAD, G02 3.485 0.726 3.49 0.726
Model for FEMALE slope, B1j
INTERCEPT, G10 -1.081 0.197 -1.132 0.193
MEAN SES, G11 0.035 0.674 0.053 0.661
PREACAD, G12 0.745 1.159 0.695 1.137
Model for SES slope, B2j
INTERCEPT, G20 2.179 0.119 1.944 0.117
MEAN SES, G21 1.374 0.381 1.316 0.370
PREACAD, G22 -2.689 0.612 -2.461 0.594
Model for Minority slopes, B3j
INTERCEPT, G30 -2.892 0.220
Condition 1: Minority변수를 제거한 모형과 Minority 변수를 fixed effect로 추가하여 본 모형
두개를 비교했을 때, 후자 모형의 coefficient값이 전자 모형에 비해 줄어듬을 알 수 있다.
이는 Minority와 SES간 상관이 있기 때문이다. 그러므로, Minority를 제거해서는 안된다.
[표 10] Random Coefficient Regression of Minority on SES
Model
Yij=B0j+Bij(SES)ij+rij
where Yij=minority of student I in school j
Boj=G00+U0j
Bij=G01+U1j
Fixed Effect Coefficient Standard Error T-ratio
Mean intercept, G00 0.275 0.024 11.535
Mean SES slope, G01 -0.080 0.010 -8.450
13
14.
Random Effect Variance Component df Chi-square P-value
Intercept, U0j 0.088 159 6518.94 0.000
SES slope, U1j 0.009 159 440.324 0.000
Exploratory Regressions of B*ij on MEAN SES and PREACAD
Coefficient Standard Error Approximate t-to-Enter
MEAN SES 0.021 0.014 1.432
PREACAD 0.033 0.023 1.421
Condition 2: Random coefficient regression model 결과, Mean SES slope인 G01 는 매우
유의미한 값을 가진다. (t= -8.450) 그러므로 Minority는 원래 존재하는 SES와 관계를 가지고
있기 때문에 제거해서는 안된다.
Condition 3: SES와 Minority간 관계가 학교마다 차이가 있음이 나타났으며 [Var(U1j)=.009,
p=.000] 이 기울기는 MEAN SES나 PREACAD와 같은 다른 학교수준의 변수들과 유의미한
관계를 가짐을 보임으로써 Minority는 모형에서 제거해서는 안되는 것을 다시 한번
검증하였다.
(5) Level 2 에서의 specification issue
Original Model Specification Test
Mean SES missing
Estimates (Fixed ses slope)
Fixed Effect Coefficient se Coefficient se Coefficient se
Model for school mean, B0j
INTERCEPT, G00 12.630 0.133 12.619 0.158 12.619 0.158
SECTOR, G10 0.627 0.366 0.339 0.435 0.339 0.434
PREACAD, G02 3.171 0.890 7.464 0.853 7.460 0.853
HIMINTY, G03 -1.125 0.338 -2.339 0.359 -2.343 0.358
MEAN SES, G04 3.840 0.478
For MINORITY slope, B1j
INTERCEPT, G10 2.467 0.692 -3.066 0.250 -3.089 0.250
SECTOR, G11 -3.068 0.250 2.476 0.693 2.479 0.692
PREACAD, G12 -0.784 1.577 -0.914 1.577 -0.818 1.573
HIMINTY, G13 0.080 0.528 0.111 0.528 0.037 0.527
MEAN SES, G14 -0.220 0.787 -0.106 0.788 -0.207 0.782
14
15.
For FEMALE slope, B2j
INTERCEPT, G20 -1.101 0.196 -1.099 0.197 -1.102 0.198
SECTOR, G20 0.211 0.548 0.267 0.550 0.260 0.553
PREACAD, G22 0.275 0.481 -0.456 1.333 -0.510 1.339
HIMINTY, G23 0.374 1.334 0.511 0.481 0.544 0.484
MEAN SES, G24 0.160 0.719 0.902 0.713 0.912 0.715
For SES slope, B3j
INTERCEPT, G30 1.921 0.111 1.921 0.111 1.907 0.109
SECTOR, G30 -0.634 0.275 -1.126 0.304 -1.157 0.298
PREACAD, G32 -0.297 0.740 -0.086 0.740 0.482 0.604
HIMINTY, G33 -1.112 0.304 -0.693 0.275 -0.870 0.241
MEAN SES, G34 0.749 0.397 0.559 0.397
MEAN SES 가 부적절하게 빠졌다고 가정했을 때, Original 모델과 ses를 missing 한 값의
sector, pracad, himinty 값의 차이가 발생하므로 mean ses를 뺐을 때 misspecification이
발생함을 알 수 있다.
Ses slope를 fix시켰을 때는 se가 거의 유사함을 알 수 있다. 그것은 intercept와 slope 간
서로 상관이 0 이라고 가정했기 때문이다.
(6) Robust standard errors의 의미 및 진단 결과
일반 standard errors는 가정이 만족되었다고 가정하고 검증하는 반면 Robust standard
errors는 가정을 고려하지 않고 검증을 한다. 만약 Robust standard error와 그냥 standard
error 값의 차이가 크면 해당 가정을 위배하는 것을 의미하며, 반대로 그 값들의 차이가
크지 않으면 가정을 위배하지 않았다는 것을 보여준다.
이 자료 분석 결과 일반 standard error 결과와 Robust standard error 결과간 차이는 거의
존재하지 않으므로 모든 분석은 가정을 모두 위배하지 않음을 알 수 있다 3.
(7) MLR versus MLF
일반적으로, 사례수가 작은 경우 (size <30), MLF보다 MLR이 더 현실적이지만 사례수가
클 경우에는 이 둘간 차이가 작아진다. MLF에 비해 MLR는 variance components의
추정치는 고정 효과에 대한 불확실성을 조정해주므로 이 자료에서는 MLR을 채택하여
분석하였다.
3
일반 standard error 결과와 robust standard error 결과간 차이가 거의 존재하지 않으므로
표로 제시하지 않음
15
16.
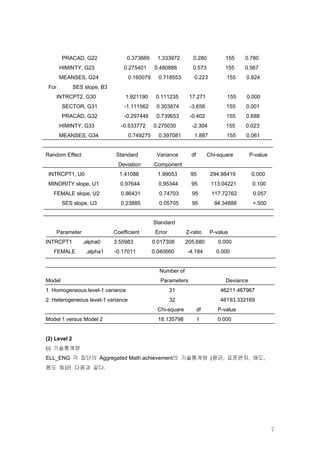
(8) 여러 모형의단계별 설명 변량 (proportion reduction)
이 자료에서는 크게 3 단계를 거쳐 자료를 검증하였다.
1 단계: Null model (unconditional model)
2 단계: Random coefficient regression model
3 단계: Intercepts and slopes as outcomes model
각 모형의 단계별 설명 변량은 식 4.12 를 통해 다음과 같이 계산하였다.
Null model Random coefficient regression model (level 1 수준)
Proportion of variance explained = (39.1413-35.29426)/ 39.1413=.098
Random coefficient regression model Intercepts and slopes as outcomes model (level
2 수준)
Proportion of variance explained = (8.6776 - 1.99538)/ 8.6776 =.77
16
17.
HLM Question 2
1.데이터에 사용된 변수들에 대한 설명
Variable Name Description
Repeated-Observations Model (Level 1)
TIME 0=Fall 2003, 1=Winter 2004, 2=Spring 2004
MATH ACHIEVEMENT Mathematics test scores (mean=122.64, sd=36.44)
Person-Level Model (Level 2)
ELL_ENG 0=Native, 1=Non Native
2. 기술통계
(1) Level 1
(i) 기술통계량
Time 0,1, & 2 각 시점의 Math achievement의 기술통계량 (평균, 표준편차, 왜도, 첨도 등)은
다음과 같다.
[표 6] Level 1 의 기술통계
time Statistic Std. Error
Math achievement 0 Mean 109.60 2.941
Variance 1400.975
Std. Deviation 37.430
Skewness -.238 .191
Kurtosis .246 .379
1 Mean 124.56 2.804
Variance 1273.876
Std. Deviation 35.691
Skewness .004 .191
Kurtosis -.201 .379
2 Mean 131.52 2.851
Variance 1316.363
Std. Deviation 36.282
Skewness .105 .191
Kurtosis -.330 .379
[표 1]을 살펴보면, 전반적으로 Time 0, 1, & 2 각 시점마다의 Math Achievement 점수의
분포가 정상분포를 이루고 있음을 알 수 있다.
17
18.
(ii) 변수 분포
250 Normal Q-Q Plot of fall cbm score, wrc
for time= 0
200 3
fall cbm score, wrc
2
150
Expected Normal
1
100 0
-1
50
312
-2
61
0
196 118 -3
0 1 2 0 50 100 150 200 250
time Observed Value
원 자료의 분포가 제대로 되어 있는지에 대한 확인을 위해 Time 0, 1, & 2 각 시점마다 box-
plot 도표와 잔차도표를 구한 결과, 3 개의 outlier 값들이 (case 번호 61, 118, 196)
관찰되었다. 가설 검증을 위한 데이터의 사례수가 충분하므로 여기서는 보다 정확한 추정을
위해 이 3 개의 값을 제거하고 분석을 시작하였다.
(ⅲ) 정규성 검증
[표 7] Level 1 의 정규성 검증
time Kolmogorov-Smirnov(a) Shapiro-Wilk
Statistic df Sig. Statistic df Sig.
Math 0
.033 162 .200(*) .990 162 .282
achievement
1 .030 162 .200(*) .997 162 .975
2 .055 162 .200(*) .990 162 .345
* This is a lower bound of the true significance.
a Lilliefors Significance Correction
[표 2] 결과, Time 0, 1, & 2 각 시점마다 Shapiro-Wilk의 Sig. 값이 각각 .282, .975
그리고 .345 로 영가설이 지지되어 정규성 가정을 만족시키는 것으로 나타났다.
18
19.
(iv) 등분산성 검증
[표 8] Level 1 의 등분산성 검증
Levene
Statistic df1 df2 Sig.
Math achievement Based on Mean 1.499 2 477 .224
Based on Median 1.270 2 477 .282
Based on Median and
1.270 2 463.719 .282
with adjusted df
Based on trimmed
1.394 2 477 .249
mean
등분산성 검증 역시 [표 3] 결과를 통해 지지되었음을 알 수 있다.
(2) Level 2
(i) 기술통계량
ELL_ENG 각 집단의 Aggregated Math achievement의 기술통계량 (평균, 표준편차, 왜도,
첨도 등)은 다음과 같다.
[표 9] Level 2 의 기술통계
ell_eng Statistic Std. Error
Aggregated Math .00 Mean 144.0600 5.36540
achievement Variance 1439.377
Std. Deviation 37.93913
Skewness -.716 .337
Kurtosis .143 .662
1.00 Mean 113.0208 2.63800
Variance 779.412
Std. Deviation 27.91796
Skewness -.146 .228
Kurtosis -.172 .453
19
20.
(ii) 변수 분포
210.00
Normal Q-Q Plot of mathach
180.00 for ell_eng= .00
4
150.00
mathach
2
Expected Normal
120.00
0
90.00
104
60.00 -2
104
30.00
-4
.00 1.00 50 100 150 200
ell_eng Observed Value
집단 수준에서도 원 자료의 분포가 제대로 되어 있는지에 대한 확인을 위해 ell-english 각
집단마다(native vs. non-native)의 mean math acheivement에 대한 box-plot 도표와
잔차도표를 구한 결과, 1 개의 outlier 값이 (case 번호 104) 관찰되었다. 가설 검증을 위한
데이터의 사례수가 충분하므로 여기서는 보다 정확한 추정을 위해 이 1 개의 값 또한
제거하고(level 1 에서는 총 3 개 case 제거) 분석을 시작하였다.
(ⅲ) 정규성 검증
[표 10] Level 2 의 정규성 검증
ell_eng Kolmogorov-Smirnov(a) Shapiro-Wilk
Statistic df Sig. Statistic df Sig.
Aggregated Math .00
.162 50 .002 .953 50 .043
achievement
1.00 .050 112 .200(*) .996 112 .983
* This is a lower bound of the true significance.
a Lilliefors Significance Correction
[표 5] 결과, ell-english 각 집단마다 Shapiro-Wilk의 Sig. 값이 각각 .043, .983 으로 나타나
non-native집단의 경우에는 정규성 가정이 지지된 반면 native집단은 정규성 가정을
만족시키지 못하는 것으로 나타났다. 하지만, 일반적으로 표본의 수가 어느 정도 많은 경우,
20
21.
잔차에 대한 분포가정규분포를 따르지 않더라도, 종모양의 비슷한 형태를 나타내기만
4
한다면 정규성 가정이 만족되지 못하더라도 심각한 문제가 발생하지 않는다 . 실제,
빈도분석 결과, 전반적으로 종모양의 형태를 띠는 것으로 나타났으므로 정규성 가정에
문제가 없다고 판단을 내리고 분석을 진행하였다.
(iv) 등분산성 검증
[표 11] Level 2 의 등분산성 검증
Levene
Statistic df1 df2 Sig.
Aggregated Math Based on Mean 1.035 1 160 .310
achievement Based on Median .640 1 160 .425
Based on Median
and with adjusted .640 1 143.971 .425
df
Based on trimmed
.879 1 160 .350
mean
Level 1 과 마찬가지로 Level 2 의 등분산성 검증 역시 [표 6] 결과를 통해 지지되었음을 알
수 있다.
(3) Level 1 과 Level 2 변수 요약
기초통계 결과를 바탕으로, 6 개의 outlier 값들을(level 1 수준) 제거하고 분석을 시작하였으며
전반적으로 Level 1, Level 2 모두 선형 모형 가설 검증에 필요한 가정들을 모두 만족시키고
있으므로 이 데이터를 기초로 하여 위계적 선형 모형 (HLM) 검증을 시작하였다.
3. 위계적 선형 모형 (Hierarchical Linear Model, HLM) – Individual Change Model
(1) Time 변이에 대한 설정 방법 제시하기
이 자료에서는 각 개인의 수학성적 점수를 Fall 2003, Winter 2004, 그리고 Spring 2004 년
세 번에 걸쳐 측정하였으므로 첫번째 측정 시점인 Fall 2003 을 기준으로 삼아 Fall 2003 을
0, Winter 2004 을 1, Spring 2004 를 2 로 설정하였다.
4
이군희 (2000). 사회과학 연구방법론, 법문사
21
22.
(2) 1 차함수 vs. 2 차 함수 결정
일반적으로 각 개인별 관찰 시점 갯수가 적을 때는 (예를 들면, 3, 4 개의 시점) 1 차
5
선형함수를 사용하는 것이 더 유용하다 . 또한, 실제로 개인 변화(성장) 모형에서는
[측정시점 총 갯수-2] 함수가 사용가능하다. 현재 자료에서는 측정 시점이 3 개밖에
없으므로 1 차 선형함수를 채택하고자 한다.
선형 성장 모형은 다음과 같다.
Level 1
Yti = π 0i + π 1i ati + eti
Level 2
Q0
π 0i = β 00 + ∑ β 0 q X qi + r0i
q =1
Q1
π 1i = β10 + ∑ β1q X qi + r1i
q =1
(3) A Random-Coefficient Regression Model – unconditional model
기초 모형은 각 개인의 수학성적은 시간에 의해 영향을 받으며(Level 1 모형) 개인간 차이는
없다고 상정하고 모형을 설정하였다. 이 때, Time은 0 자체를 이미 초기시점인 Fall
2003 으로 설정을 하였으므로 시점 변수를 centering를 하지 않아도 되므로 여기서 Time
변수는 uncentered로 설정하였다.
Level 1
MATHACH ti = π 0i + π 1i (TIMEti ) + eti
Level 2
π 0i = β 00 + r0i
π 1i = β10 + r1i
HLM 결과는 아래 [표 7]과 같다.
5
Raudenbush & Bryk (2002). Ch. 6 Applications in the Study of Individual Change, Hierarchical
Linear Models: Applications and Data Analysis Methods, 2nd edition, Thousand Oaks, Sage
Publications.
22
23.
[표 12] 수학성적의선형 성장 모형 – unconditional model
Fixed Effect Coefficient Standard Error T-ratio
INTRCPT2, β 00 112.489538 2.710107 41.507
INTRCPT2, β10 10.024796 0.616192 16.269
Random Effect Variance Component df Chi-square P-value
INTRCPT1, r0i 1092.30226 161 1994.36828 0.000
TIME slope, r1i 3.54503 161 170.85796 0.282
level-1, eti 114.32684
Reliability of OLS Regression Coefficient Estimate
Initial status π 0i 0.90525105
Growth rate π 1i 0.030075284
(i) Mean Growth Trajectory
[표 7]의 고정효과 결과를 통해, 초기 평균 수학성적(B00)이 112.489538 점이며 각 개인의
수학성적은 시점이 1 씩 증가할수록(한 학기마다) 10.024796 만큼 증가함을 알 수 있다.
(ii) Individual Variation in Growth Trajectories
개인간 분산은 무선효과 결과를 통해 알 수 있다. 개인 성장 모수인 π 0i , π 1i 의 분산
추정치는 각각 1092.30226, 3.54503 이다. 3 장에서 제시되어 있듯이 개인들의 변화(성장)
모수의 변화가 없다는 것을 검증하기 위해 χ 2 검증을 한 결과, 절편인 r0i 는 1994.36828
(df= 161, p<.000)이다. 이는, 영가설을 기각하므로 각 개인은 초기 시점(Time 0 시점)에서
그들의 수학성적은 유의미하게 차이가 있음을 알 수 있다. 이와 반대로 개인의 변화(성장)률
영가설에 (i.e. H0: π 1i = 0) 대한 χ2 값은 170.85796 으로 영가설이 지지되어 개인의
변화(성장)률이 유의미한 차이가 없음을 보여주었다 (df=161, p<.282). 이는, 초기 수학
성적은 개인간 차이에 의해 더 설명될 수 있는 부분이 있는 반면, 변화 기울기는 시점에
의해 모두 설명이 되어졌다는 의미로 해석할 수 있다.
(iii) Reliability of Initial Status and Change
초기 수학성적과 개인 변화(성장)률에 대한 신뢰도는 식 6.7 을 통해
각각 .90525105 과 .030075284 로 나타났다 (표 7 참조). 이는 이 자료에서 초기
수학성적에서만 개인간 차이가 있음을 보여주고 있으므로 초기 수학성적(절편)은
23
24.
개인수준의 변수에 의해영향을 받은 것으로 해석할 수 있다.
(iv) Correlation of Change with Initial Status
선형 개인 변화(성장) 모형에서는 이들 변수들간 상관관계는 식 6.8 을 통해 구할 수 있다.
여기서는 실제 변화와 실제 초기 수학성적 상태간 상관관계 추정치는 .282 이다. 이는 초기
시점에 보다 높은 수학성적을 가진 개인이 보다 빠른 속도로 수학성적이 향상된다는 의미로
앞서 언급한 것과 같이 π 0i 는 시점 변수인 Timeti 에 영향을 받음을 다시 확인할 수 있다.
(4) An Intercepts- and Slopes-as-Outcomes Model
Level 1 모형은 unconditional model에서 설정한 식 그대로 유지하고 여기서는 ell-
english라는 level 2 수준의 변수 (더미변수로 0 = native, 1=non-native를 지칭)를 추가하였다.
이를 바탕으로 다음과 같이 모형을 설정하였다. 이 때, ELL-ENGLISH에서 0 은 non-
native임을 나타내므로 x 절편이 0 일 때의 값이 non-native인 사람들의 수학성적을
나타내므로 centering을 하지 않아도 되므로 uncentered하여 모형에 추가하였다. 반면,
π 1i 에는 앞서 Time에 의해 모두 설명되었으므로 여기서는 slope에는 개인수준 변수인 ELL-
ENGLISH를 포함하지 않았다.
Level 1
MATHACH ti = π 0i + π 1i (TIMEti ) + eti
Level 2
π 0i = β 00 + β 01 ( ELL _ ENG ) i + r0i
π 1i = β10 + r1i
[표 13] 수학성적의 선형 성장 모형 – ELL-ENGLISH 효과
Fixed Effect Coefficient Standard Error T-ratio Approx. d.f. P-value
Model for initial status, π 0i
INTRCPT2, β 00 133.927113 5.344405 25.059 160 0.000
ELL_ENG, β 01 -31.025648 5.920476 -5.24 160 0.000
Model for growth rate, π 1i
INTRCPT2, β10 10.032149 0.613825 16.344 161 0.000
[표 8]은 고정효과 추정치를 나타내고 있다. 여기서 ELL-ENGLISH의 t값은 -.5.24 로 초기
수학성적과 비교적 높은 상관관계를 보이고 있다. 평균적으로 영어가 모국어인 사람들보다
영어가 모국어가 아닌 사람들의 초기 수학성적이 31.03 정도 낮은 것으로 나타났다.
24
25.
[표 14] ELL_ENGLISH결과의 초기 수학성적과 성장(변화)률의 설명 변량
Model Initial Status Var. Growth Rate Var.
Unconditional 1092.30226 3.54503
Conditional on Ell-English 892.98716 3.69333
Propotions of variance explained 18.25% -4.18%
[표 9]는 이 모형의 무선호과의 분산 추정치를 제시하고 있으며 이를 기초모형(unconditional
model)에서 나타난 분산 추정치와 비교한 결과를 제시해주고 있다. 식 4.24 에 의하여
설명된 분산 비율 (the proportion of variance explained)를 구하면 ELL-ENGLISH가 초기
수학성적의 분산 모수치의 18.25%를 설명해주고 있다.
[표 8]과 [표 9]를 종합해볼 때, ELL-ENGLISH 변수가 개인들의 초기 수학성적에 영향을
미치는 것을 알 수 있다. 즉, ELL-ENGLISH 변인을 투입하는 것이 보다 효과적이었다.
25
![HLM Question 1
1. 데이터에 사용된 변수들에 대한 설명
Variable Name Description
Student level (Level 1)
MATH ACHIEVEMENT A measure of mathematics achievement (mean=12.75, sd=6.88)
A standardized scale constructed from variables measuring parental
SES
education, occupation, and income
MINORITY An indicator for student ethnicity (1=minority, 0 =others)
FEMALE An indicator for student gender (1=female, 0=male)
School level (Level 2)
SIZE School enrollment
SECTOR 1= Catholic, 2=Public
PRACAD Proportion of students in the academic track
DISCLIM A scale measuring disciplinary climate
HIMNTY 1=More than 40% minority enrollment, 0=less than 40%
Mean of the SES values for the students in this school who are included in
MEANSES
the level-1 file
2. 기술통계
(1) Level 1
(i) 기술통계량
Minority에 따른 Math achievement의 기술통계량 (평균, 표준편차, 왜도, 첨도 등)은 다음과
같다.
[표 1] Minority에 따른 Math Achievement의 기술통계
minority Statistic Std. Error
mathach 0 Mean 13.88239 .092219
Variance 44.316
Std. Deviation 6.657021
Skewness -.331 .034
Kurtosis -.789 .068
2](https://image.slidesharecdn.com/hlmfinalprojectfinal-111117172352-phpapp01/85/HLM-final-project-2-320.jpg)
![1 Mean 9.75288 .147363
Variance 42.867
Std. Deviation 6.547308
Skewness .190 .055
Kurtosis -.825 .110
(ii) 변수 분포
3
5,321
2
1
0
-1
-2
4,599
5,009
4,899
-3
6,033
-4
ses minority female
원 자료의 분포가 제대로 되어 있는지, 결측치가 존재하는지 확인을 하기 위해 각 변수들에
대한 box-plot 도표와 잔차 도표를 구한 결과, 3 개의 outlier값들 (case 번호 4899, 5321,
6033)이 관찰되었다. 가설 검증을 위한 데이터 사례수 가 충분하므로 여기서는 보다 정확한
추정을 위해 이 3 개의 outlier 값을 제거하고 분석을 시작하였다.
(ⅲ) 정규성 검증
[표 2] Minority에 따른 Math Acheivement의 정규성 검증
Kolmogorov-Smirnov(a) Shapiro-Wilk
minority Statistic df Sig. Statistic df Sig.
mathach 0 .058 5211 .000
1 .054 1974 .000 .980 1974 .000
a Lilliefors Significance Correction
3](https://image.slidesharecdn.com/hlmfinalprojectfinal-111117172352-phpapp01/85/HLM-final-project-3-320.jpg)
![[표 3] Female에 따른 Math Achievement의 정규성 검증
Kolmogorov-Smirnov(a) Shapiro-Wilk
female Statistic df Sig. Statistic df Sig.
mathach 0 .059 3390 .000 .965 3390 .000
1 .047 3795 .000 .980 3795 .000
a Lilliefors Significance Correction
[표 2]와 [표 3] 결과 정규성 영가설이 기각되어 정규성 가정을 만족시키지 못하는 것으로
나타났다. 하지만, 일반적으로 표본의 수가 어느 정도 많은 경우, 잔차에 대한 분포가
정규분포를 따르지 않더라도, 종모양의 비슷한 형태를 나타내기만 한다면 정규성 가정이
1
만족되지 못하더라도 심각한 문제가 발생하지 않는다 . 실제, 빈도분석 결과, 전반적으로
종모양의 형태를 띠는 것으로 나타났으므로 정규성 가정에 문제가 없다고 판단을 내리고
분석을 진행하였다.
(iv) 등분산성 검증
[표 4] Minority에 따른 Math Achievement의 등분산성 검증
Levene
Statistic df1 df2 Sig.
mathach Based on Mean 1.034 1 7183 .309
Based on Median .765 1 7183 .382
Based on Median and with
.765 1 7178.133 .382
adjusted df
Based on trimmed mean .875 1 7183 .350
[표 4] 결과, Minority에 따른 Math Achievement의 등분산성에 대한 영가설이 지지되었으므로
등분산성 조건을 만족시켰다.
1
이군희 (2000). 사회과학 연구방법론, 법문사
4](https://image.slidesharecdn.com/hlmfinalprojectfinal-111117172352-phpapp01/85/HLM-final-project-4-320.jpg)
![[표 5] Female에 따른 Math Achievement의 등분산성 검증
Levene
Statistic df1 df2 Sig.
mathach Based on Mean 13.411 1 7183 .000
Based on Median 11.710 1 7183 .001
Based on Median and with
11.710 1 7150.795 .001
adjusted df
Based on trimmed mean 12.547 1 7183 .000
반면, Female에 따른 Math Achievement의 등분산성 검증은 영가설이 기각되어 등분산성
조건을 만족시키지 못하였으므로 차후 위계적 선형 모형에서 Female 변수의 분산을
이질적으로 설정하고 분석하고자 한다.
Var (rij ) = σ ij and log(σ ij ) = α 0 + α 1 ( FEMALEij )
2 2
[표 6] Comparison of Homogeneous and Heterogeneous Level-1 Variance Models for
Mathematics Achievement
(i) Results for Homogeneous Variance Model Standard Approx.
Fixed Effect Coefficient Error T-ratio d.f. P-value
For INTRCPT1, B0
INTRCPT2, G00 12.629710 0.135239 93.388 155 0.000
SECTOR, G01 0.618126 0.372608 1.659 155 0.099
PRACAD, G02 3.184714 0.905697 3.516 155 0.001
HIMINTY, G03 -1.121324 0.343665 -3.263 155 0.002
MEANSES, G04 3.841524 0.486533 7.896 155 0.000
For MINORITY slope, B1
INTRCPT2, G10 -3.090744 0.255884 -12.079 155 0.000
SECTOR, G11 2.493258 0.709652 3.513 155 0.001
PRACAD, G12 -0.754729 1.616671 -0.467 155 0.641
HIMINTY, G13 0.167364 0.544001 0.308 155 0.759
MEANSES, G14 -0.258677 0.810272 -0.319 155 0.750
For FEMALE slope, B2
INTRCPT2, G20 -1.104894 0.201094 -5.494 155 0.000
SECTOR, G21 0.238812 0.560862 0.426 155 0.670
PRACAD, G22 0.295424 1.368173 0.216 155 0.830
5](https://image.slidesharecdn.com/hlmfinalprojectfinal-111117172352-phpapp01/85/HLM-final-project-5-320.jpg)


![전반적으로 Level 1, Level 2 모두 선형 모형 가설 검증에 필요한 가정들을 모두 만족시키고
있으므로 이 데이터를 기초로 하여 위계적 선형 모형 (HLM) 검증을 시작하였다.
3. 위계적 선형 모형 (Hierarchical Linear Model, HLM)
(1) 기본 모형 (null model) 설정 및 Intraclass correlation
MATHACH ij = β 0 j + rij
β 0 j = γ 00 + µ 0 j
위와 같이 기본 모형을 설정하고 이를 토대로 구한 Intraclass correlation 값은 다음과 같다.
Intraclass correlation = 8.61431/(8.61431+39.14831)=0.18036
즉, 학교간 변량의 차이가 약 18%임을 알 수 있다.
(2) Level 1 의 모형 결정
(i) Level 1 변수 설정
[표 7] Random Coefficient Model of Mathematics Achievement
Fixed Effect Coefficient se t Ratio
School Mean Achievement , γ 00 12.635 0.245 51.637
Minority Gap, γ 10 -2.930 0.267 -10.956
Female, γ 20 -1.128 0.185 -6.097
SES, γ 30 1.891 0.121 15.622
Random Effect, Variance df χ2 p value
Component
8.729 99 924.381 .000
Mean Achievement, u0 j
2.429 99 125.395 .038
Minority Gap, u1 j
0.725 99 121.728 .060
Female, u2 j
0.428 99 113.667 0.149
SES, u3 j
35.264
Level-1 effect, rij
Correlation Among School Effects Minority Female SES Mean
10](https://image.slidesharecdn.com/hlmfinalprojectfinal-111117172352-phpapp01/85/HLM-final-project-10-320.jpg)
![Achievement
Minority - .013 -.273 -.268
Female .013 - -.069 -.123
SES -.273 -.069 - .361
Mean Achievement -.268 -.123 .361 -
Reliability of OLS Regression-Coefficient Estimations
Mean Achievement .908
Minority Gap .227
Female .166
SES .178
[표 7]에서 제시된 상관관계표 결과, SES(- .361), MINORITY(-.268), FEMALE (-.123) 등의
순으로 MATH ACHIEVEMENT와 높은 상관관계를 가짐을 알 수 있다. 따라서, SES를 제일
먼저 모형에 입력하고 그 다음이 minority, female 순으로 모형에 입력하였다.
(ii) Centering 결정
Centering은 집단 평균으로 교정하였다 (group mean centering). 이는, 강상진과 정혜경
(2002)이 “연구자가 가장 안정적인 절편 모수 γ 00 를 얻고자 한다면, Level 1 에서 예측변수의
중심점을 교정하고 Level 2 예측변수를 전체평균으로 교정하는 방식을 권장한다”는 주장에
근거하여 설정하였다 2. 또한, 실제 각 개인들의 예측변수들은 전체 집단보다는 그 개인이
속한 집단의 특성에 더 많은 영향을 받으므로 전체평균에 의한 교정보다는 집단평균에 의한
교정이 더 적절하다고 판단되어 이 연구에서는 level 1 수준에서는 집단수준의 평균에 의한
교정을 적용하였다.
(iii) OLS 모수치에 대한 신뢰도 계수 - Random, Non-Random, Fixed 변수 선정
Level 1 수준의 변인들을 선정함에 있어서 centering 이외에도 각 변수들을 random, non-
random 또는 fixed로 봐야하는지에 대한 결정이 이루어져야 한다. 이를 결정하는 방법 중
하나가 OLS 모수치에 대한 신뢰도 계수이다. 계산 결과, Mean Achievement (.908), Minority
Gap (.227), Female (.166), 그리고 SES (.178)으로 나타났다 (표 7 참조). 모든 변수들의
신뢰도 계수가 .05 보다 크므로 random으로 설정하였다.
(3) Level 2 의 모형 결정
2
강상진, 정혜경 (2002). 다층모형에서 예측변수 척도의 중심점 교정과 모수추정치의 변화,
교육평가 연구, 제 15권 제 2호.
11](https://image.slidesharecdn.com/hlmfinalprojectfinal-111117172352-phpapp01/85/HLM-final-project-11-320.jpg)
![(i) Level 2 변수 설정
Level 2 의 변수를 설정하기 위해 Level 2 수준에서의 탐색적 분석 (Exploratory Analysis)를
수행하였다.
[표 8] Exploratory Analysis: estimated level-2 coefficients and their standard errors
Level-1 Coefficient Potential Level-2 Predictors
SIZE SECTOR PRACAD DISCLIM HIMINTY MEANSES
INTRCPT1,B0
Coefficient -0.000 2.564 7.503 -1.350 -2.400 5.375
Standard Error 0.000 0.402 0.643 0.203 0.463 0.334
t value -1.290 6.372 11.668 -6.647 -5.177 16.112
분석 결과, 가장 많은 영향을 미치는 변수가 meanses (16.112), pracad (11.668), disclaim(-
6.647), sector(6.372), himinty(-5.177), size(-1.290) 순이다. size는 영향이 극히 작으므로
변수에서 제외한다. 그리고, sector와 disclim의 상관이 -.712 로서 절대값 .70 을 넘으므로
disclim을 삭제해주는 것이 바람직하다. 나머지 변수들의 상관은 .70 이하이므로 모두 level
2 의 모형에 투입하였다. 결과적으로 level 2 수준에 포함되는 변수들은 meanses, pracad,
sector, himinty으로 결정하였다.
위와 같은 level 1 과 level 2 수준 각각의 변인들을 기반으로 다음과 같은 연구모형을
설정하였다.
Level 1
Yij = β 0 j + β1 j ( SES ) ij + β 2 j ( MINORITY ) ij + β 3 j ( FEMALE ) ij + rij .
Level 2
β 0 j = γ 00 + γ 01 ( SECTOR ) ij + γ 02 ( PRACAD) ij + γ 03 ( HIMINTY ) ij + γ 04 ( MEAN SES ) ij + u 0 j
β 1 j = γ 10 + γ 11 ( SECTOR) ij + γ 12 ( PRACAD) ij + γ 13 ( HIMINTY ) ij + γ 14 ( MEAN SES ) ij + u1 j
β 2 j = γ 20 + γ 21 ( SECTOR) ij + γ 22 ( PRACAD) ij + γ 23 ( HIMINTY ) ij + γ 24 ( MEAN SES ) ij + u 2 j
β 3 j = γ 30 + γ 31 ( SECTOR) ij + γ 32 ( PRACAD) ij + γ 33 ( HIMINTY ) ij + γ 34 ( MEAN SES ) ij + u 3 j
(4) Level 1 에서의 specification issue
12](https://image.slidesharecdn.com/hlmfinalprojectfinal-111117172352-phpapp01/85/HLM-final-project-12-320.jpg)
![[표 9] Confounding Effects of Minority
With Fixed Effects of Minority
Original Model Estimates
Added
Fixed Effect Coefficient Standard Error Coefficient Standard Error
Model for school mean, B0j
INTERCEPT, G00 12.632 0.140 12.632 0.141
MEAN SES, G01 4.478 0.446 4.477 0.446
PREACAD, G02 3.485 0.726 3.49 0.726
Model for FEMALE slope, B1j
INTERCEPT, G10 -1.081 0.197 -1.132 0.193
MEAN SES, G11 0.035 0.674 0.053 0.661
PREACAD, G12 0.745 1.159 0.695 1.137
Model for SES slope, B2j
INTERCEPT, G20 2.179 0.119 1.944 0.117
MEAN SES, G21 1.374 0.381 1.316 0.370
PREACAD, G22 -2.689 0.612 -2.461 0.594
Model for Minority slopes, B3j
INTERCEPT, G30 -2.892 0.220
Condition 1: Minority변수를 제거한 모형과 Minority 변수를 fixed effect로 추가하여 본 모형
두개를 비교했을 때, 후자 모형의 coefficient값이 전자 모형에 비해 줄어듬을 알 수 있다.
이는 Minority와 SES간 상관이 있기 때문이다. 그러므로, Minority를 제거해서는 안된다.
[표 10] Random Coefficient Regression of Minority on SES
Model
Yij=B0j+Bij(SES)ij+rij
where Yij=minority of student I in school j
Boj=G00+U0j
Bij=G01+U1j
Fixed Effect Coefficient Standard Error T-ratio
Mean intercept, G00 0.275 0.024 11.535
Mean SES slope, G01 -0.080 0.010 -8.450
13](https://image.slidesharecdn.com/hlmfinalprojectfinal-111117172352-phpapp01/85/HLM-final-project-13-320.jpg)
![Random Effect Variance Component df Chi-square P-value
Intercept, U0j 0.088 159 6518.94 0.000
SES slope, U1j 0.009 159 440.324 0.000
Exploratory Regressions of B*ij on MEAN SES and PREACAD
Coefficient Standard Error Approximate t-to-Enter
MEAN SES 0.021 0.014 1.432
PREACAD 0.033 0.023 1.421
Condition 2: Random coefficient regression model 결과, Mean SES slope인 G01 는 매우
유의미한 값을 가진다. (t= -8.450) 그러므로 Minority는 원래 존재하는 SES와 관계를 가지고
있기 때문에 제거해서는 안된다.
Condition 3: SES와 Minority간 관계가 학교마다 차이가 있음이 나타났으며 [Var(U1j)=.009,
p=.000] 이 기울기는 MEAN SES나 PREACAD와 같은 다른 학교수준의 변수들과 유의미한
관계를 가짐을 보임으로써 Minority는 모형에서 제거해서는 안되는 것을 다시 한번
검증하였다.
(5) Level 2 에서의 specification issue
Original Model Specification Test
Mean SES missing
Estimates (Fixed ses slope)
Fixed Effect Coefficient se Coefficient se Coefficient se
Model for school mean, B0j
INTERCEPT, G00 12.630 0.133 12.619 0.158 12.619 0.158
SECTOR, G10 0.627 0.366 0.339 0.435 0.339 0.434
PREACAD, G02 3.171 0.890 7.464 0.853 7.460 0.853
HIMINTY, G03 -1.125 0.338 -2.339 0.359 -2.343 0.358
MEAN SES, G04 3.840 0.478
For MINORITY slope, B1j
INTERCEPT, G10 2.467 0.692 -3.066 0.250 -3.089 0.250
SECTOR, G11 -3.068 0.250 2.476 0.693 2.479 0.692
PREACAD, G12 -0.784 1.577 -0.914 1.577 -0.818 1.573
HIMINTY, G13 0.080 0.528 0.111 0.528 0.037 0.527
MEAN SES, G14 -0.220 0.787 -0.106 0.788 -0.207 0.782
14](https://image.slidesharecdn.com/hlmfinalprojectfinal-111117172352-phpapp01/85/HLM-final-project-14-320.jpg)

![HLM Question 2
1. 데이터에 사용된 변수들에 대한 설명
Variable Name Description
Repeated-Observations Model (Level 1)
TIME 0=Fall 2003, 1=Winter 2004, 2=Spring 2004
MATH ACHIEVEMENT Mathematics test scores (mean=122.64, sd=36.44)
Person-Level Model (Level 2)
ELL_ENG 0=Native, 1=Non Native
2. 기술통계
(1) Level 1
(i) 기술통계량
Time 0,1, & 2 각 시점의 Math achievement의 기술통계량 (평균, 표준편차, 왜도, 첨도 등)은
다음과 같다.
[표 6] Level 1 의 기술통계
time Statistic Std. Error
Math achievement 0 Mean 109.60 2.941
Variance 1400.975
Std. Deviation 37.430
Skewness -.238 .191
Kurtosis .246 .379
1 Mean 124.56 2.804
Variance 1273.876
Std. Deviation 35.691
Skewness .004 .191
Kurtosis -.201 .379
2 Mean 131.52 2.851
Variance 1316.363
Std. Deviation 36.282
Skewness .105 .191
Kurtosis -.330 .379
[표 1]을 살펴보면, 전반적으로 Time 0, 1, & 2 각 시점마다의 Math Achievement 점수의
분포가 정상분포를 이루고 있음을 알 수 있다.
17](https://image.slidesharecdn.com/hlmfinalprojectfinal-111117172352-phpapp01/85/HLM-final-project-17-320.jpg)
![(ii) 변수 분포
250 Normal Q-Q Plot of fall cbm score, wrc
for time= 0
200 3
fall cbm score, wrc
2
150
Expected Normal
1
100 0
-1
50
312
-2
61
0
196 118 -3
0 1 2 0 50 100 150 200 250
time Observed Value
원 자료의 분포가 제대로 되어 있는지에 대한 확인을 위해 Time 0, 1, & 2 각 시점마다 box-
plot 도표와 잔차도표를 구한 결과, 3 개의 outlier 값들이 (case 번호 61, 118, 196)
관찰되었다. 가설 검증을 위한 데이터의 사례수가 충분하므로 여기서는 보다 정확한 추정을
위해 이 3 개의 값을 제거하고 분석을 시작하였다.
(ⅲ) 정규성 검증
[표 7] Level 1 의 정규성 검증
time Kolmogorov-Smirnov(a) Shapiro-Wilk
Statistic df Sig. Statistic df Sig.
Math 0
.033 162 .200(*) .990 162 .282
achievement
1 .030 162 .200(*) .997 162 .975
2 .055 162 .200(*) .990 162 .345
* This is a lower bound of the true significance.
a Lilliefors Significance Correction
[표 2] 결과, Time 0, 1, & 2 각 시점마다 Shapiro-Wilk의 Sig. 값이 각각 .282, .975
그리고 .345 로 영가설이 지지되어 정규성 가정을 만족시키는 것으로 나타났다.
18](https://image.slidesharecdn.com/hlmfinalprojectfinal-111117172352-phpapp01/85/HLM-final-project-18-320.jpg)
![(iv) 등분산성 검증
[표 8] Level 1 의 등분산성 검증
Levene
Statistic df1 df2 Sig.
Math achievement Based on Mean 1.499 2 477 .224
Based on Median 1.270 2 477 .282
Based on Median and
1.270 2 463.719 .282
with adjusted df
Based on trimmed
1.394 2 477 .249
mean
등분산성 검증 역시 [표 3] 결과를 통해 지지되었음을 알 수 있다.
(2) Level 2
(i) 기술통계량
ELL_ENG 각 집단의 Aggregated Math achievement의 기술통계량 (평균, 표준편차, 왜도,
첨도 등)은 다음과 같다.
[표 9] Level 2 의 기술통계
ell_eng Statistic Std. Error
Aggregated Math .00 Mean 144.0600 5.36540
achievement Variance 1439.377
Std. Deviation 37.93913
Skewness -.716 .337
Kurtosis .143 .662
1.00 Mean 113.0208 2.63800
Variance 779.412
Std. Deviation 27.91796
Skewness -.146 .228
Kurtosis -.172 .453
19](https://image.slidesharecdn.com/hlmfinalprojectfinal-111117172352-phpapp01/85/HLM-final-project-19-320.jpg)
![(ii) 변수 분포
210.00
Normal Q-Q Plot of mathach
180.00 for ell_eng= .00
4
150.00
mathach
2
Expected Normal
120.00
0
90.00
104
60.00 -2
104
30.00
-4
.00 1.00 50 100 150 200
ell_eng Observed Value
집단 수준에서도 원 자료의 분포가 제대로 되어 있는지에 대한 확인을 위해 ell-english 각
집단마다(native vs. non-native)의 mean math acheivement에 대한 box-plot 도표와
잔차도표를 구한 결과, 1 개의 outlier 값이 (case 번호 104) 관찰되었다. 가설 검증을 위한
데이터의 사례수가 충분하므로 여기서는 보다 정확한 추정을 위해 이 1 개의 값 또한
제거하고(level 1 에서는 총 3 개 case 제거) 분석을 시작하였다.
(ⅲ) 정규성 검증
[표 10] Level 2 의 정규성 검증
ell_eng Kolmogorov-Smirnov(a) Shapiro-Wilk
Statistic df Sig. Statistic df Sig.
Aggregated Math .00
.162 50 .002 .953 50 .043
achievement
1.00 .050 112 .200(*) .996 112 .983
* This is a lower bound of the true significance.
a Lilliefors Significance Correction
[표 5] 결과, ell-english 각 집단마다 Shapiro-Wilk의 Sig. 값이 각각 .043, .983 으로 나타나
non-native집단의 경우에는 정규성 가정이 지지된 반면 native집단은 정규성 가정을
만족시키지 못하는 것으로 나타났다. 하지만, 일반적으로 표본의 수가 어느 정도 많은 경우,
20](https://image.slidesharecdn.com/hlmfinalprojectfinal-111117172352-phpapp01/85/HLM-final-project-20-320.jpg)
![잔차에 대한 분포가 정규분포를 따르지 않더라도, 종모양의 비슷한 형태를 나타내기만
4
한다면 정규성 가정이 만족되지 못하더라도 심각한 문제가 발생하지 않는다 . 실제,
빈도분석 결과, 전반적으로 종모양의 형태를 띠는 것으로 나타났으므로 정규성 가정에
문제가 없다고 판단을 내리고 분석을 진행하였다.
(iv) 등분산성 검증
[표 11] Level 2 의 등분산성 검증
Levene
Statistic df1 df2 Sig.
Aggregated Math Based on Mean 1.035 1 160 .310
achievement Based on Median .640 1 160 .425
Based on Median
and with adjusted .640 1 143.971 .425
df
Based on trimmed
.879 1 160 .350
mean
Level 1 과 마찬가지로 Level 2 의 등분산성 검증 역시 [표 6] 결과를 통해 지지되었음을 알
수 있다.
(3) Level 1 과 Level 2 변수 요약
기초통계 결과를 바탕으로, 6 개의 outlier 값들을(level 1 수준) 제거하고 분석을 시작하였으며
전반적으로 Level 1, Level 2 모두 선형 모형 가설 검증에 필요한 가정들을 모두 만족시키고
있으므로 이 데이터를 기초로 하여 위계적 선형 모형 (HLM) 검증을 시작하였다.
3. 위계적 선형 모형 (Hierarchical Linear Model, HLM) – Individual Change Model
(1) Time 변이에 대한 설정 방법 제시하기
이 자료에서는 각 개인의 수학성적 점수를 Fall 2003, Winter 2004, 그리고 Spring 2004 년
세 번에 걸쳐 측정하였으므로 첫번째 측정 시점인 Fall 2003 을 기준으로 삼아 Fall 2003 을
0, Winter 2004 을 1, Spring 2004 를 2 로 설정하였다.
4
이군희 (2000). 사회과학 연구방법론, 법문사
21](https://image.slidesharecdn.com/hlmfinalprojectfinal-111117172352-phpapp01/85/HLM-final-project-21-320.jpg)
![(2) 1 차 함수 vs. 2 차 함수 결정
일반적으로 각 개인별 관찰 시점 갯수가 적을 때는 (예를 들면, 3, 4 개의 시점) 1 차
5
선형함수를 사용하는 것이 더 유용하다 . 또한, 실제로 개인 변화(성장) 모형에서는
[측정시점 총 갯수-2] 함수가 사용가능하다. 현재 자료에서는 측정 시점이 3 개밖에
없으므로 1 차 선형함수를 채택하고자 한다.
선형 성장 모형은 다음과 같다.
Level 1
Yti = π 0i + π 1i ati + eti
Level 2
Q0
π 0i = β 00 + ∑ β 0 q X qi + r0i
q =1
Q1
π 1i = β10 + ∑ β1q X qi + r1i
q =1
(3) A Random-Coefficient Regression Model – unconditional model
기초 모형은 각 개인의 수학성적은 시간에 의해 영향을 받으며(Level 1 모형) 개인간 차이는
없다고 상정하고 모형을 설정하였다. 이 때, Time은 0 자체를 이미 초기시점인 Fall
2003 으로 설정을 하였으므로 시점 변수를 centering를 하지 않아도 되므로 여기서 Time
변수는 uncentered로 설정하였다.
Level 1
MATHACH ti = π 0i + π 1i (TIMEti ) + eti
Level 2
π 0i = β 00 + r0i
π 1i = β10 + r1i
HLM 결과는 아래 [표 7]과 같다.
5
Raudenbush & Bryk (2002). Ch. 6 Applications in the Study of Individual Change, Hierarchical
Linear Models: Applications and Data Analysis Methods, 2nd edition, Thousand Oaks, Sage
Publications.
22](https://image.slidesharecdn.com/hlmfinalprojectfinal-111117172352-phpapp01/85/HLM-final-project-22-320.jpg)
![[표 12] 수학성적의 선형 성장 모형 – unconditional model
Fixed Effect Coefficient Standard Error T-ratio
INTRCPT2, β 00 112.489538 2.710107 41.507
INTRCPT2, β10 10.024796 0.616192 16.269
Random Effect Variance Component df Chi-square P-value
INTRCPT1, r0i 1092.30226 161 1994.36828 0.000
TIME slope, r1i 3.54503 161 170.85796 0.282
level-1, eti 114.32684
Reliability of OLS Regression Coefficient Estimate
Initial status π 0i 0.90525105
Growth rate π 1i 0.030075284
(i) Mean Growth Trajectory
[표 7]의 고정효과 결과를 통해, 초기 평균 수학성적(B00)이 112.489538 점이며 각 개인의
수학성적은 시점이 1 씩 증가할수록(한 학기마다) 10.024796 만큼 증가함을 알 수 있다.
(ii) Individual Variation in Growth Trajectories
개인간 분산은 무선효과 결과를 통해 알 수 있다. 개인 성장 모수인 π 0i , π 1i 의 분산
추정치는 각각 1092.30226, 3.54503 이다. 3 장에서 제시되어 있듯이 개인들의 변화(성장)
모수의 변화가 없다는 것을 검증하기 위해 χ 2 검증을 한 결과, 절편인 r0i 는 1994.36828
(df= 161, p<.000)이다. 이는, 영가설을 기각하므로 각 개인은 초기 시점(Time 0 시점)에서
그들의 수학성적은 유의미하게 차이가 있음을 알 수 있다. 이와 반대로 개인의 변화(성장)률
영가설에 (i.e. H0: π 1i = 0) 대한 χ2 값은 170.85796 으로 영가설이 지지되어 개인의
변화(성장)률이 유의미한 차이가 없음을 보여주었다 (df=161, p<.282). 이는, 초기 수학
성적은 개인간 차이에 의해 더 설명될 수 있는 부분이 있는 반면, 변화 기울기는 시점에
의해 모두 설명이 되어졌다는 의미로 해석할 수 있다.
(iii) Reliability of Initial Status and Change
초기 수학성적과 개인 변화(성장)률에 대한 신뢰도는 식 6.7 을 통해
각각 .90525105 과 .030075284 로 나타났다 (표 7 참조). 이는 이 자료에서 초기
수학성적에서만 개인간 차이가 있음을 보여주고 있으므로 초기 수학성적(절편)은
23](https://image.slidesharecdn.com/hlmfinalprojectfinal-111117172352-phpapp01/85/HLM-final-project-23-320.jpg)
![개인수준의 변수에 의해 영향을 받은 것으로 해석할 수 있다.
(iv) Correlation of Change with Initial Status
선형 개인 변화(성장) 모형에서는 이들 변수들간 상관관계는 식 6.8 을 통해 구할 수 있다.
여기서는 실제 변화와 실제 초기 수학성적 상태간 상관관계 추정치는 .282 이다. 이는 초기
시점에 보다 높은 수학성적을 가진 개인이 보다 빠른 속도로 수학성적이 향상된다는 의미로
앞서 언급한 것과 같이 π 0i 는 시점 변수인 Timeti 에 영향을 받음을 다시 확인할 수 있다.
(4) An Intercepts- and Slopes-as-Outcomes Model
Level 1 모형은 unconditional model에서 설정한 식 그대로 유지하고 여기서는 ell-
english라는 level 2 수준의 변수 (더미변수로 0 = native, 1=non-native를 지칭)를 추가하였다.
이를 바탕으로 다음과 같이 모형을 설정하였다. 이 때, ELL-ENGLISH에서 0 은 non-
native임을 나타내므로 x 절편이 0 일 때의 값이 non-native인 사람들의 수학성적을
나타내므로 centering을 하지 않아도 되므로 uncentered하여 모형에 추가하였다. 반면,
π 1i 에는 앞서 Time에 의해 모두 설명되었으므로 여기서는 slope에는 개인수준 변수인 ELL-
ENGLISH를 포함하지 않았다.
Level 1
MATHACH ti = π 0i + π 1i (TIMEti ) + eti
Level 2
π 0i = β 00 + β 01 ( ELL _ ENG ) i + r0i
π 1i = β10 + r1i
[표 13] 수학성적의 선형 성장 모형 – ELL-ENGLISH 효과
Fixed Effect Coefficient Standard Error T-ratio Approx. d.f. P-value
Model for initial status, π 0i
INTRCPT2, β 00 133.927113 5.344405 25.059 160 0.000
ELL_ENG, β 01 -31.025648 5.920476 -5.24 160 0.000
Model for growth rate, π 1i
INTRCPT2, β10 10.032149 0.613825 16.344 161 0.000
[표 8]은 고정효과 추정치를 나타내고 있다. 여기서 ELL-ENGLISH의 t값은 -.5.24 로 초기
수학성적과 비교적 높은 상관관계를 보이고 있다. 평균적으로 영어가 모국어인 사람들보다
영어가 모국어가 아닌 사람들의 초기 수학성적이 31.03 정도 낮은 것으로 나타났다.
24](https://image.slidesharecdn.com/hlmfinalprojectfinal-111117172352-phpapp01/85/HLM-final-project-24-320.jpg)
![[표 14] ELL_ENGLISH 결과의 초기 수학성적과 성장(변화)률의 설명 변량
Model Initial Status Var. Growth Rate Var.
Unconditional 1092.30226 3.54503
Conditional on Ell-English 892.98716 3.69333
Propotions of variance explained 18.25% -4.18%
[표 9]는 이 모형의 무선호과의 분산 추정치를 제시하고 있으며 이를 기초모형(unconditional
model)에서 나타난 분산 추정치와 비교한 결과를 제시해주고 있다. 식 4.24 에 의하여
설명된 분산 비율 (the proportion of variance explained)를 구하면 ELL-ENGLISH가 초기
수학성적의 분산 모수치의 18.25%를 설명해주고 있다.
[표 8]과 [표 9]를 종합해볼 때, ELL-ENGLISH 변수가 개인들의 초기 수학성적에 영향을
미치는 것을 알 수 있다. 즉, ELL-ENGLISH 변인을 투입하는 것이 보다 효과적이었다.
25](https://image.slidesharecdn.com/hlmfinalprojectfinal-111117172352-phpapp01/85/HLM-final-project-25-320.jpg)
![[오픈콘텐츠랩/ 열정대학] 드림커넥션학과 전공프로젝트 '과미팅'](https://cdn.slidesharecdn.com/ss_thumbnails/random-141113012649-conversion-gate02-thumbnail.jpg?width=640&height=640&fit=bounds)

![[오픈컨텐츠랩/BMF 프렌즈] 리더십 스터디 모임 후기](https://cdn.slidesharecdn.com/ss_thumbnails/bmfcontents23-150327071958-conversion-gate01-thumbnail.jpg?width=640&height=640&fit=bounds)
![[오픈컨텐츠랩] 사회적 경제의 이해_boc](https://cdn.slidesharecdn.com/ss_thumbnails/random-150410044650-conversion-gate01-thumbnail.jpg?width=640&height=640&fit=bounds)


![[오픈컨텐츠랩] 기업소개팅 JOB다 (시지온)](https://cdn.slidesharecdn.com/ss_thumbnails/job-150227195623-conversion-gate02-thumbnail.jpg?width=640&height=640&fit=bounds)
![[오픈콘텐츠랩] 소프트웨어 코딩 교육(엔트리프로그램)_휴먼인러브](https://cdn.slidesharecdn.com/ss_thumbnails/150214-2-150302043217-conversion-gate02-thumbnail.jpg?width=640&height=640&fit=bounds)
![[모임]8월23일 인간본질학회(경제,사회복지)](https://cdn.slidesharecdn.com/ss_thumbnails/823-150901090933-lva1-app6891-thumbnail.jpg?width=640&height=640&fit=bounds)


![[오픈컨텐츠랩] BMF 리더십 스터디 모임 후기](https://cdn.slidesharecdn.com/ss_thumbnails/bmfcontents23-150330034402-conversion-gate01-thumbnail.jpg?width=640&height=640&fit=bounds)
![[오픈컨텐츠랩] 마음피스니스_ 대추씨](https://cdn.slidesharecdn.com/ss_thumbnails/random-150605070707-lva1-app6891-thumbnail.jpg?width=640&height=640&fit=bounds)


![[오픈컨텐츠랩] 캘리그라피를 통한 유머티콘 만들기 (퍼니버섯)](https://cdn.slidesharecdn.com/ss_thumbnails/02-150227200550-conversion-gate01-thumbnail.jpg?width=640&height=640&fit=bounds)
![[오픈콘텐츠랩 / 꿈꾸는프리젠테이션] 청중을 사로잡는 프리젠테이션](https://cdn.slidesharecdn.com/ss_thumbnails/random-141120012243-conversion-gate01-thumbnail.jpg?width=640&height=640&fit=bounds)
![[Ppt강의] 기초자료조사](https://cdn.slidesharecdn.com/ss_thumbnails/ppt-160310080332-thumbnail.jpg?width=640&height=640&fit=bounds)

![[오픈컨텐츠랩] '한복여행가 권미루와 함께하는 한복여행 세미나' 강의 자료](https://cdn.slidesharecdn.com/ss_thumbnails/0207-150210025615-conversion-gate01-thumbnail.jpg?width=640&height=640&fit=bounds)
![[오픈컨텐츠랩] 에너지 국제개발협력 비즈니스 과정 (아이브릿지)](https://cdn.slidesharecdn.com/ss_thumbnails/random-150306202440-conversion-gate01-thumbnail.jpg?width=640&height=640&fit=bounds)

