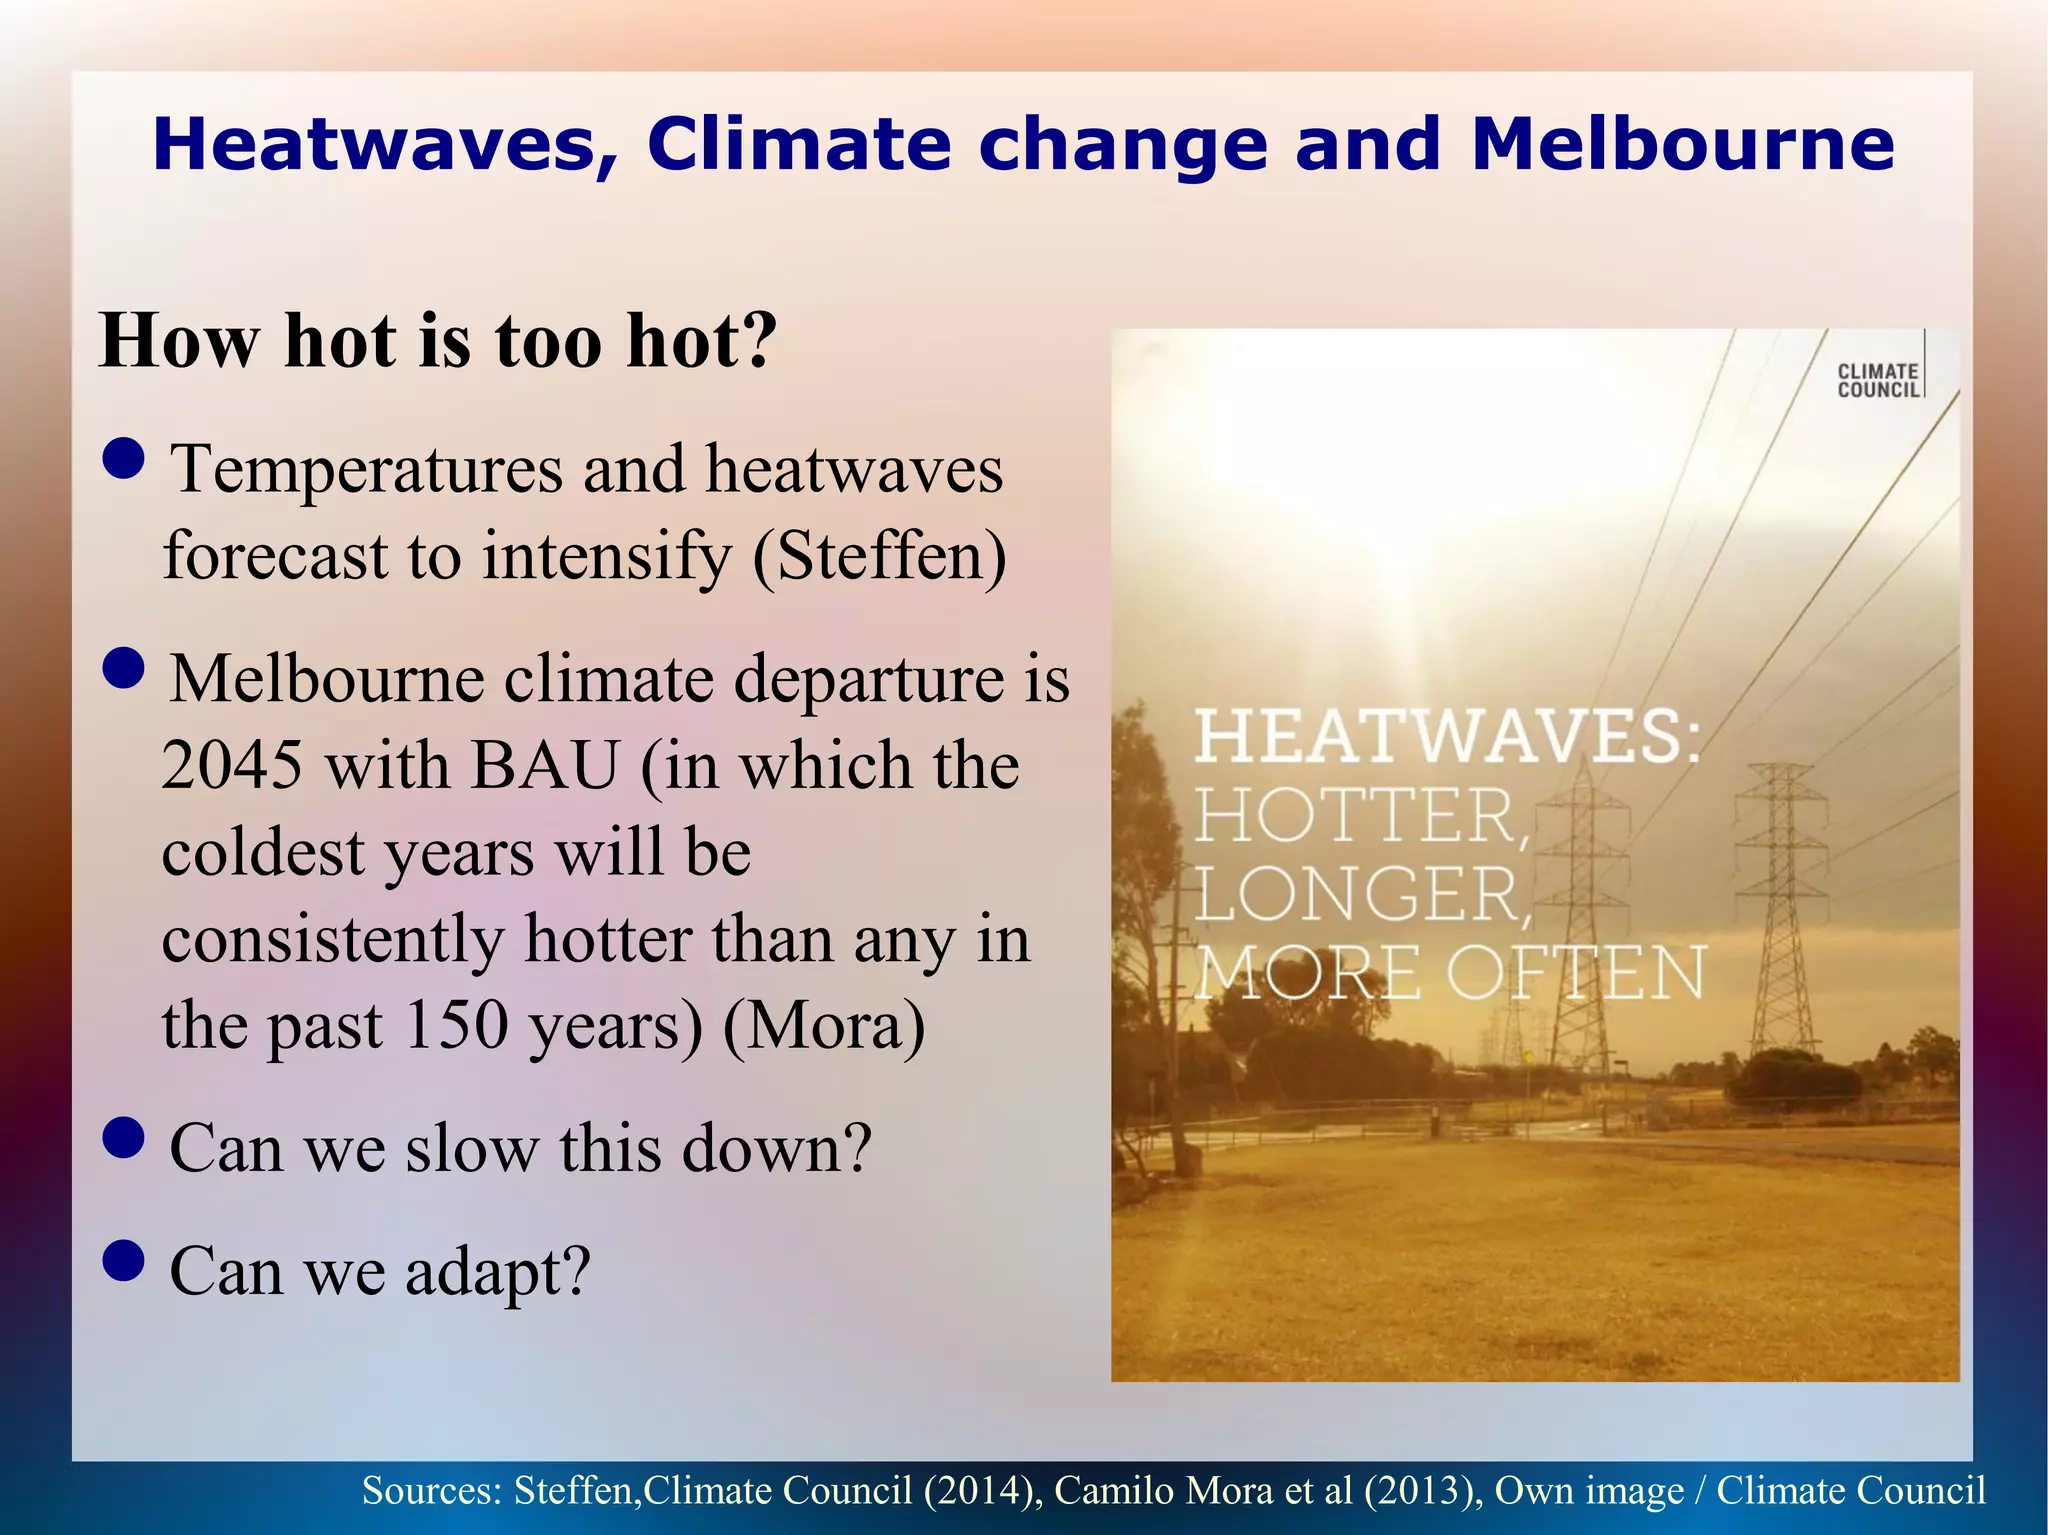
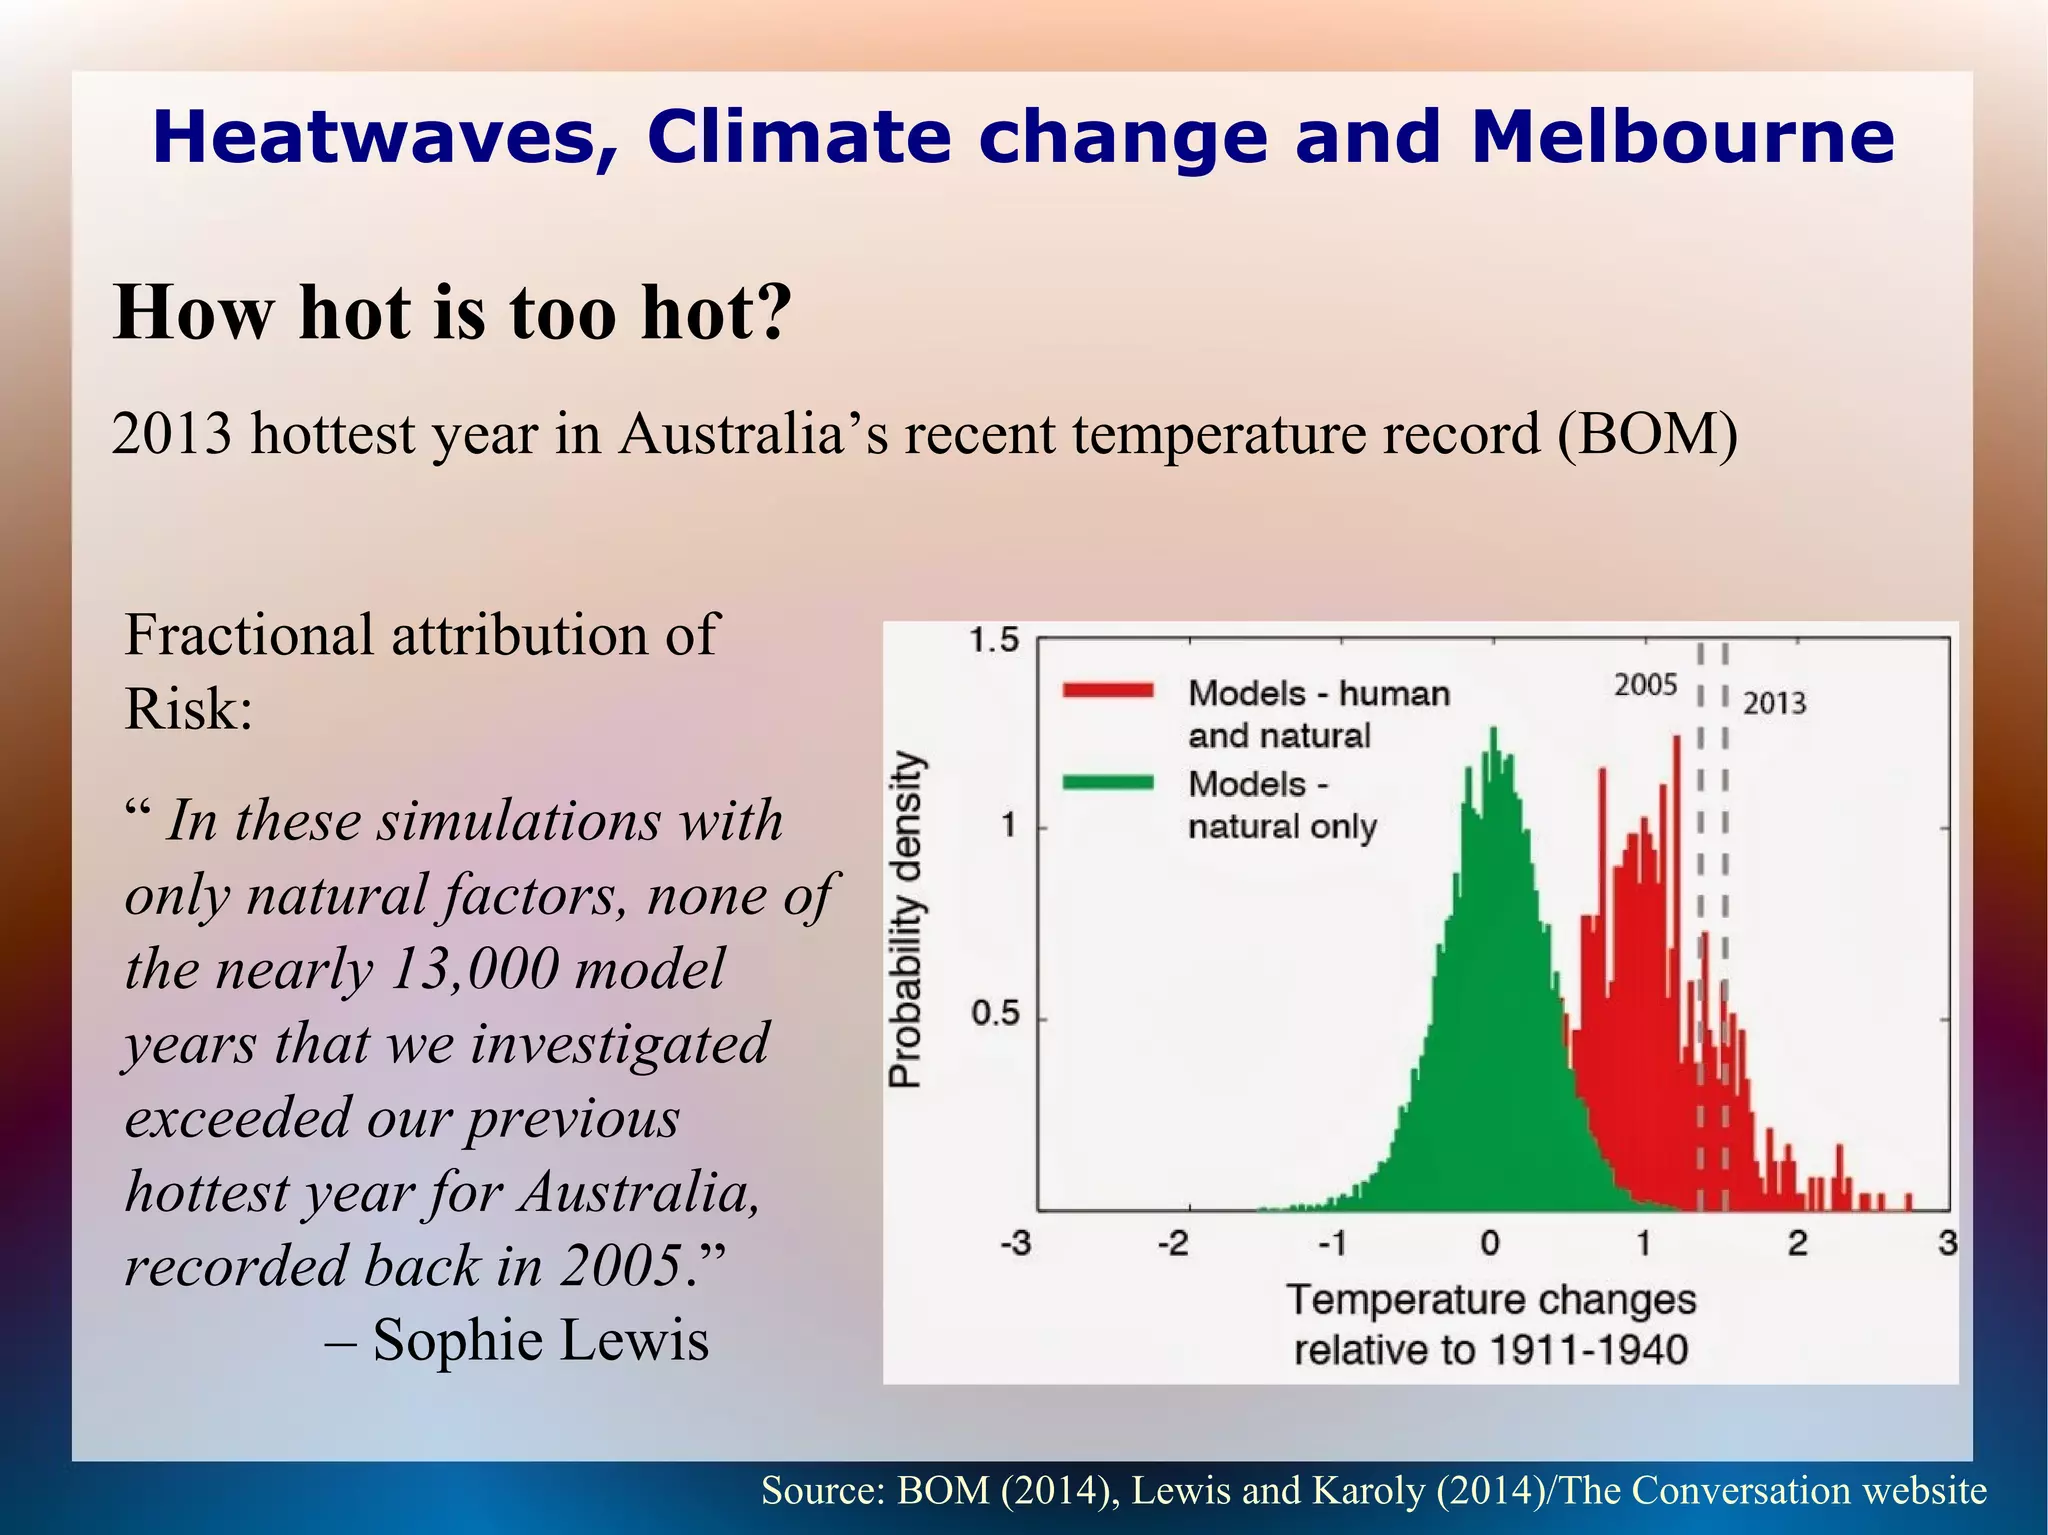
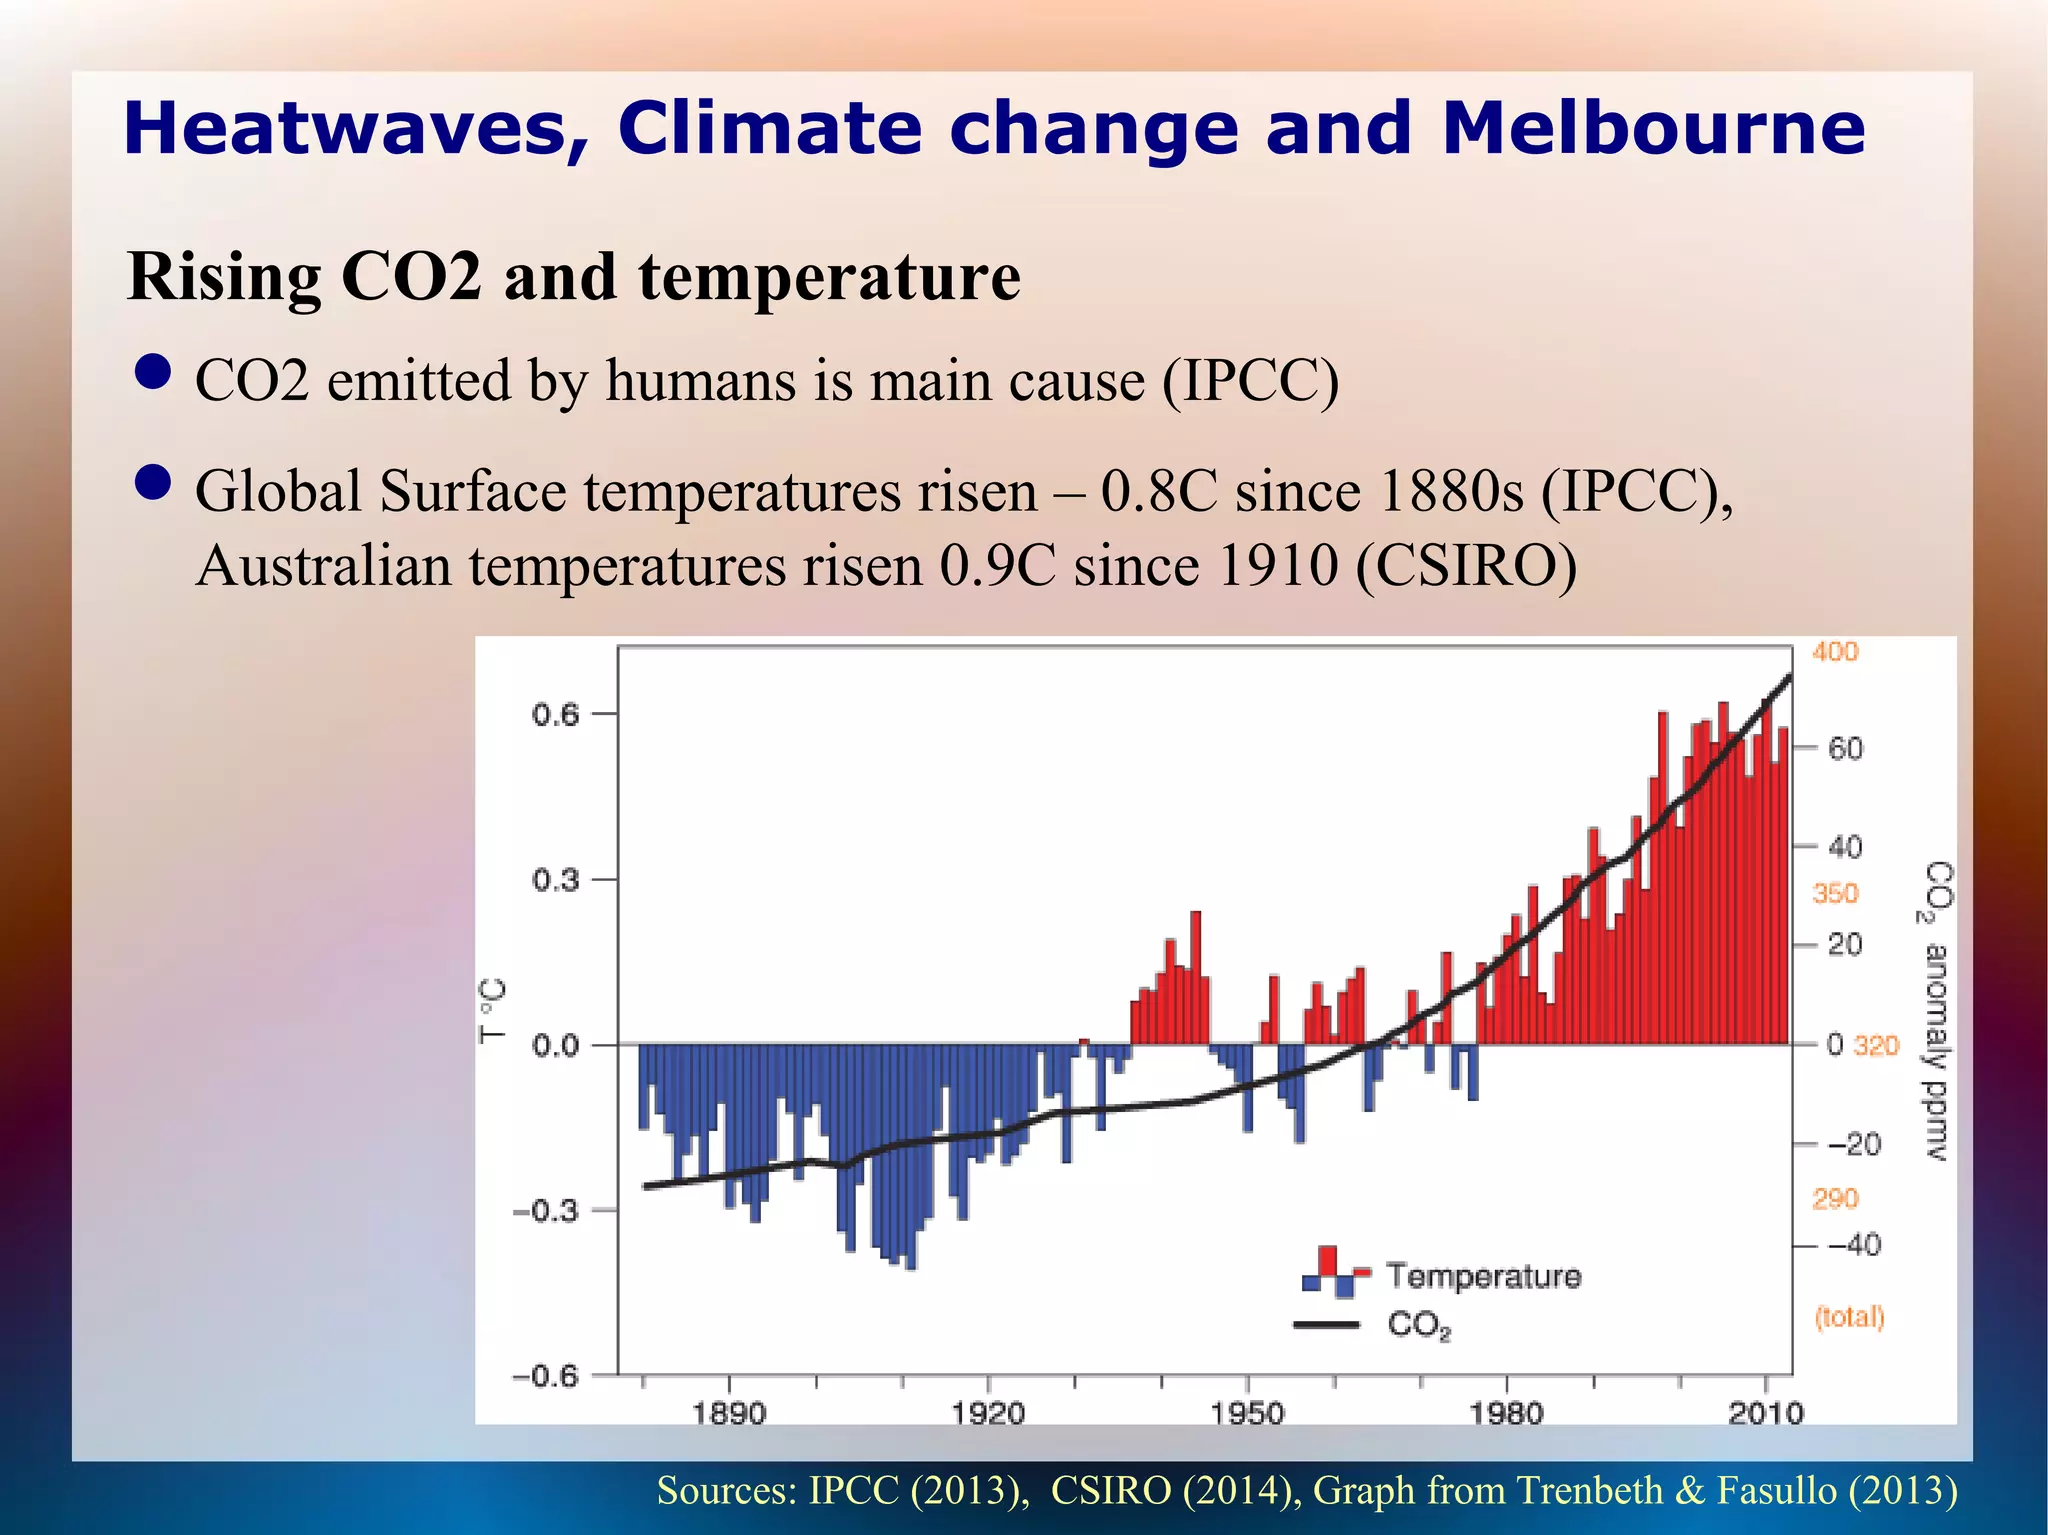
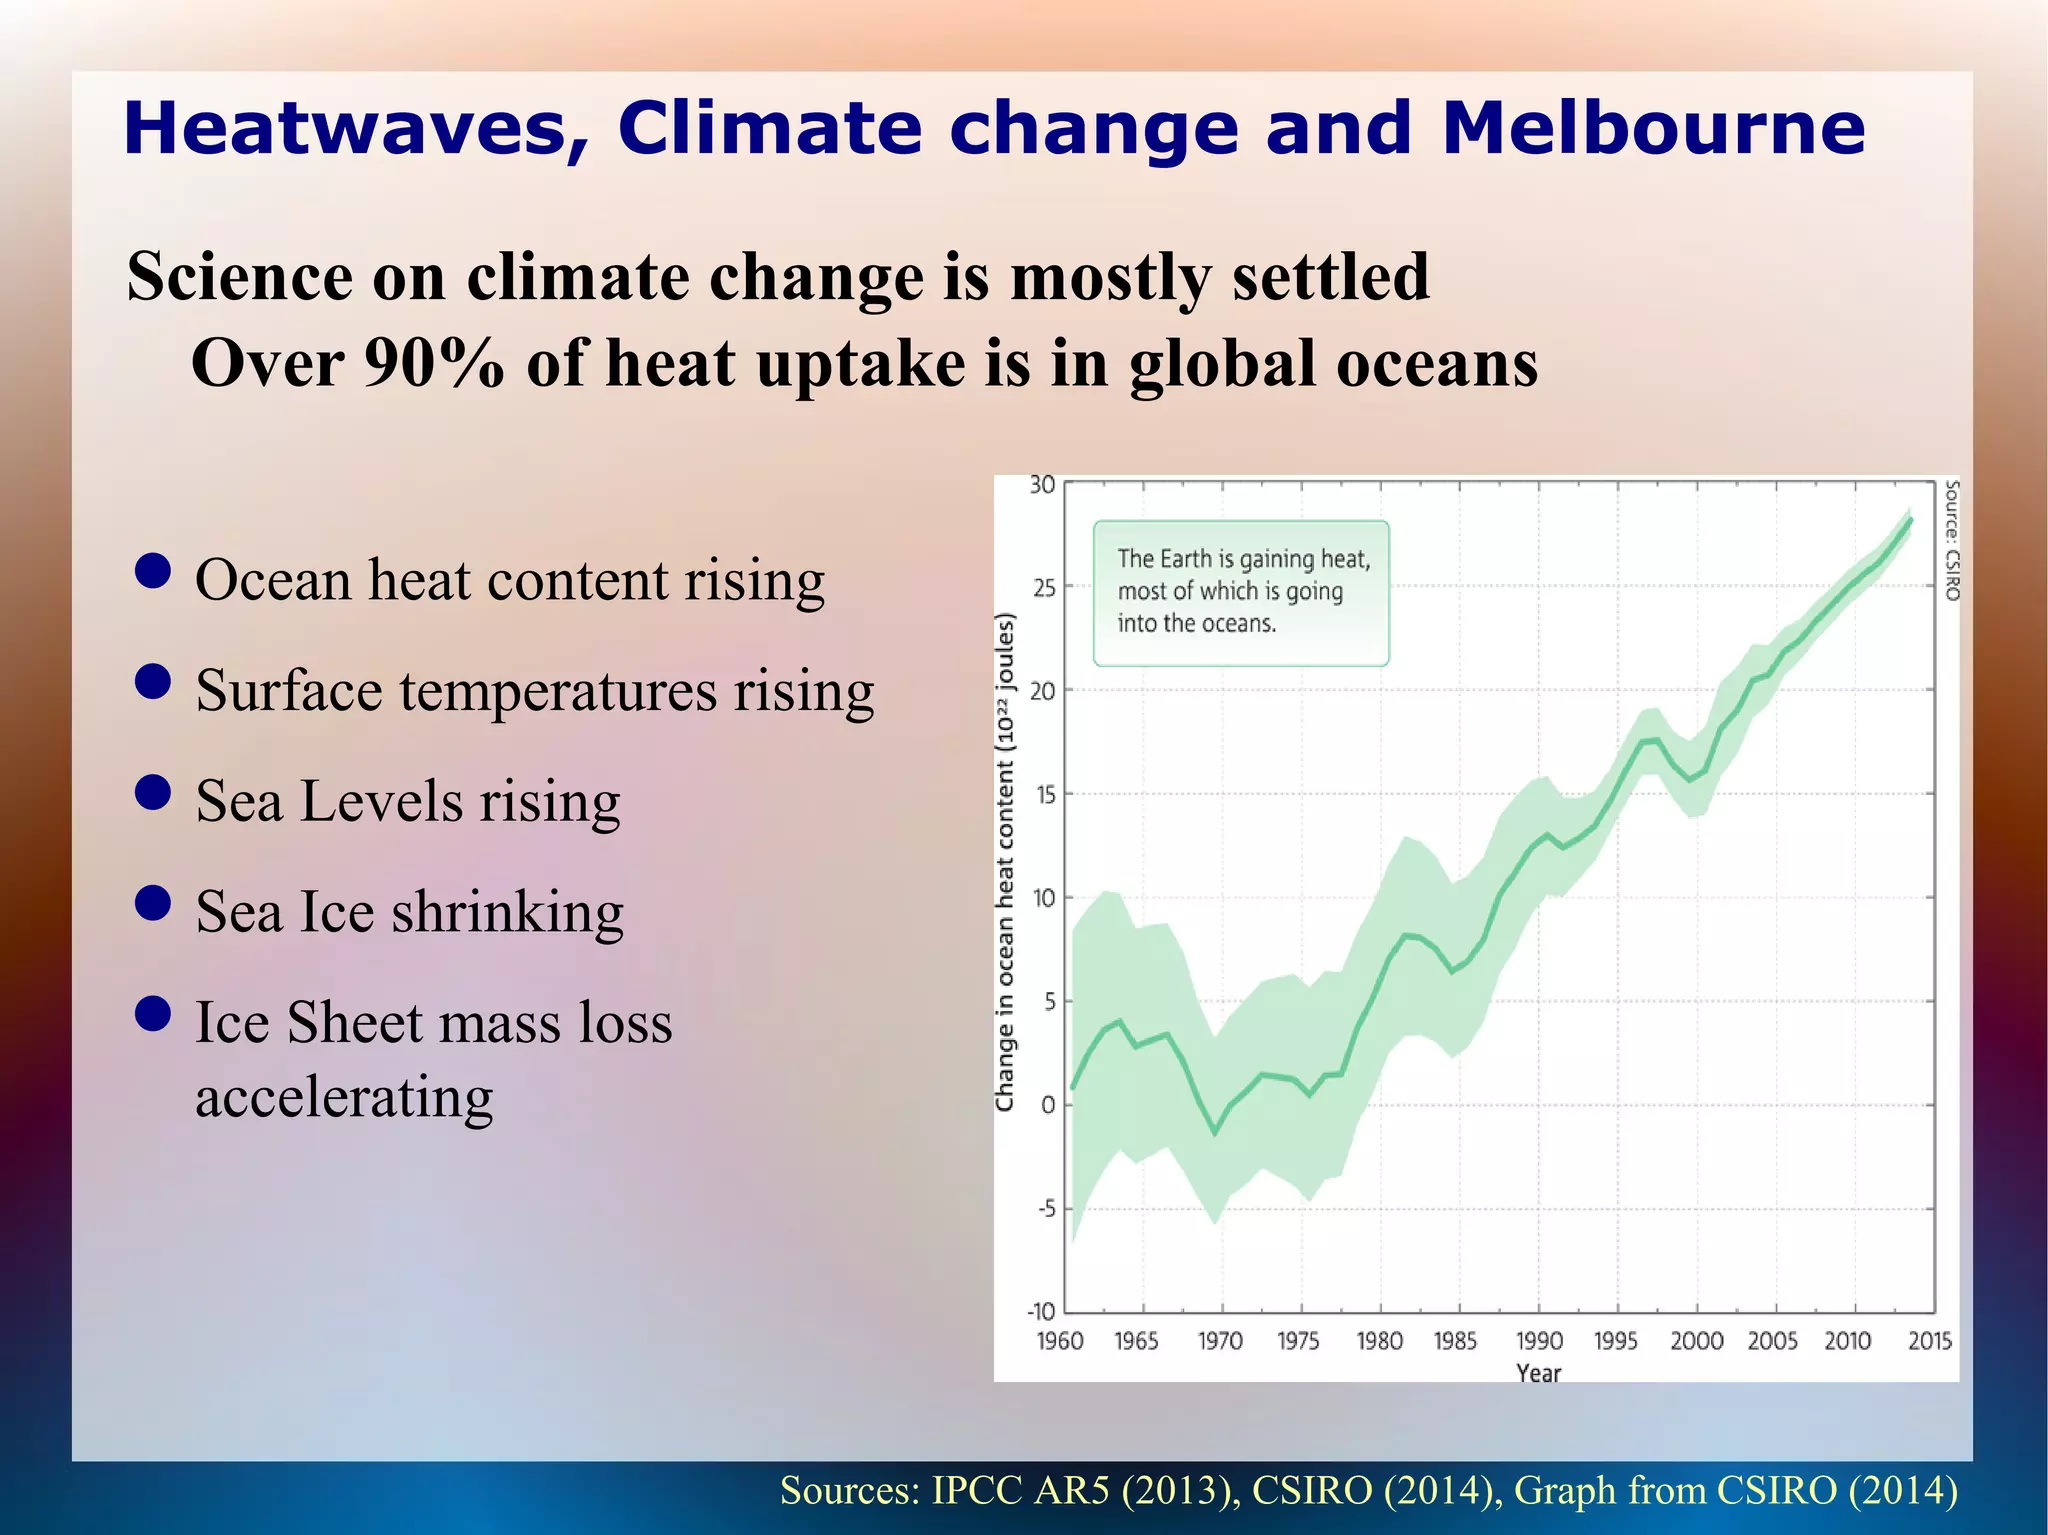
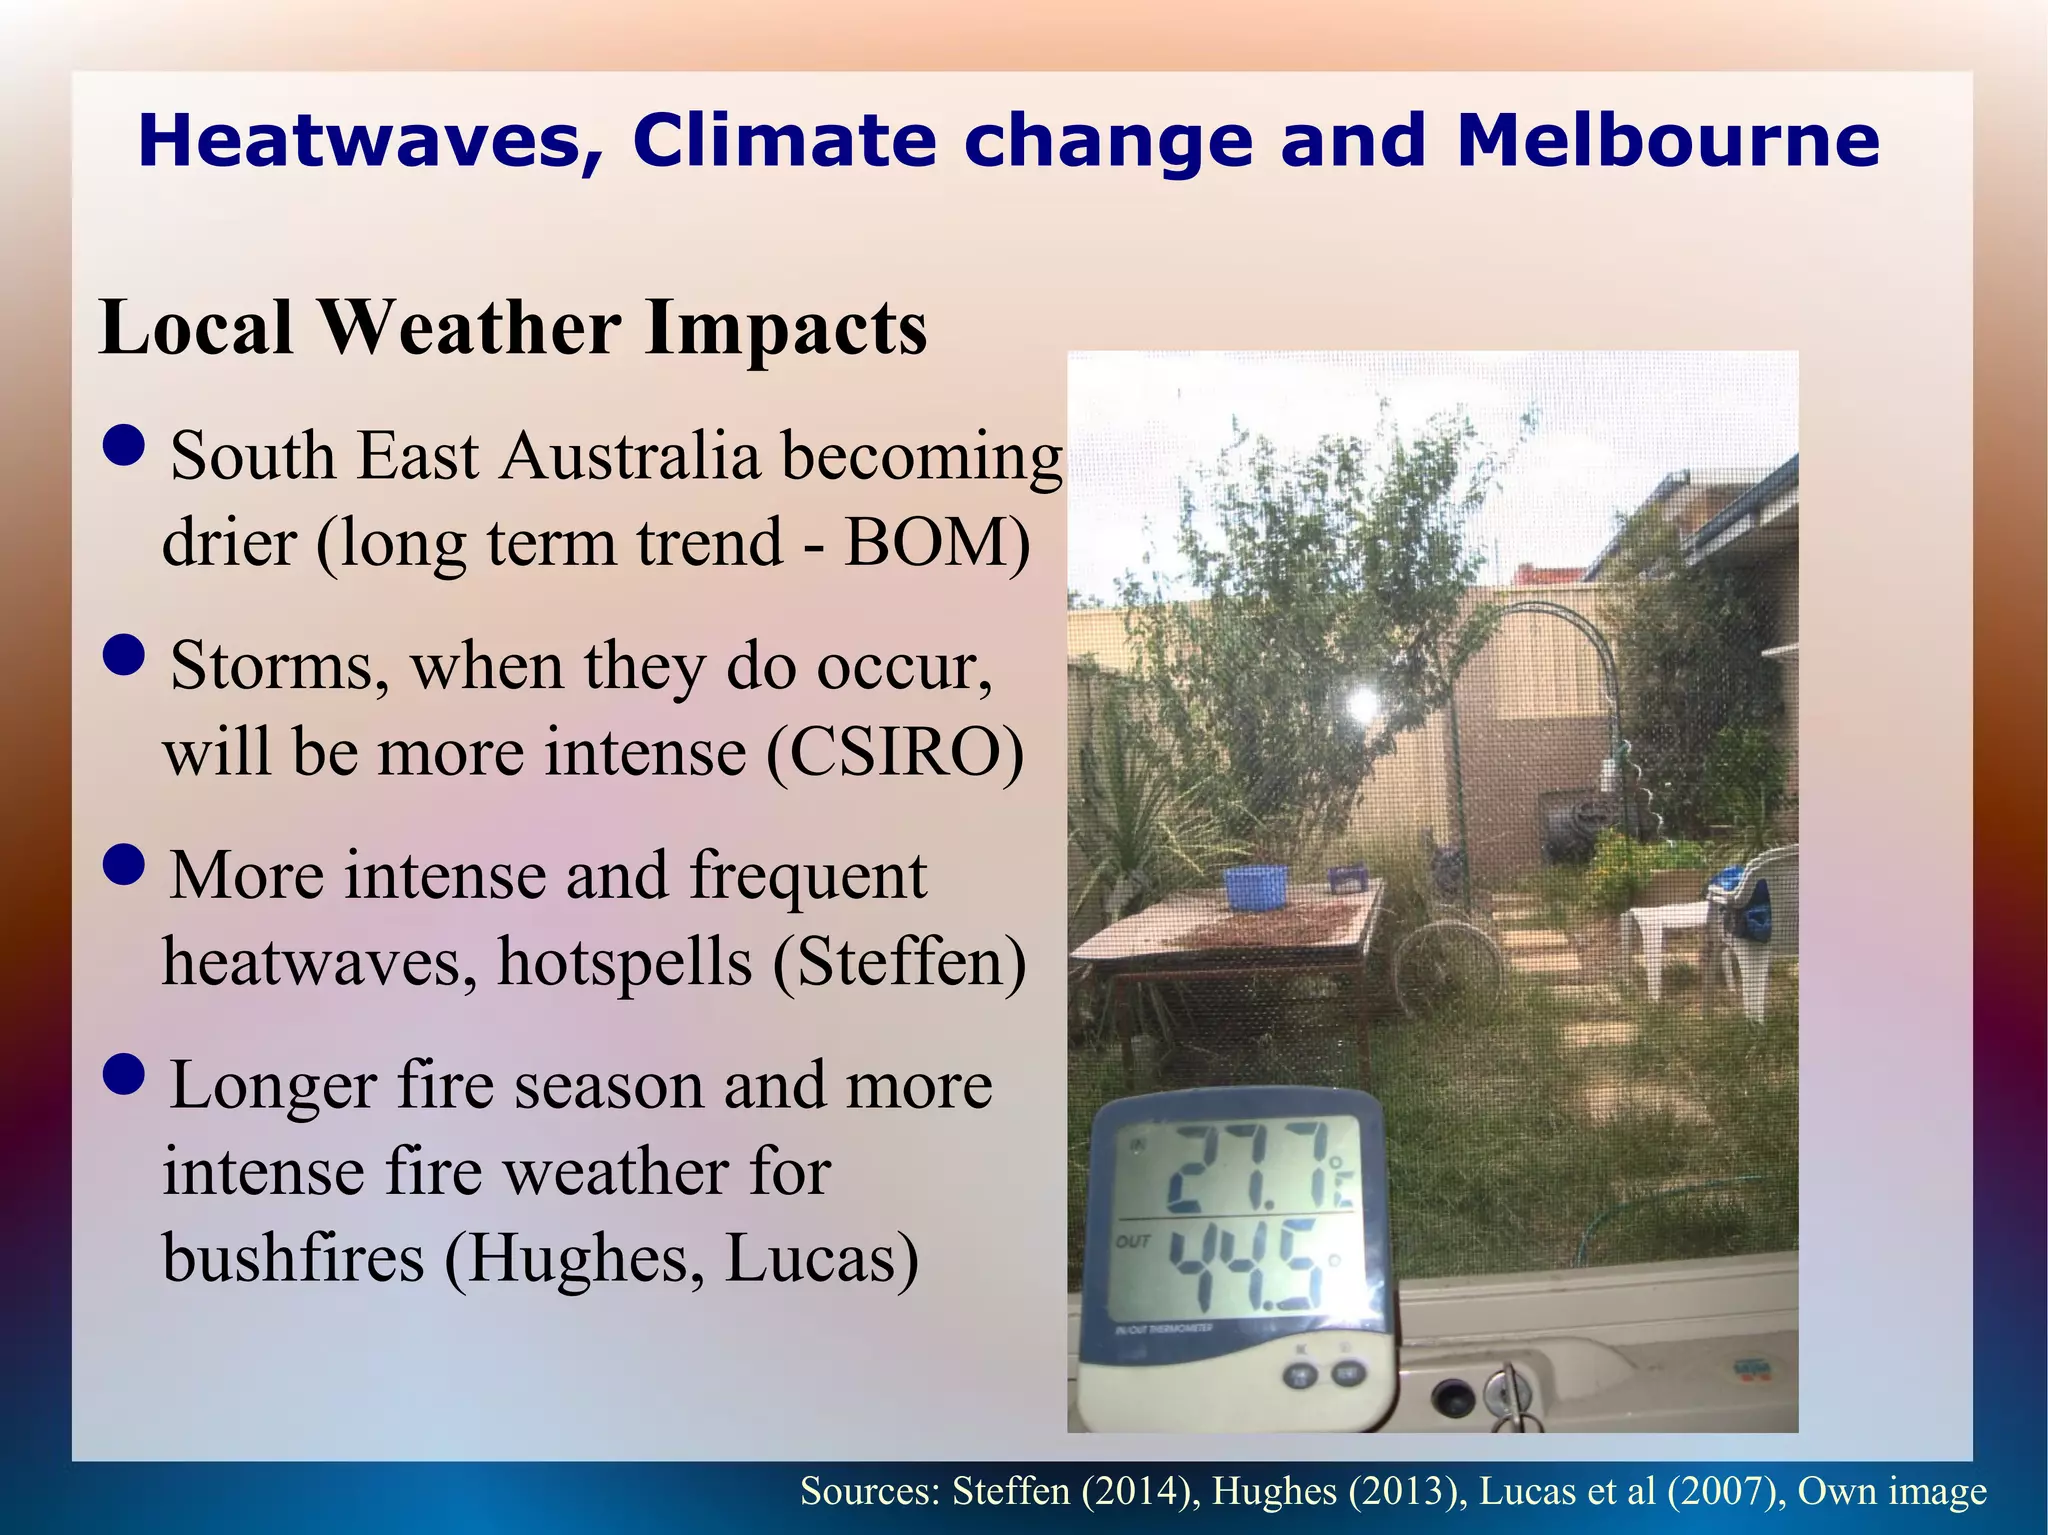
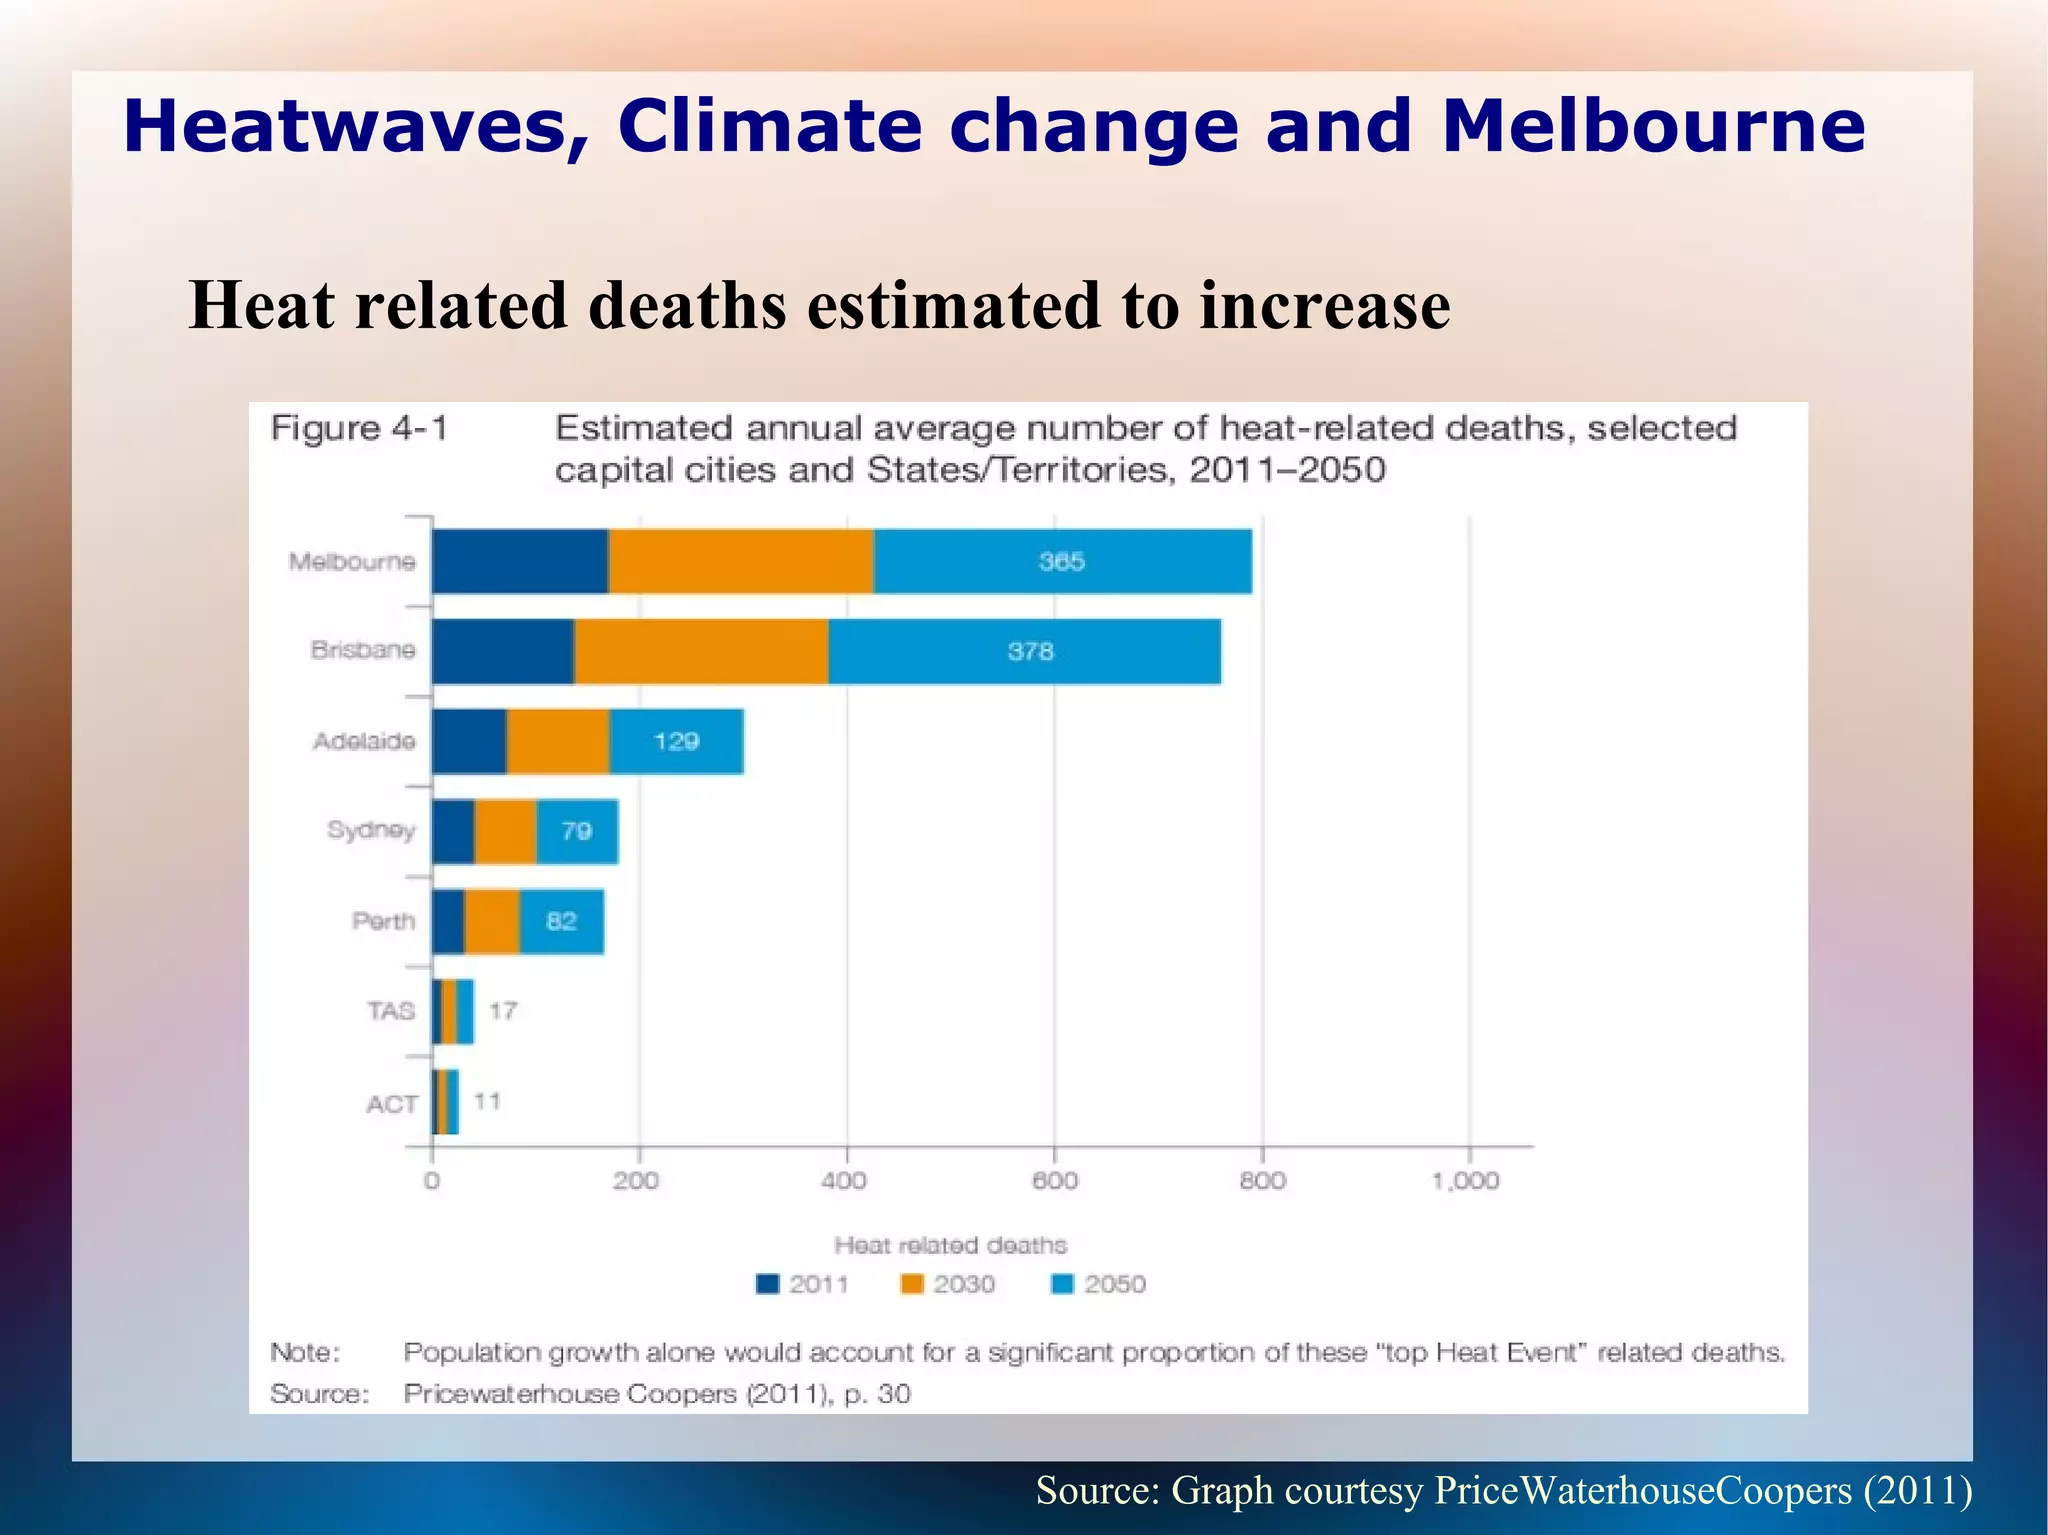
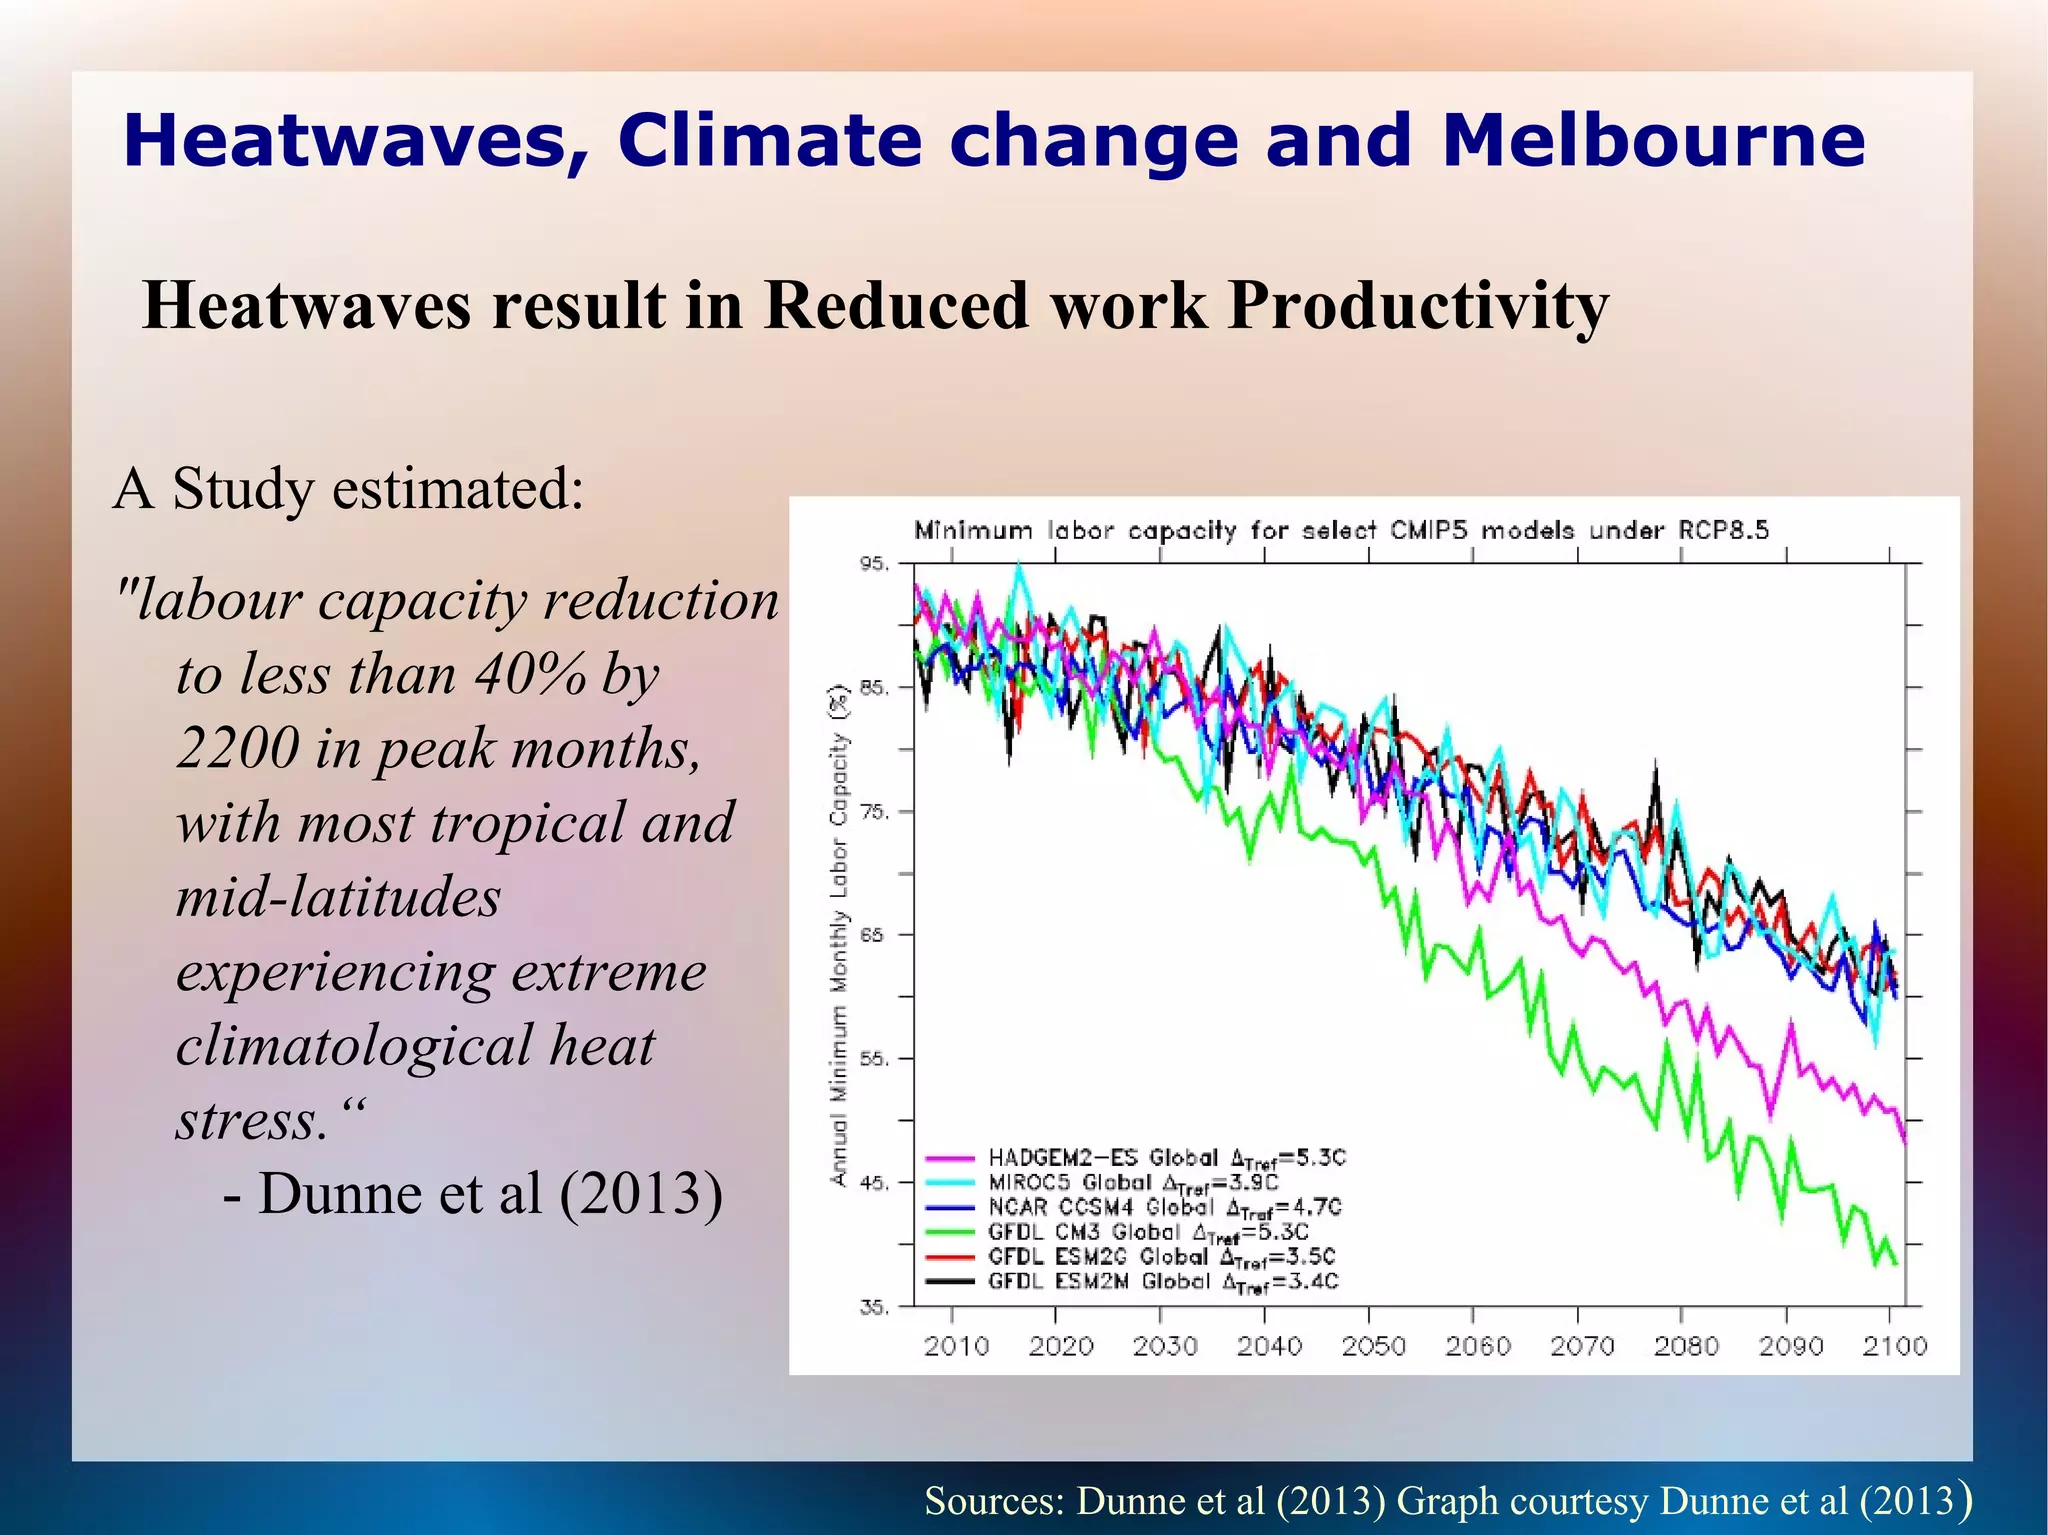
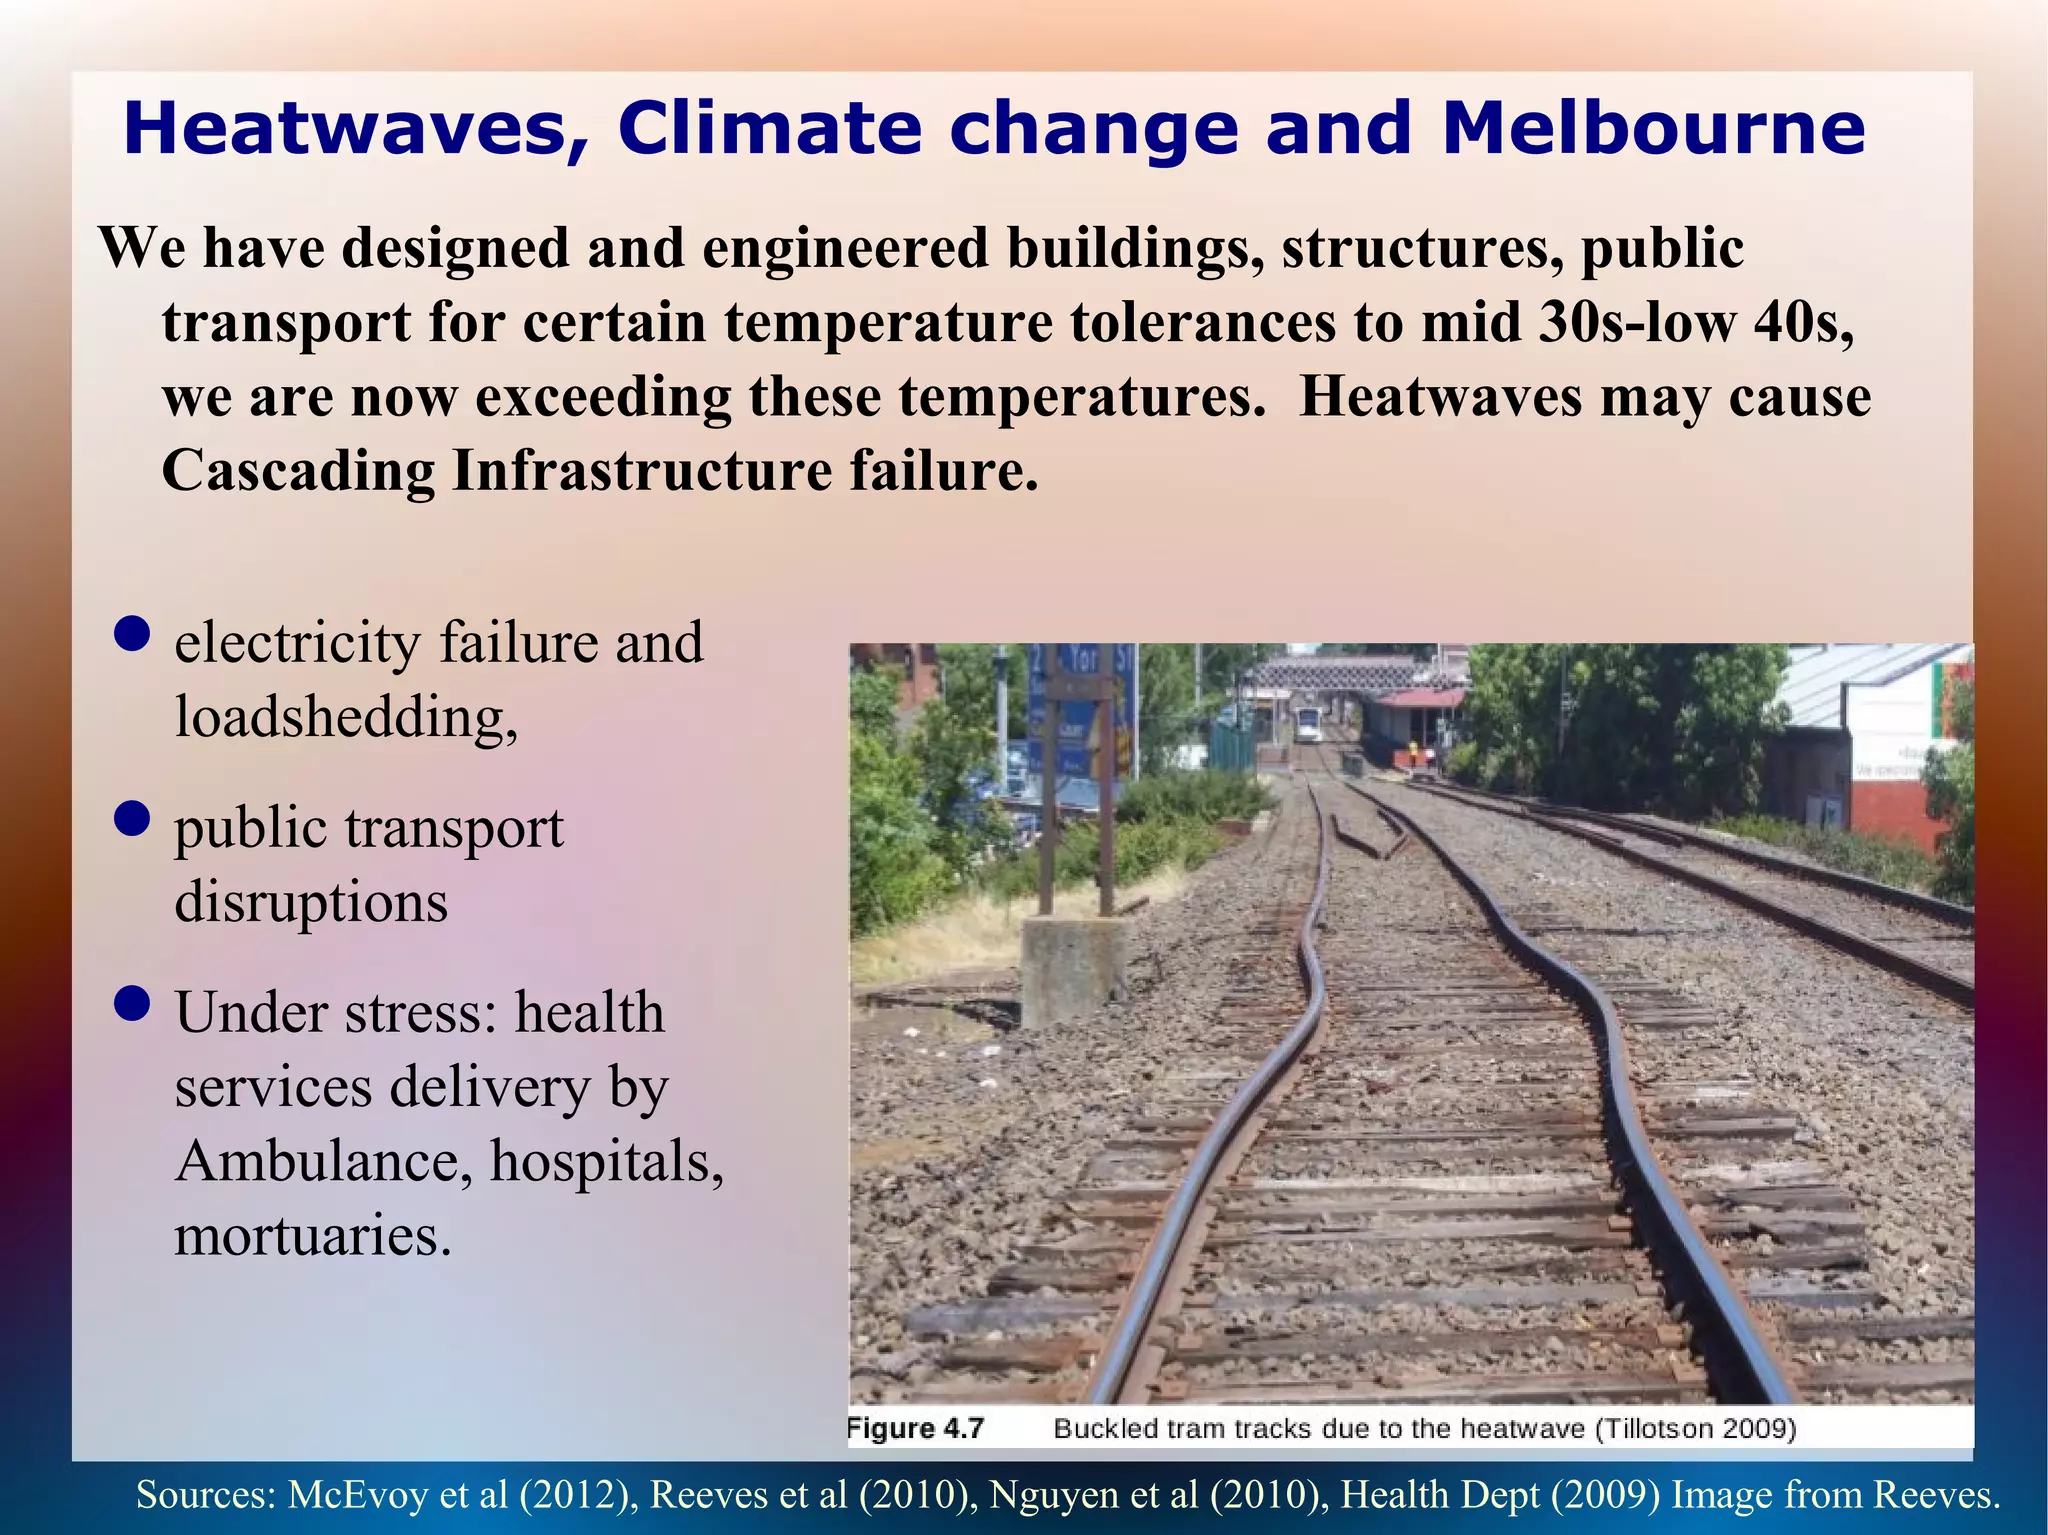
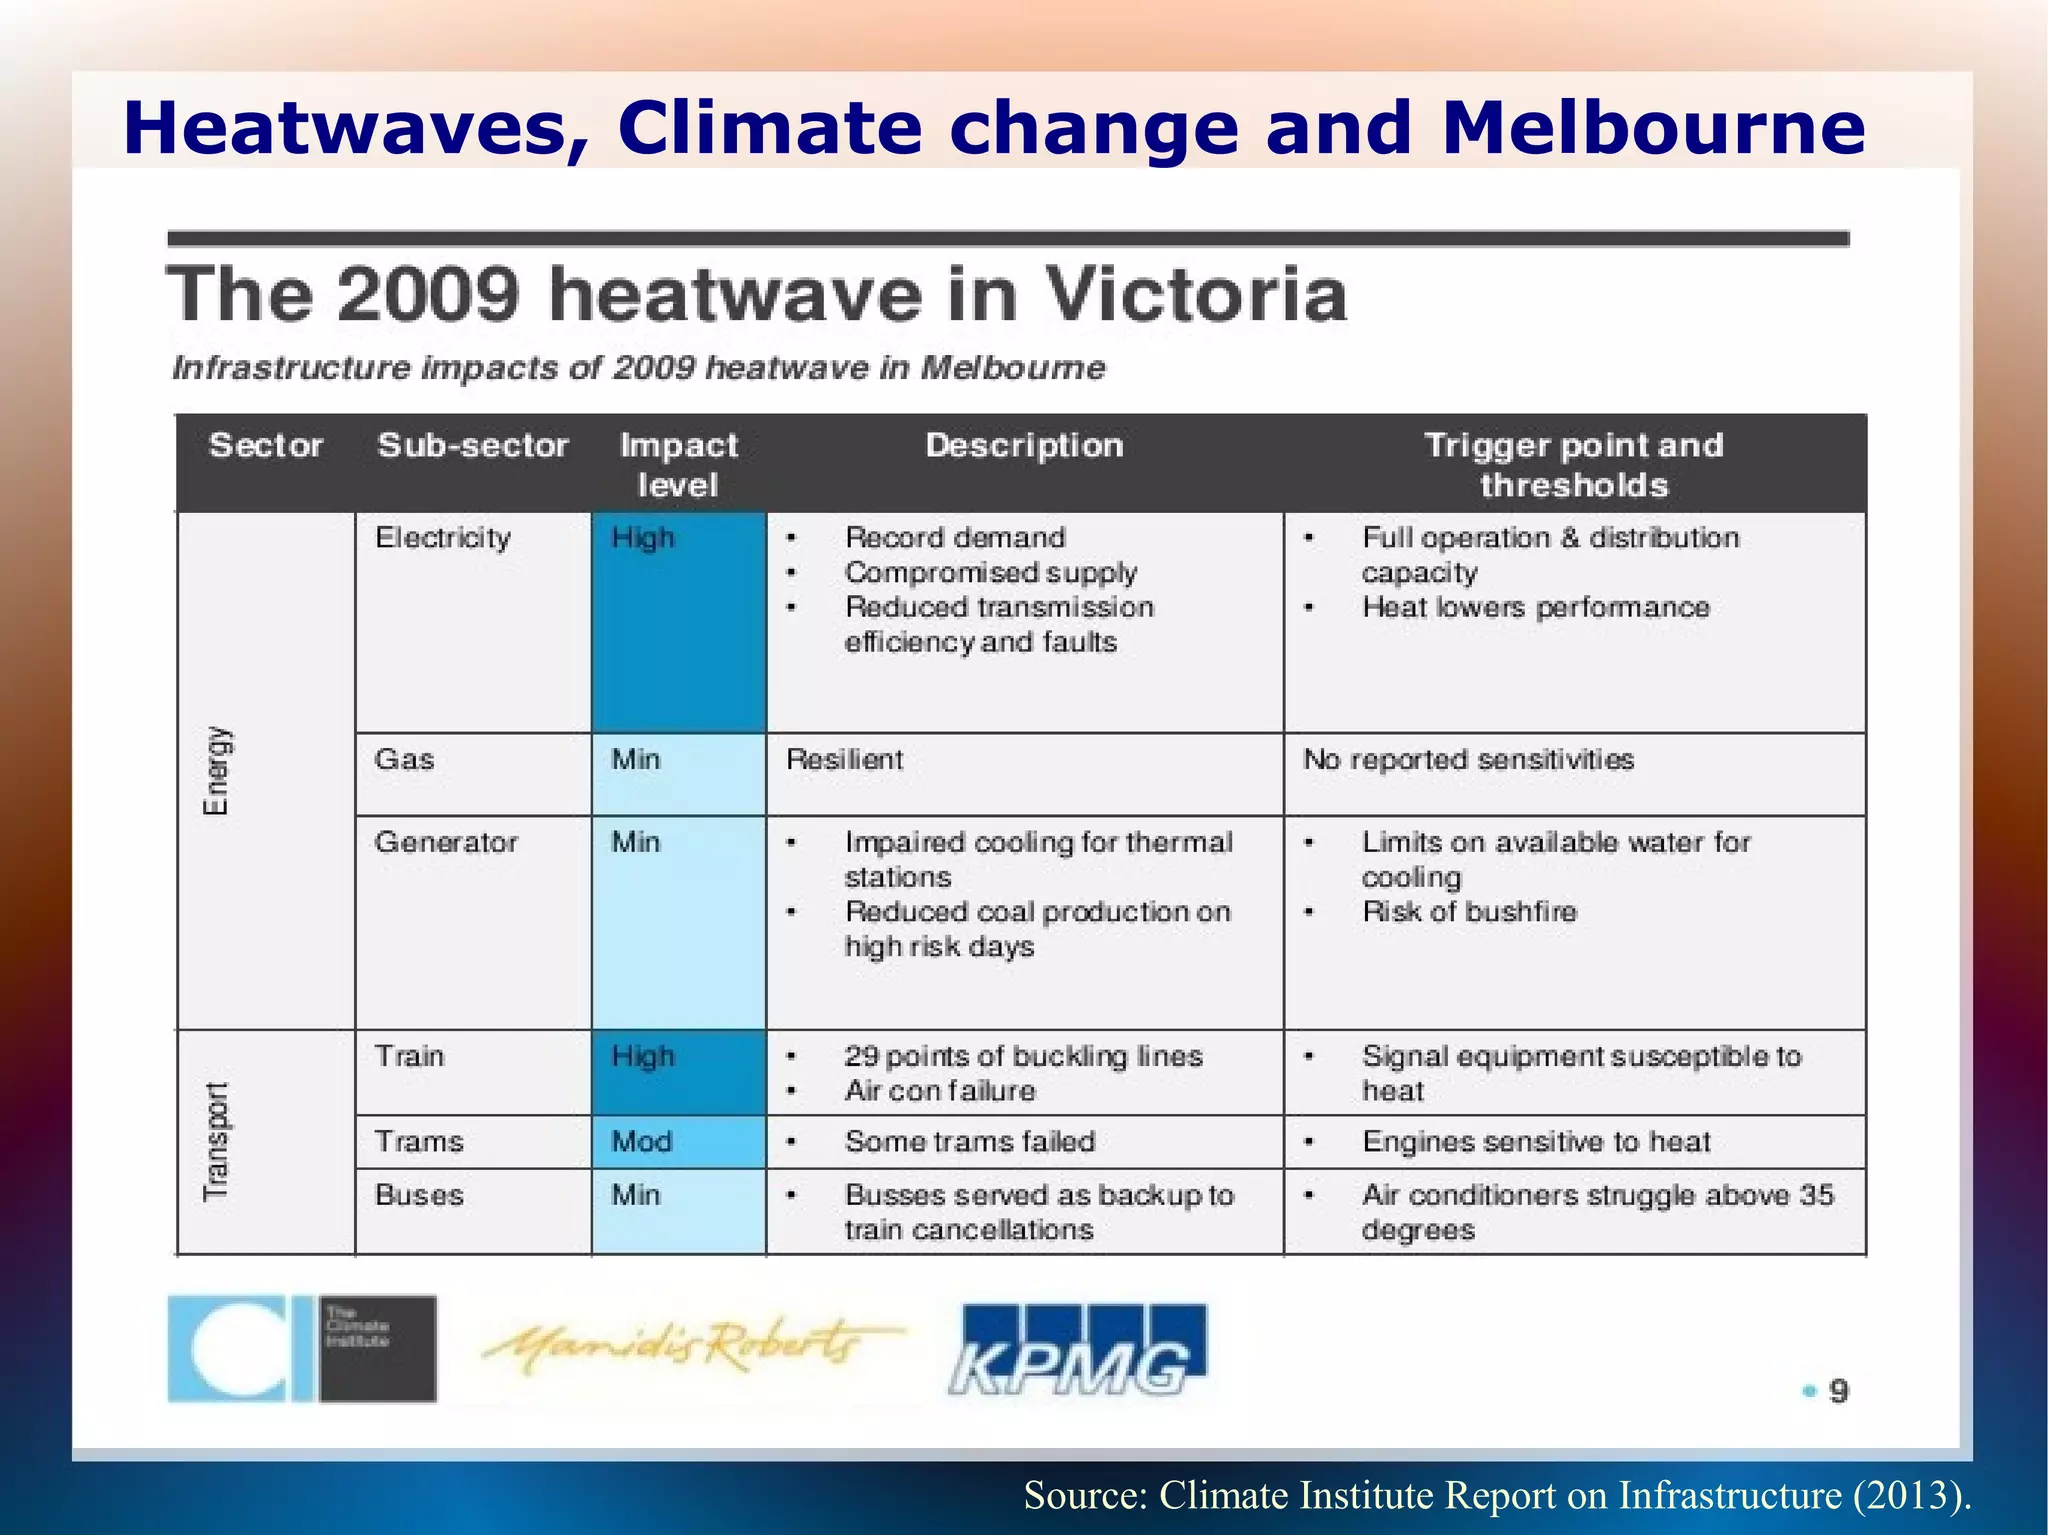
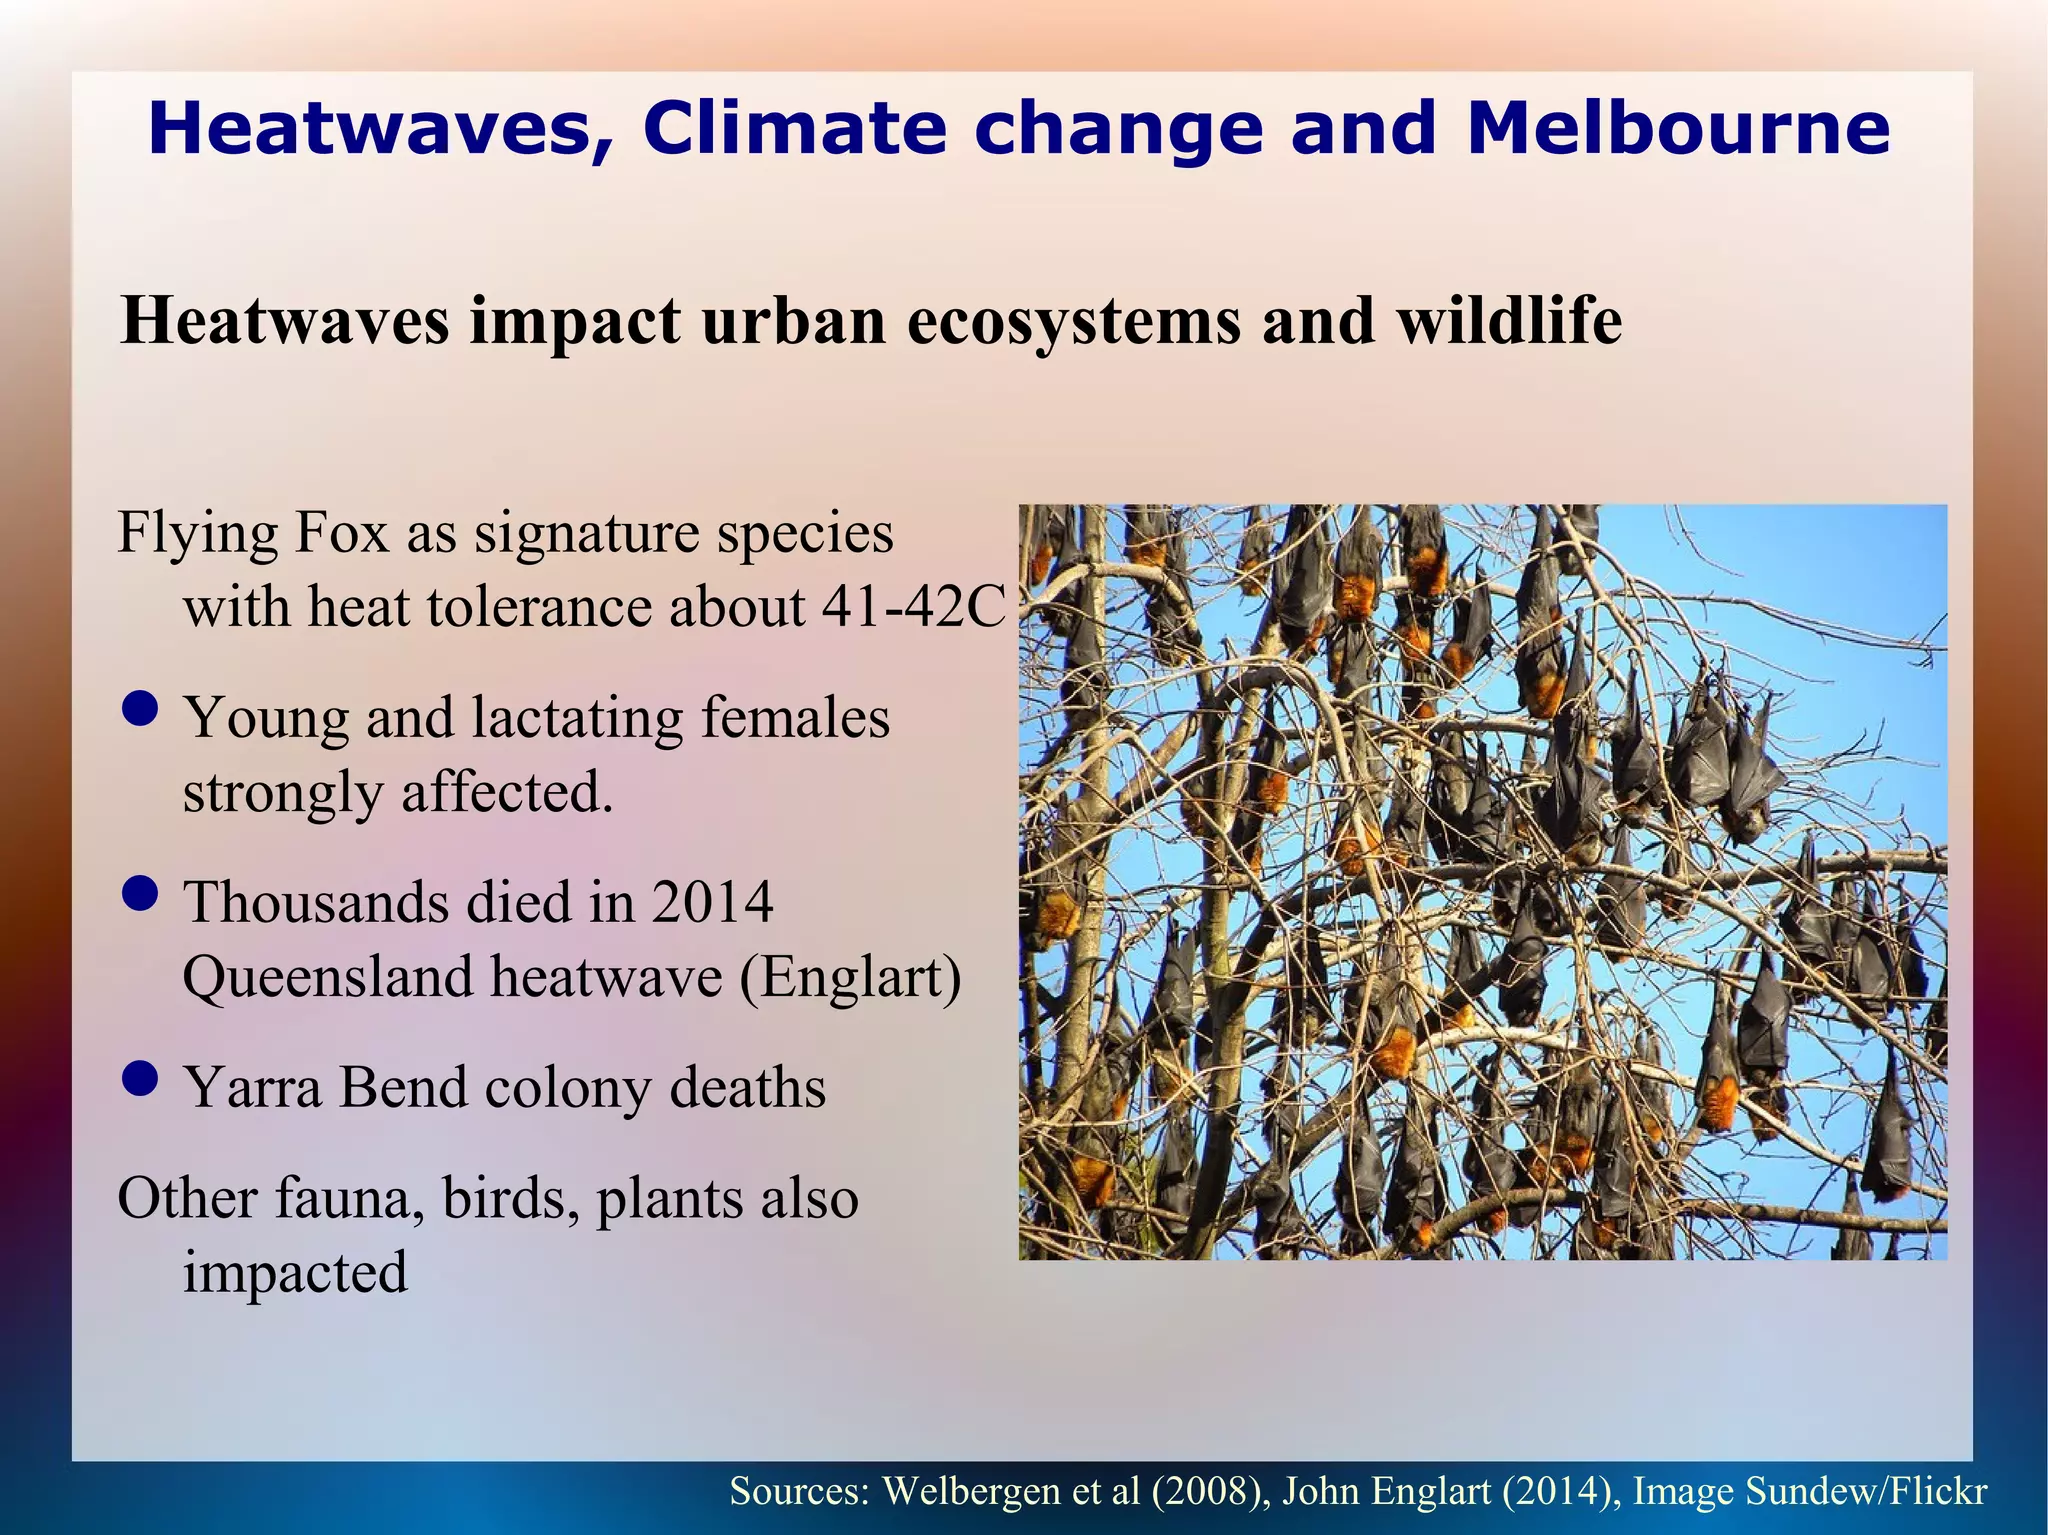
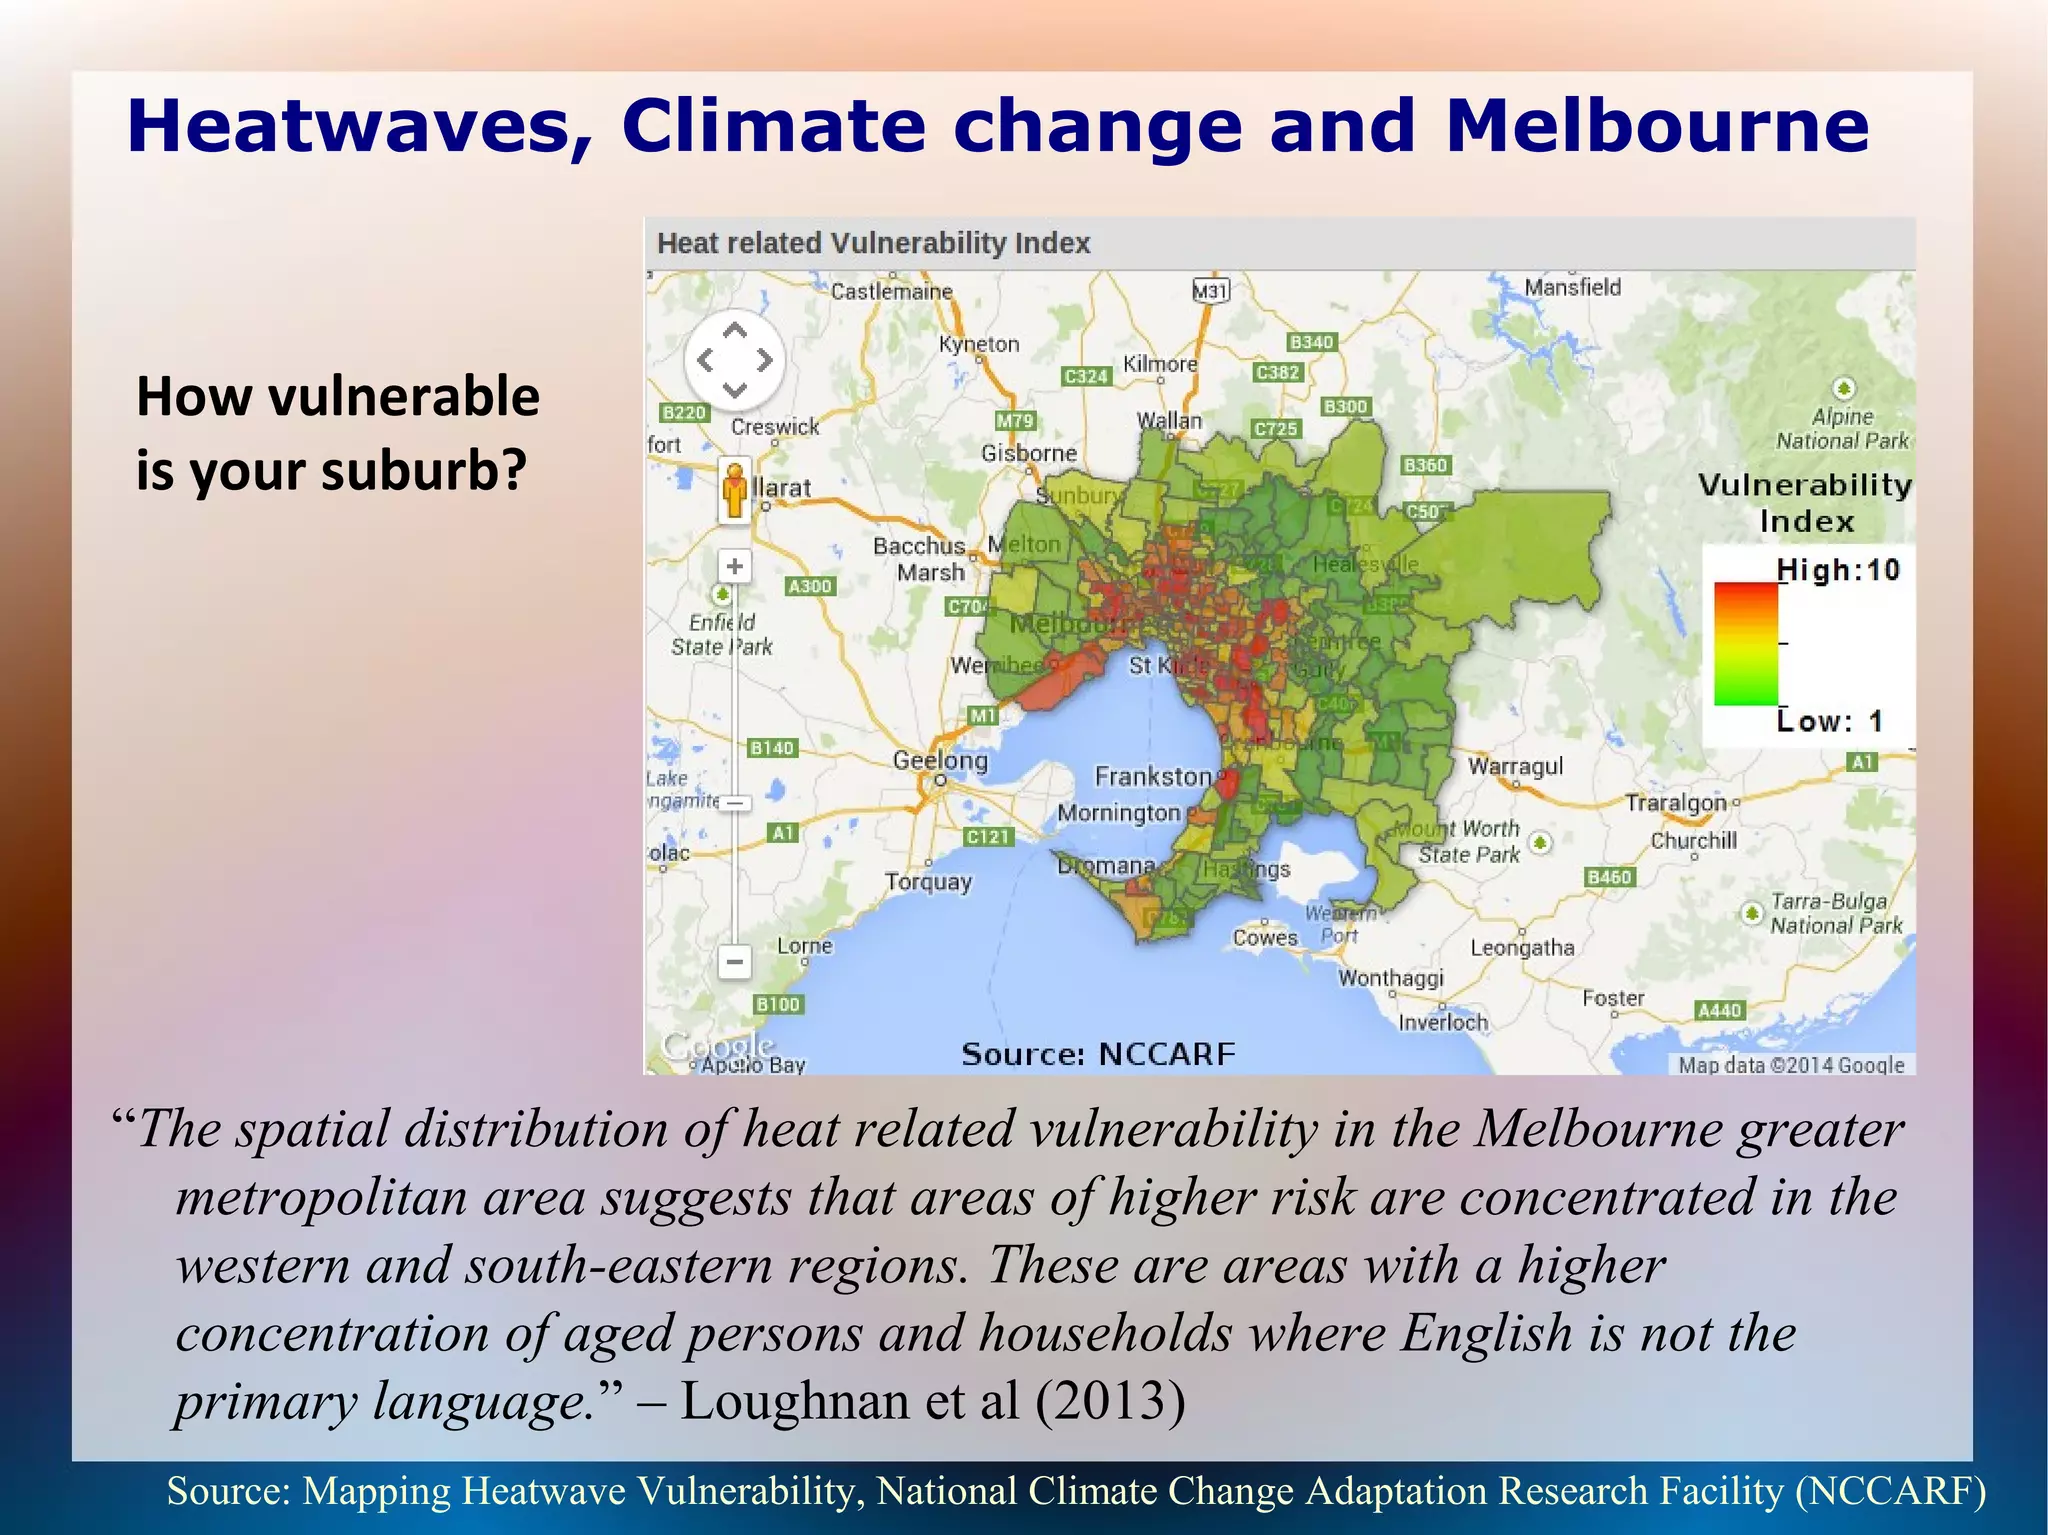
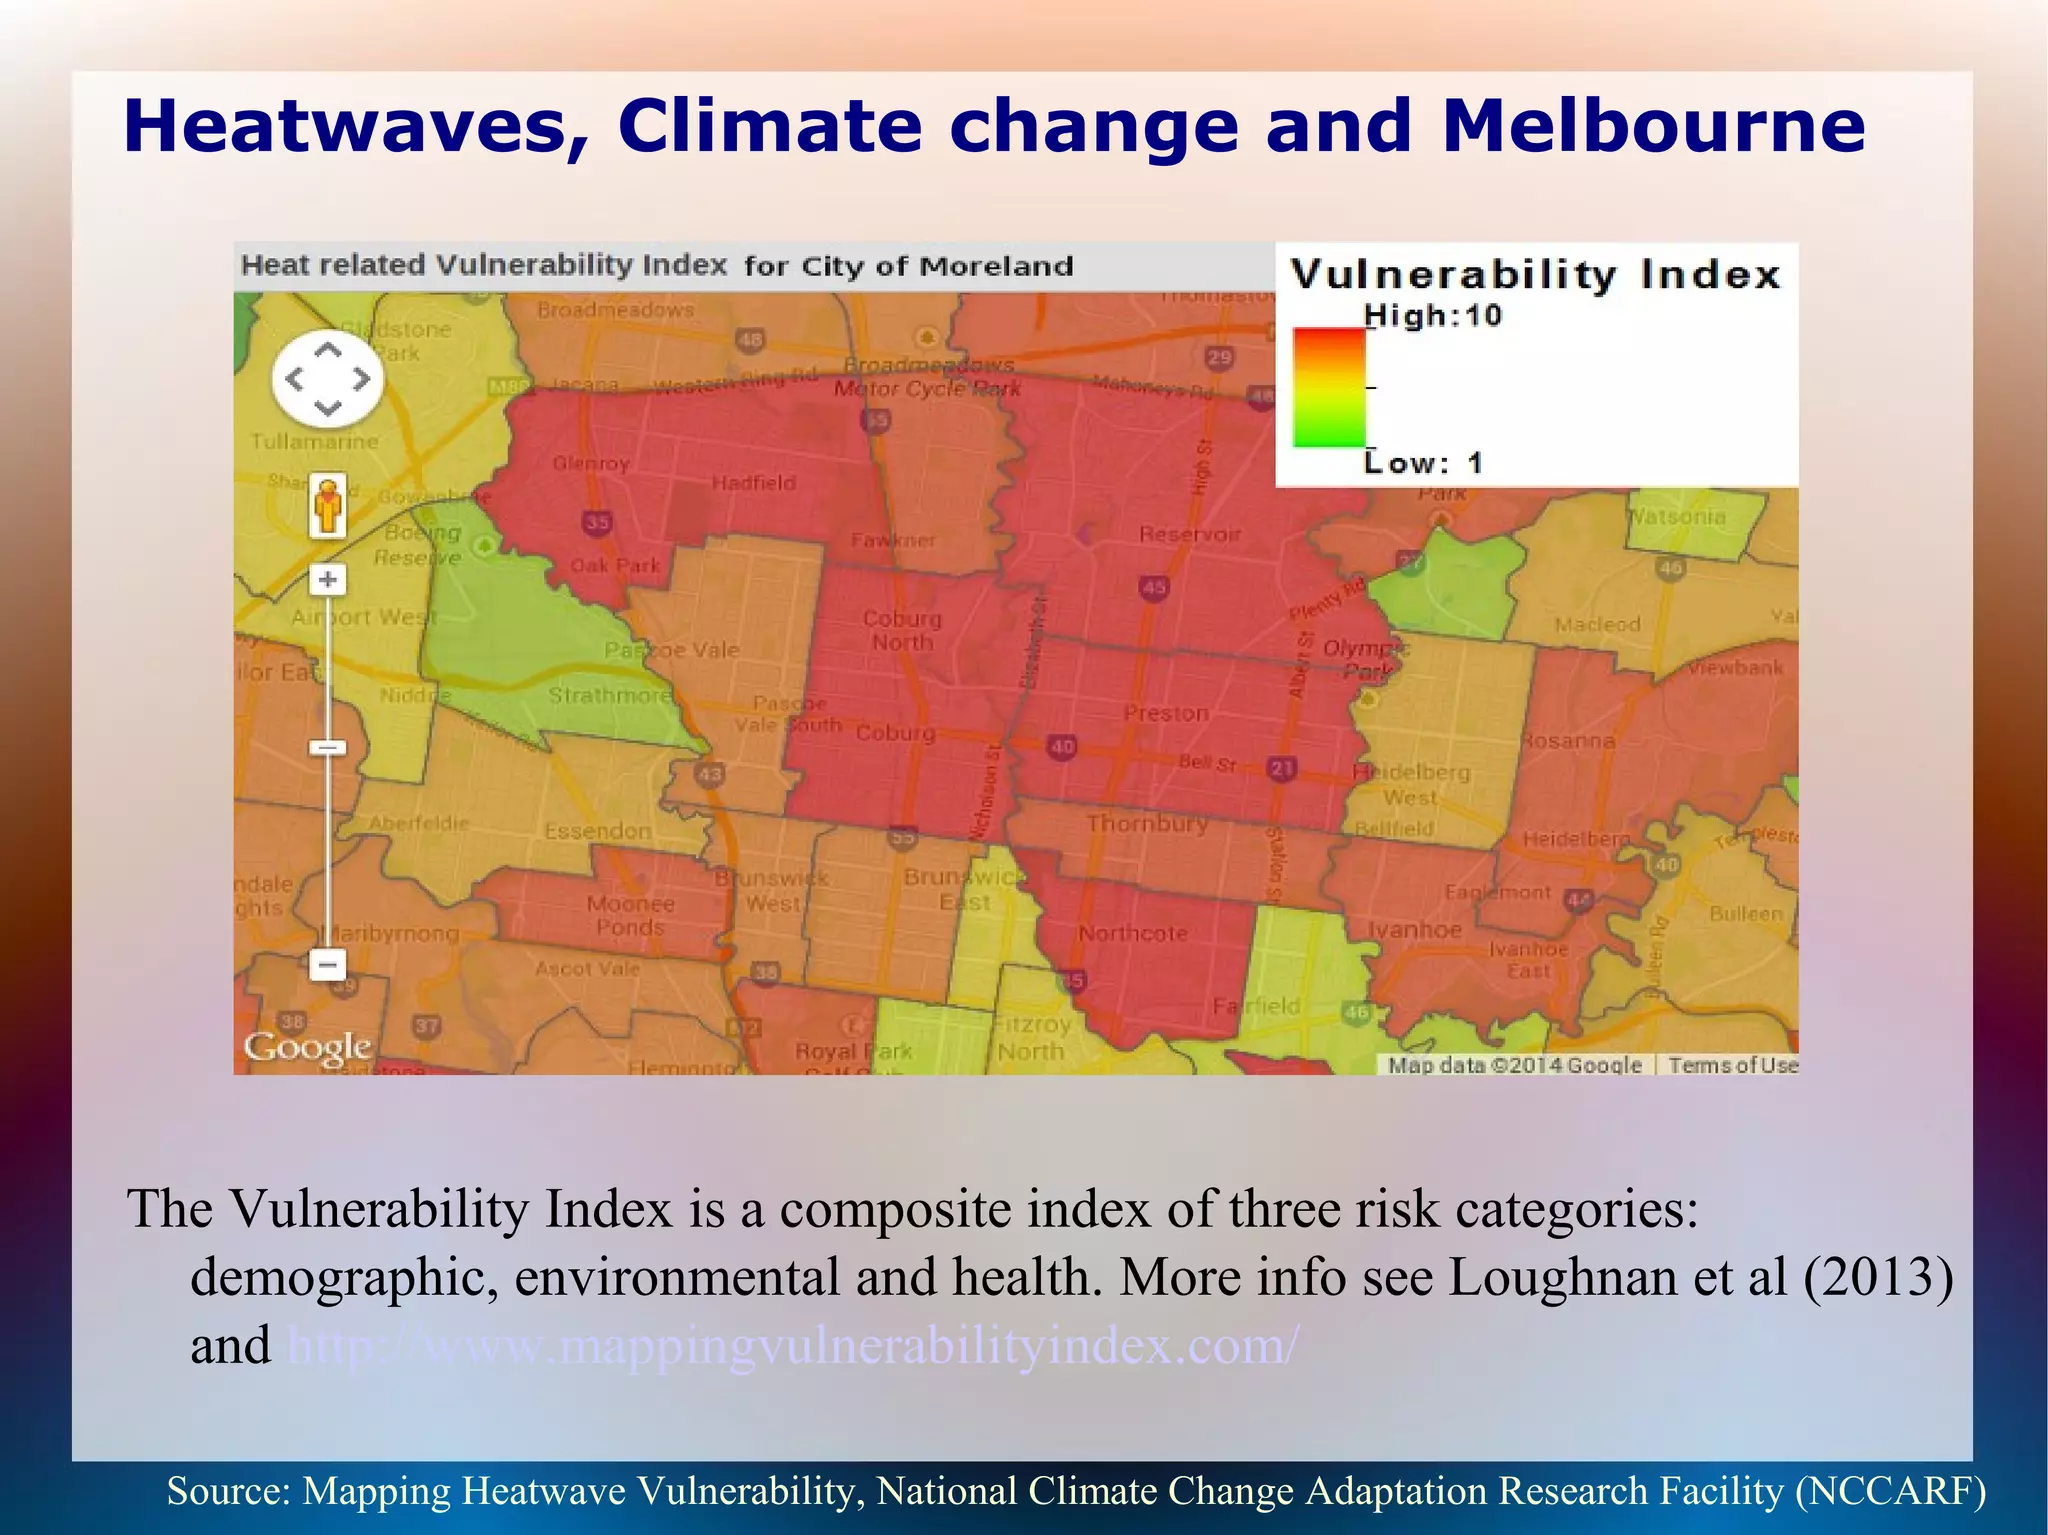
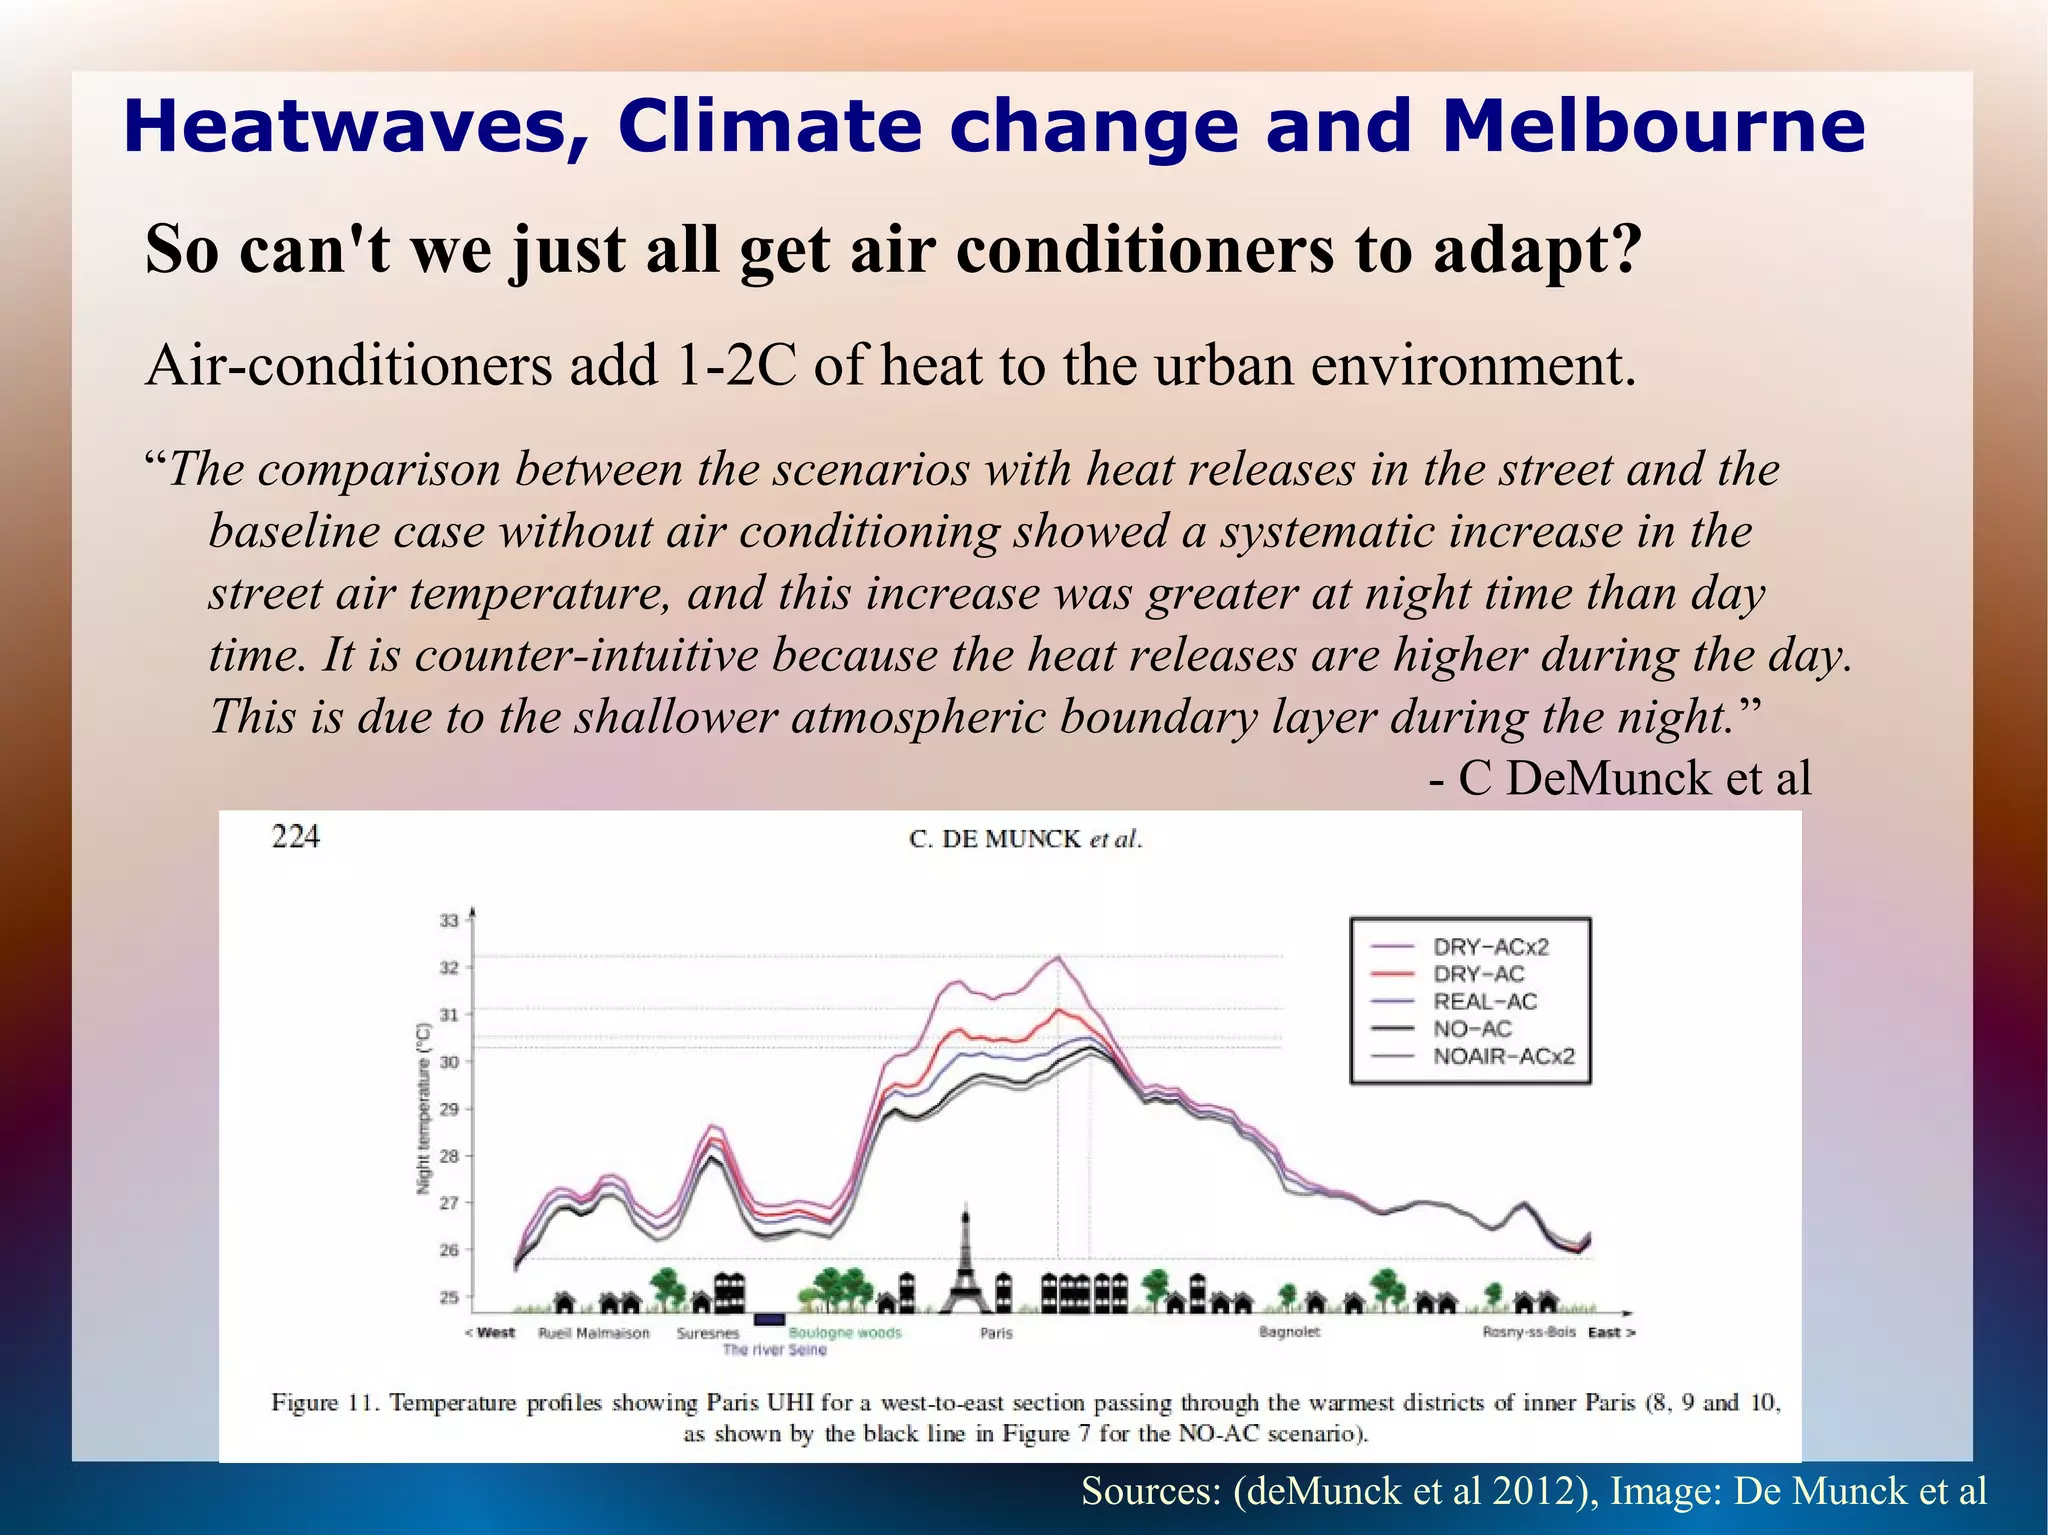
Heatwaves, Climate change and Melbourne
How hot is too hot?
Temperatures and heatwaves
forecast to intensify (Steffen)
Melbourne climate departure is
2045 with BAU (in which the
coldest years will be
consistently hotter than any in
the past 150 years) (Mora)
Can we slow this down?
Can we adapt?
Sources: Steffen,Climate Council (2014), Camilo Mora et al (2013), Own image / Climate Council
Heatwaves, Climate change and Melbourne
Fractional attribution of
Risk:
“ In these simulations with
only natural factors, none of
the nearly 13,000 model
years that we investigated
exceeded our previous
hottest year for Australia,
recorded back in 2005.”
– Sophie Lewis
Source: BOM (2014), Lewis and Karoly (2014)/The Conversation website
How hot is too hot?
2013 hottest year in Australia’s recent temperature record (BOM)
Heatwaves, Climate change and Melbourne
CO2 emitted by humans is main cause (IPCC)
Global Surface temperatures risen – 0.8C since 1880s (IPCC),
Australian temperatures risen 0.9C since 1910 (CSIRO)
Sources: IPCC (2013), CSIRO (2014), Graph from Trenbeth & Fasullo (2013)
Rising CO2 and temperature
Heatwaves, Climate change and Melbourne
Ocean heat content rising
Surface temperatures rising
Sea Levels rising
Sea Ice shrinking
Ice Sheet mass loss
accelerating
Sources: IPCC AR5 (2013), CSIRO (2014), Graph from CSIRO (2014)
Science on climate change is mostly settled
Over 90% of heat uptake is in global oceans
Heatwaves, Climate change and Melbourne
Local Weather Impacts
South East Australia becoming
drier (long term trend - BOM)
Storms, when they do occur,
will be more intense (CSIRO)
More intense and frequent
heatwaves, hotspells (Steffen)
Longer fire season and more
intense fire weather for
bushfires (Hughes, Lucas)
Sources: Steffen (2014), Hughes (2013), Lucas et al (2007), Own image
Heatwaves, Climate change and Melbourne
Heatwaves amplify Urban Heat island effect
Elevated temperatures pose a threat to public health with disruption to
sleep and thermoregulation resulting in heat stress.
Sources: Dan Li et al (2013), Grunstein/The Conversation (2014), Sherwood et al (2010) Image: Courtesy US EPA
• The point
where temperature
starts affecting
sleep is about 23
degrees Celsius –
results in disruption
to REM sleep
(Grunstein)
• Adaptable limit due
to heat stress (35C
for extended periods)
(Sherwood)
Heatwaves, Climate change and Melbourne
Urban impacts of heatwaves and hotspells
Heatwaves kill more people in Australia than any other
natural disaster, excluding epidemics.
Source: Australian State of the Cities Report 2013 cites Australian Emergency Management Institute
Heatwaves, Climate change and Melbourne
2009 Black Saturday bushfires killed 173 people.
2009 Heatwave killed 374 people (excess deaths).
Sources: Public Health Dept (2009) Graph courtesy Public Health Dept
Heatwaves, Climate change and Melbourne
Heat related deaths estimated to increase
Source: Graph courtesy PriceWaterhouseCoopers (2011)
Heatwaves, Climate change and Melbourne
Heatwaves result in Reduced work Productivity
Sources: Dunne et al (2013) Graph courtesy Dunne et al (2013)
A Study estimated:
"labour capacity reduction
to less than 40% by
2200 in peak months,
with most tropical and
mid-latitudes
experiencing extreme
climatological heat
stress.“
- Dunne et al (2013)
Heatwaves, Climate change and Melbourne
We have designed and engineered buildings, structures, public
transport for certain temperature tolerances to mid 30s-low 40s,
we are now exceeding these temperatures. Heatwaves may cause
Cascading Infrastructure failure.
Sources: McEvoy et al (2012), Reeves et al (2010), Nguyen et al (2010), Health Dept (2009) Image from Reeves.
electricity failure and
loadshedding,
public transport
disruptions
Under stress: health
services delivery by
Ambulance, hospitals,
mortuaries.
Heatwaves, Climate change and Melbourne
Source: Climate Institute Report on Infrastructure (2013).
Heatwaves, Climate change and Melbourne
Flying Fox as signature species
with heat tolerance about 41-42C
Young and lactating females
strongly affected.
Thousands died in 2014
Queensland heatwave (Englart)
Yarra Bend colony deaths
Other fauna, birds, plants also
impacted
Sources: Welbergen et al (2008), John Englart (2014), Image Sundew/Flickr
Heatwaves impact urban ecosystems and wildlife
Heatwaves, Climate change and Melbourne
“The spatial distribution of heat related vulnerability in the Melbourne greater
metropolitan area suggests that areas of higher risk are concentrated in the
western and south-eastern regions. These are areas with a higher
concentration of aged persons and households where English is not the
primary language.” – Loughnan et al (2013)
Source: Mapping Heatwave Vulnerability, National Climate Change Adaptation Research Facility (NCCARF)
How vulnerable
is your suburb?
Heatwaves, Climate change and Melbourne
The Vulnerability Index is a composite index of three risk categories:
demographic, environmental and health. More info see Loughnan et al (2013)
and http://www.mappingvulnerabilityindex.com/
Source: Mapping Heatwave Vulnerability, National Climate Change Adaptation Research Facility (NCCARF)
Heatwaves, Climate change and Melbourne
So can't we just all get air conditioners to adapt?
Air-conditioners add 1-2C of heat to the urban environment.
“The comparison between the scenarios with heat releases in the street and the
baseline case without air conditioning showed a systematic increase in the
street air temperature, and this increase was greater at night time than day
time. It is counter-intuitive because the heat releases are higher during the day.
This is due to the shallower atmospheric boundary layer during the night.”
- C DeMunck et al
Sources: (deMunck et al 2012), Image: De Munck et al
Heatwaves, Climate change and Melbourne
Solutions?
Rapid Reduction in CO2 emissions
required to stabilise temperatures (IPCC)
Need to transition: 90% of Victoria's
electricity comes from brown coal
(Arup)
solar PV: 6% of Moreland households
7.2% in Darebin (Englart)
Wind power is 27% capacity in SA, but
less than 3% in Victoria due to
draconian planning regulations (AEMO,
Green)
Future Possibilities: Large scale Solar,
Ocean wave, tidal, geothermal (CSIRO)
Sources: IPCC AR5, Arup (2014), Green (2013), Englart (2013), AEMO (2013), CSIRO (2012), Image John Englart
Heatwaves, Climate change and Melbourne
Increase Urban forest to counter
urban heat island effect (MCC)
Heat alert and emergency
response plan targeting
vulnerable groups (see VCOSS
report)
Increase insulation standards,
building standards (Reeves)
Increase heat tolerances for new
infrastructure, retrofit (Reeves)
Urban planning for more
walking, cycling, PT (Rauland)
Sources: Melbourne City Council (2012), VCOSS (2013), Reeves et al (2010), Rauland (2013)
Climate Adaptation to heatwaves is necessary:
Heatwaves, Climate change and Melbourne
Summary
Climate change is real, impacting now
Action needed by all levels of
Government, business and individuals
to stabilise climate for the future
We all need to reduce our carbon
footprint and emissions
Going back is not an option. We can
slow it down. Climate departure 2073
for Melbourne with mitigation (Mora)
need to adapt to new climates, higher
temperatures and heatwaves
Avoid the unmanageable (mitigate),
and manage the unavoidable (adapt)
Sources: Mora et al (2013), Image John Englart
Heatwaves, Climate change and Melbourne
Actions:
Assess your own carbon
footprint and ways you can
reduce CO2 (WWF & EPA
Victoria web apps)
Lobby those in business or
politics to take action. It's your
future!
Educate yourself on the issues
Sign petitions, use social media
Vote wisely in elections
Source: WWF Carbon footprint calculator result
Presentation by John Englart, NMIT student, March 2014

Heatwaves, climate change and Melbourne

  • 1.
    Heatwaves, Climate changeand Melbourne How hot is too hot? Temperatures and heatwaves forecast to intensify (Steffen) Melbourne climate departure is 2045 with BAU (in which the coldest years will be consistently hotter than any in the past 150 years) (Mora) Can we slow this down? Can we adapt? Sources: Steffen,Climate Council (2014), Camilo Mora et al (2013), Own image / Climate Council
  • 2.
    Heatwaves, Climate changeand Melbourne Fractional attribution of Risk: “ In these simulations with only natural factors, none of the nearly 13,000 model years that we investigated exceeded our previous hottest year for Australia, recorded back in 2005.” – Sophie Lewis Source: BOM (2014), Lewis and Karoly (2014)/The Conversation website How hot is too hot? 2013 hottest year in Australia’s recent temperature record (BOM)
  • 3.
    Heatwaves, Climate changeand Melbourne CO2 emitted by humans is main cause (IPCC) Global Surface temperatures risen – 0.8C since 1880s (IPCC), Australian temperatures risen 0.9C since 1910 (CSIRO) Sources: IPCC (2013), CSIRO (2014), Graph from Trenbeth & Fasullo (2013) Rising CO2 and temperature
  • 4.
    Heatwaves, Climate changeand Melbourne Ocean heat content rising Surface temperatures rising Sea Levels rising Sea Ice shrinking Ice Sheet mass loss accelerating Sources: IPCC AR5 (2013), CSIRO (2014), Graph from CSIRO (2014) Science on climate change is mostly settled Over 90% of heat uptake is in global oceans
  • 5.
    Heatwaves, Climate changeand Melbourne Local Weather Impacts South East Australia becoming drier (long term trend - BOM) Storms, when they do occur, will be more intense (CSIRO) More intense and frequent heatwaves, hotspells (Steffen) Longer fire season and more intense fire weather for bushfires (Hughes, Lucas) Sources: Steffen (2014), Hughes (2013), Lucas et al (2007), Own image
  • 6.
    Heatwaves, Climate changeand Melbourne Heatwaves amplify Urban Heat island effect Elevated temperatures pose a threat to public health with disruption to sleep and thermoregulation resulting in heat stress. Sources: Dan Li et al (2013), Grunstein/The Conversation (2014), Sherwood et al (2010) Image: Courtesy US EPA • The point where temperature starts affecting sleep is about 23 degrees Celsius – results in disruption to REM sleep (Grunstein) • Adaptable limit due to heat stress (35C for extended periods) (Sherwood)
  • 7.
    Heatwaves, Climate changeand Melbourne Urban impacts of heatwaves and hotspells Heatwaves kill more people in Australia than any other natural disaster, excluding epidemics. Source: Australian State of the Cities Report 2013 cites Australian Emergency Management Institute
  • 8.
    Heatwaves, Climate changeand Melbourne 2009 Black Saturday bushfires killed 173 people. 2009 Heatwave killed 374 people (excess deaths). Sources: Public Health Dept (2009) Graph courtesy Public Health Dept
  • 9.
    Heatwaves, Climate changeand Melbourne Heat related deaths estimated to increase Source: Graph courtesy PriceWaterhouseCoopers (2011)
  • 10.
    Heatwaves, Climate changeand Melbourne Heatwaves result in Reduced work Productivity Sources: Dunne et al (2013) Graph courtesy Dunne et al (2013) A Study estimated: "labour capacity reduction to less than 40% by 2200 in peak months, with most tropical and mid-latitudes experiencing extreme climatological heat stress.“ - Dunne et al (2013)
  • 11.
    Heatwaves, Climate changeand Melbourne We have designed and engineered buildings, structures, public transport for certain temperature tolerances to mid 30s-low 40s, we are now exceeding these temperatures. Heatwaves may cause Cascading Infrastructure failure. Sources: McEvoy et al (2012), Reeves et al (2010), Nguyen et al (2010), Health Dept (2009) Image from Reeves. electricity failure and loadshedding, public transport disruptions Under stress: health services delivery by Ambulance, hospitals, mortuaries.
  • 12.
    Heatwaves, Climate changeand Melbourne Source: Climate Institute Report on Infrastructure (2013).
  • 13.
    Heatwaves, Climate changeand Melbourne Flying Fox as signature species with heat tolerance about 41-42C Young and lactating females strongly affected. Thousands died in 2014 Queensland heatwave (Englart) Yarra Bend colony deaths Other fauna, birds, plants also impacted Sources: Welbergen et al (2008), John Englart (2014), Image Sundew/Flickr Heatwaves impact urban ecosystems and wildlife
  • 14.
    Heatwaves, Climate changeand Melbourne “The spatial distribution of heat related vulnerability in the Melbourne greater metropolitan area suggests that areas of higher risk are concentrated in the western and south-eastern regions. These are areas with a higher concentration of aged persons and households where English is not the primary language.” – Loughnan et al (2013) Source: Mapping Heatwave Vulnerability, National Climate Change Adaptation Research Facility (NCCARF) How vulnerable is your suburb?
  • 15.
    Heatwaves, Climate changeand Melbourne The Vulnerability Index is a composite index of three risk categories: demographic, environmental and health. More info see Loughnan et al (2013) and http://www.mappingvulnerabilityindex.com/ Source: Mapping Heatwave Vulnerability, National Climate Change Adaptation Research Facility (NCCARF)
  • 16.
    Heatwaves, Climate changeand Melbourne So can't we just all get air conditioners to adapt? Air-conditioners add 1-2C of heat to the urban environment. “The comparison between the scenarios with heat releases in the street and the baseline case without air conditioning showed a systematic increase in the street air temperature, and this increase was greater at night time than day time. It is counter-intuitive because the heat releases are higher during the day. This is due to the shallower atmospheric boundary layer during the night.” - C DeMunck et al Sources: (deMunck et al 2012), Image: De Munck et al
  • 17.
    Heatwaves, Climate changeand Melbourne Solutions? Rapid Reduction in CO2 emissions required to stabilise temperatures (IPCC) Need to transition: 90% of Victoria's electricity comes from brown coal (Arup) solar PV: 6% of Moreland households 7.2% in Darebin (Englart) Wind power is 27% capacity in SA, but less than 3% in Victoria due to draconian planning regulations (AEMO, Green) Future Possibilities: Large scale Solar, Ocean wave, tidal, geothermal (CSIRO) Sources: IPCC AR5, Arup (2014), Green (2013), Englart (2013), AEMO (2013), CSIRO (2012), Image John Englart
  • 18.
    Heatwaves, Climate changeand Melbourne Increase Urban forest to counter urban heat island effect (MCC) Heat alert and emergency response plan targeting vulnerable groups (see VCOSS report) Increase insulation standards, building standards (Reeves) Increase heat tolerances for new infrastructure, retrofit (Reeves) Urban planning for more walking, cycling, PT (Rauland) Sources: Melbourne City Council (2012), VCOSS (2013), Reeves et al (2010), Rauland (2013) Climate Adaptation to heatwaves is necessary:
  • 19.
    Heatwaves, Climate changeand Melbourne Summary Climate change is real, impacting now Action needed by all levels of Government, business and individuals to stabilise climate for the future We all need to reduce our carbon footprint and emissions Going back is not an option. We can slow it down. Climate departure 2073 for Melbourne with mitigation (Mora) need to adapt to new climates, higher temperatures and heatwaves Avoid the unmanageable (mitigate), and manage the unavoidable (adapt) Sources: Mora et al (2013), Image John Englart
  • 20.
    Heatwaves, Climate changeand Melbourne Actions: Assess your own carbon footprint and ways you can reduce CO2 (WWF & EPA Victoria web apps) Lobby those in business or politics to take action. It's your future! Educate yourself on the issues Sign petitions, use social media Vote wisely in elections Source: WWF Carbon footprint calculator result Presentation by John Englart, NMIT student, March 2014

Editor's Notes

  • #2 Climate Council review of heatwaves issued February 2014. Photo is of electricity transmission towers during the heatwave at Glenroy taken by me. Will Steffen, Lesley Hughes, Sarah Perkins (February 2014) Heatwaves: Hotter, Longer, More Often – Climate Council http://www.climatecouncil.org.au/heatwaves-report Climate Departure was an interesting study estimating when cities might have a totally new (warmer) climate (no overlap). See Camilo Mora, Abby G. Frazier, Ryan J. Longman, Rachel S. Dacks, Maya M. Walton, Eric J. Tong, Joseph J. Sanchez, Lauren R. Kaiser, Yuko O. Stender, James M. Anderson, Christine M. Ambrosino, Iria Fernandez-Silva, Louise M. Giuseffi, Thomas W. Giambelluca. The projected timing of climate departure from recent variability. (abstract, Nature, 2013; 502 (7470): 183 DOI: 10.1038/nature12540. I wrote about this in October 2013: Climate Departure: Oceans already outside historical variability as cities and ecosystems follow http://takvera.blogspot.com.au/2013/10/climate-departure-oceans-aleady-outside.html It is possible to slow down rate of rise, but reducing temps in short timeframes is not possible.
  • #3 Australian Bureau of Meteorology Annual climate statement 2013, issued 3 January 2014 Professor David Karoly and Sophie Lewis from Melbourne University analysed last years Australian temperatures, They really were off the charts. Article published on The Conversation, but study presently going through peer review publication process. See also special case study in WMO Statement on the status of the global climate in 2013 (2014) http://library.wmo.int/opac/index.php?lvl=notice_display&id=15957 Lewis, S. C., and D. J. Karoly (2013), Anthropogenic contributions to Australia's record summer temperatures of 2013, Geophys. Res. Lett., 40, 3705–3709, doi:10.1002/grl.50673. See also Karoly Lewis, The Conversation, 6 January 2014 - Australia’s hottest year was no freak event: humans caused it https://theconversation.com/australias-hottest-year-was-no-freak-event-humans-caused-it-21734
  • #4 IPCC AR5 Climate Change 2013: The Physical Science Basis (2013) http://www.climatechange2013.org/ CSIRO State of the Australian Climate Report (2014) The last 15 years there has been a hiatus in surface temperatures, but global warming has continued apace as indicated by the other signals. It is thought hiatus is connected with long decadal cycles in Pacific ocean. We may be due soon for a switch to positive phase which may spike temperatures to get atmospheric temperatures back on trend. - Trenbeth & Fasullo (2013) Trenberth, K. E. and Fasullo, J. T. (2013), An apparent hiatus in global warming?. Earth's Future, 1: 19–32. doi: 10.1002/2013EF000165
  • #5 See IPCC AR5 Climate Change 2013: The Physical Science Basis (2013) http://www.climatechange2013.org/ CSIRO State of the Australian Climate Report (2014) The last 15 years there has been a hiatus in surface temperatures, but global warming has continued apace as indicated by the other signals. It is thought hiatus is connected with long decadal cycles in Pacific ocean. We may be due soon for a switch to positive phase which may spike temperatures to get atmospheric temperatures back on trend. See Trenberth, K. E. and Fasullo, J. T. (2013), An apparent hiatus in global warming?. Earth's Future, 1: 19–32. doi: 10.1002/2013EF000165
  • #6 Although Australia overall may have about the same rainfall, we are already seeing long term trend changes in SW and SE Australia becoming drier. (BOM) The projection is that this will continue. Higher temperatures and drier climate reduces soil moisture and humidity increasing fire weather season and intensity = More extreme bushfires CSIRO State of the Australian Climate Report (2014) Will Steffen, Lesley Hughes, Sarah Perkins (February 2014) Heatwaves: Hotter, Longer, More Often – Climate Council http://www.climatecouncil.org.au/heatwaves-report C. Lucas, K. Hennessy, G. Mills and J. Bathols (2007) Bushfire Weather in Southeast Australia: Recent Trends and Projected Climate Change Impacts, Bushfire CRC and CSIRO Hughes, Lesley, (2013) Climate Council report – Be Prepared: Climate Change and the Australian Bushfire Threat http://www.climatecouncil.org.au/be-prepared
  • #7 Dan Li and Elie Bou-Zeid, Synergistic Interactions between Urban Heat Islands and Heat Waves: the Impact in Cities is Larger than the Sum of its Parts, (abstract), Journal of Applied Meteorology and Climatology 201, May 2013, doi: http://dx.doi.org/10.1175/JAMC-D-13-02.1 Daniel Argüeso, Jason P. Evans, Lluís Fita, Kathryn J. Bormann, Climate Dynamics May 2013 - Temperature response to future urbanization and climate change (abstract) DOI 10.1007/s00382-013-1789-6 Englart, J (10 July, 2013) Urbanization amplifies global warming temperatures for Sydney http://takvera.blogspot.com.au/2013/07/urbanization-amplifies-global-warming.html “While heatwave temperatures are mainly measured by daytime maximum temperatures, night time minimum temperatures are important for allowing biological systems to recharge and sleep. When minimum temperatures stay high, it impacts human health by disrupting sleep and not allowing core body heat to cool overnight. That point where temperature affects sleep is about 23 degrees Celsius.” Englart, J (13 January 2014) Extreme Heatwave hits Southeast Australia http://takvera.blogspot.com.au/2014/01/extreme-heatwave-hits-southeast.html Ron Grunstein, (8 January 2013) Too hot to sleep? Here’s why https://theconversation.com/too-hot-to-sleep-heres-why-11492 Donna Green, The Conversation (16 January 2014) How heat can make your body melt down from the inside out https://theconversation.com/how-heat-can-make-your-body-melt-down-from-the-inside-out-22042 Sherwood and Huber (2010) An adaptability limit to climate change due to heat stress. PNAS Englart J (11 May 2010) Scientists outline health limits of heat stress with Climate Change http://takvera.blogspot.com.au/2010/05/scientists-outline-health-limits-of.html
  • #8 Australian State of the Cities 2013 report Table 4-1 which sources this information on comparitive fatalities from the Australian Emergency Management Institute 2013 http://www.infrastructure.gov.au/infrastructure/pab/soac/
  • #9 Department of Human Services (2009), January 2009 Heatwave in Victoria: an Assessment of Health Impacts, Victorian Government www.health.vic.gov.au
  • #10 PriceWaterhouseCoopers, (November 2011), Protecting human health and safety during severe and extreme heat events. A national framework. Report for Australian Government Department of Climate Change and Energy and Efficiency http://www.pwc.com.au/industry/government/assets/extreme-heat-events-nov11.pdf
  • #11 John P. Dunne, Ronald J. Stouffer, & Jasmin G. John, Nature Climate Change (2013) doi:10.1038/nclimate1827, Reductions in labour capacity from heat stress under climate warming (abstract) Englart, J (26 February, 2013) Climate change to increase heat stress, reduce work capacity http://takvera.blogspot.com.au/2013/02/climate-change-to-increase-heat-stress.html
  • #12 Keating A and Handmer J (2013) Future potential losses from extremes under climate change: the case of Victoria, Australia. VCCCAR Project: Framing Adaptation in the Victorian Context, Working Paper Victorian Centre for Climate Change Adaptation Research, Melbourne. Climate Institute (2013), Infrastructure Interdependencies and Business-Level Impacts Report. Darryn McEvoy, Iftekhar Ahmed and Jane Mullett, (2012), The impact of the 2009 heat wave on Melbourne’s critical infrastructure, Local Environment Vol. 17, No. 8, September 2012, 783 –796 Jim Reeves, Colleen Foelz, Peter Grace, Peter Best, Torben Marcussen, Shahbaz Mushtaq, Roger Stone, Margaret Loughnan, Darryn McEvoy, Ifte Ahmed, Jane Mullett, Katharine Haynes, Deanne Bird, Lucinda Coates, Megan Ling, (2010), Impacts and adaptation response of infrastructure and communities to heatwaves: the southern Australian experience of 2009, NCCARF – National Climate Change Adaptation Research Facility. Minh Nguyen, Xiaoming Wang and Dong Chen (2010), An Investigation of Extreme Heatwave Events and Their Effects on Building & Infrastructure, CSIRO National Flagships Climate Adaptation Department of Human Services (2009), January 2009 Heatwave in Victoria: an Assessment of Health Impacts, Victorian Government www.health.vic.gov.au
  • #13 Climate Institute (2013), Infrastructure Interdependencies and Business-Level Impacts Report.
  • #14 Justin A Welbergen, Stefan M Klose, Nicola Markus and Peggy Eby (2008), Climate change and the effects of temperature extremes on Australian flying-foxes. Proceedings of the Royal Society B Biological Sciences, doi: 10.1098/rspb.2007.1385 Englart J (7 January 2014) Mass bat deaths in record setting Queensland heatwave http://takvera.blogspot.com.au/2014/01/mass-bat-deaths-in-record-setting.html
  • #15 Margaret E Loughnan, Nigel J Tapper, Thu Phan, Kellie Lynch, Judith A McInnes (2013) Report. A spatial vulnerability analysis of urban populations during extreme heat events in Australian capital cities (NCCARF, Monash University) Website: http://www.mappingvulnerabilityindex.com/
  • #16 Margaret E Loughnan, Nigel J Tapper, Thu Phan, Kellie Lynch, Judith A McInnes (2013) Report. A spatial vulnerability analysis of urban populations during extreme heat events in Australian capital cities (NCCARF, Monash University) Website: http://www.mappingvulnerabilityindex.com/
  • #17 Cecile De Munck et al (2012) - How much can air conditioning increase air temperatures for a city like Paris, France? (abstract), International Journal of Climatology, 33 : 210 - 227 (2013) DOI: 10.1002/joc.3415 Englart, J (31 May, 2013) - Cities to get much hotter as heatwaves amplify Urban Heat Island Effect http://takvera.blogspot.com.au/2013/05/cities-to-get-much-hotter-as-heatwaves.html Ohashi et al 2007, Hsieh et al 2007 also detail impact of air-conditioning in the urban microclimates of Tokyo and Taipei.
  • #18 IPCC AR5 Climate Change 2013: The Physical Science Basis (2013) http://www.climatechange2013.org/ Englart, J (12 December 2013) Solar PV Panel installations in Fawkner exceed 5 per cent of dwellings http://fawkner.org/2013/12/12/solar-pv-panel-installations-in-fawkner-exceed-5-per-cent-of-dwellings/ AEMO (2013) South Australian Wind Study Report Michael Green, Sydney Morning Herald (19 October 2013) Wind farms may be more acceptable in Victoria http://www.smh.com.au/national/wind-farms-may-be-more-acceptable-in-victoria-20131218-2zl3s.html quoting Victoria's Commissioner for Environmental Sustainability Professor Kate Auty from a report. Tom Arup, The Age (9 March 2014) - Fire at Morwell reignites brown-coal debate http://www.theage.com.au/victoria/fire-at-morwell-reignites-browncoal-debate-20140308-34e3n.html CSIRO, (2012) Ocean renewable energy: 2012-2050. http://www.csiro.au/ocean-renewable-energy
  • #19 City of Melbourne Council (2012) Urban Forest Strategy. Making a great city greener 2012-2032 http://melbourne.vic.gov.au/urbanforest VCOSS report (March 2013): Feeling the heat: heat waves and social vulnerability in Victoria http://vcoss.org.au/feeling-the-heat-heat-waves-and-social-vulnerability-in-victoria/ Jim Reeves, Colleen Foelz, Peter Grace, Peter Best, Torben Marcussen, Shahbaz Mushtaq, Roger Stone, Margaret Loughnan, Darryn McEvoy, Ifte Ahmed, Jane Mullett, Katharine Haynes, Deanne Bird, Lucinda Coates, Megan Ling, (2010), Impacts and adaptation response of infrastructure and communities to heatwaves: the southern Australian experience of 2009, NCCARF – National Climate Change Adaptation Research Facility. Rauland, Vanessa (2013), Decarbonising cities: certifying carbon reduction in urban development (PhD thesis) Curtin University, Faculty of Humanities, Curtin University Sustainability Policy Institute http://espace.library.curtin.edu.au/R?func=dbin-jump-full&local_base=gen01-era02&object_id=194386
  • #20 See Camilo Mora, Abby G. Frazier, Ryan J. Longman, Rachel S. Dacks, Maya M. Walton, Eric J. Tong, Joseph J. Sanchez, Lauren R. Kaiser, Yuko O. Stender, James M. Anderson, Christine M. Ambrosino, Iria Fernandez-Silva, Louise M. Giuseffi, Thomas W. Giambelluca. The projected timing of climate departure from recent variability. (abstract, Nature, 2013; 502 (7470): 183 DOI: 10.1038/nature12540. Englart, J (15 October 2013) Climate Departure: Oceans already outside historical variability as cities and ecosystems follow http://takvera.blogspot.com.au/2013/10/climate-departure-oceans-aleady-outside.html
  • #21 Calculate your carbon footprint. The average Australian Household emits about 14-19 tonnes of greenhouse gases every year. I have reduced mine to 3.2 tonnes/year. How do you rate? Two Australian carbon footprint calculators: http://www.wwf.org.au/our_work/people_and_the_environment/human_footprint/footprint_calculator/ http://www.epa.vic.gov.au/Ecologicalfootprint/calculators/personal/introduction.asp