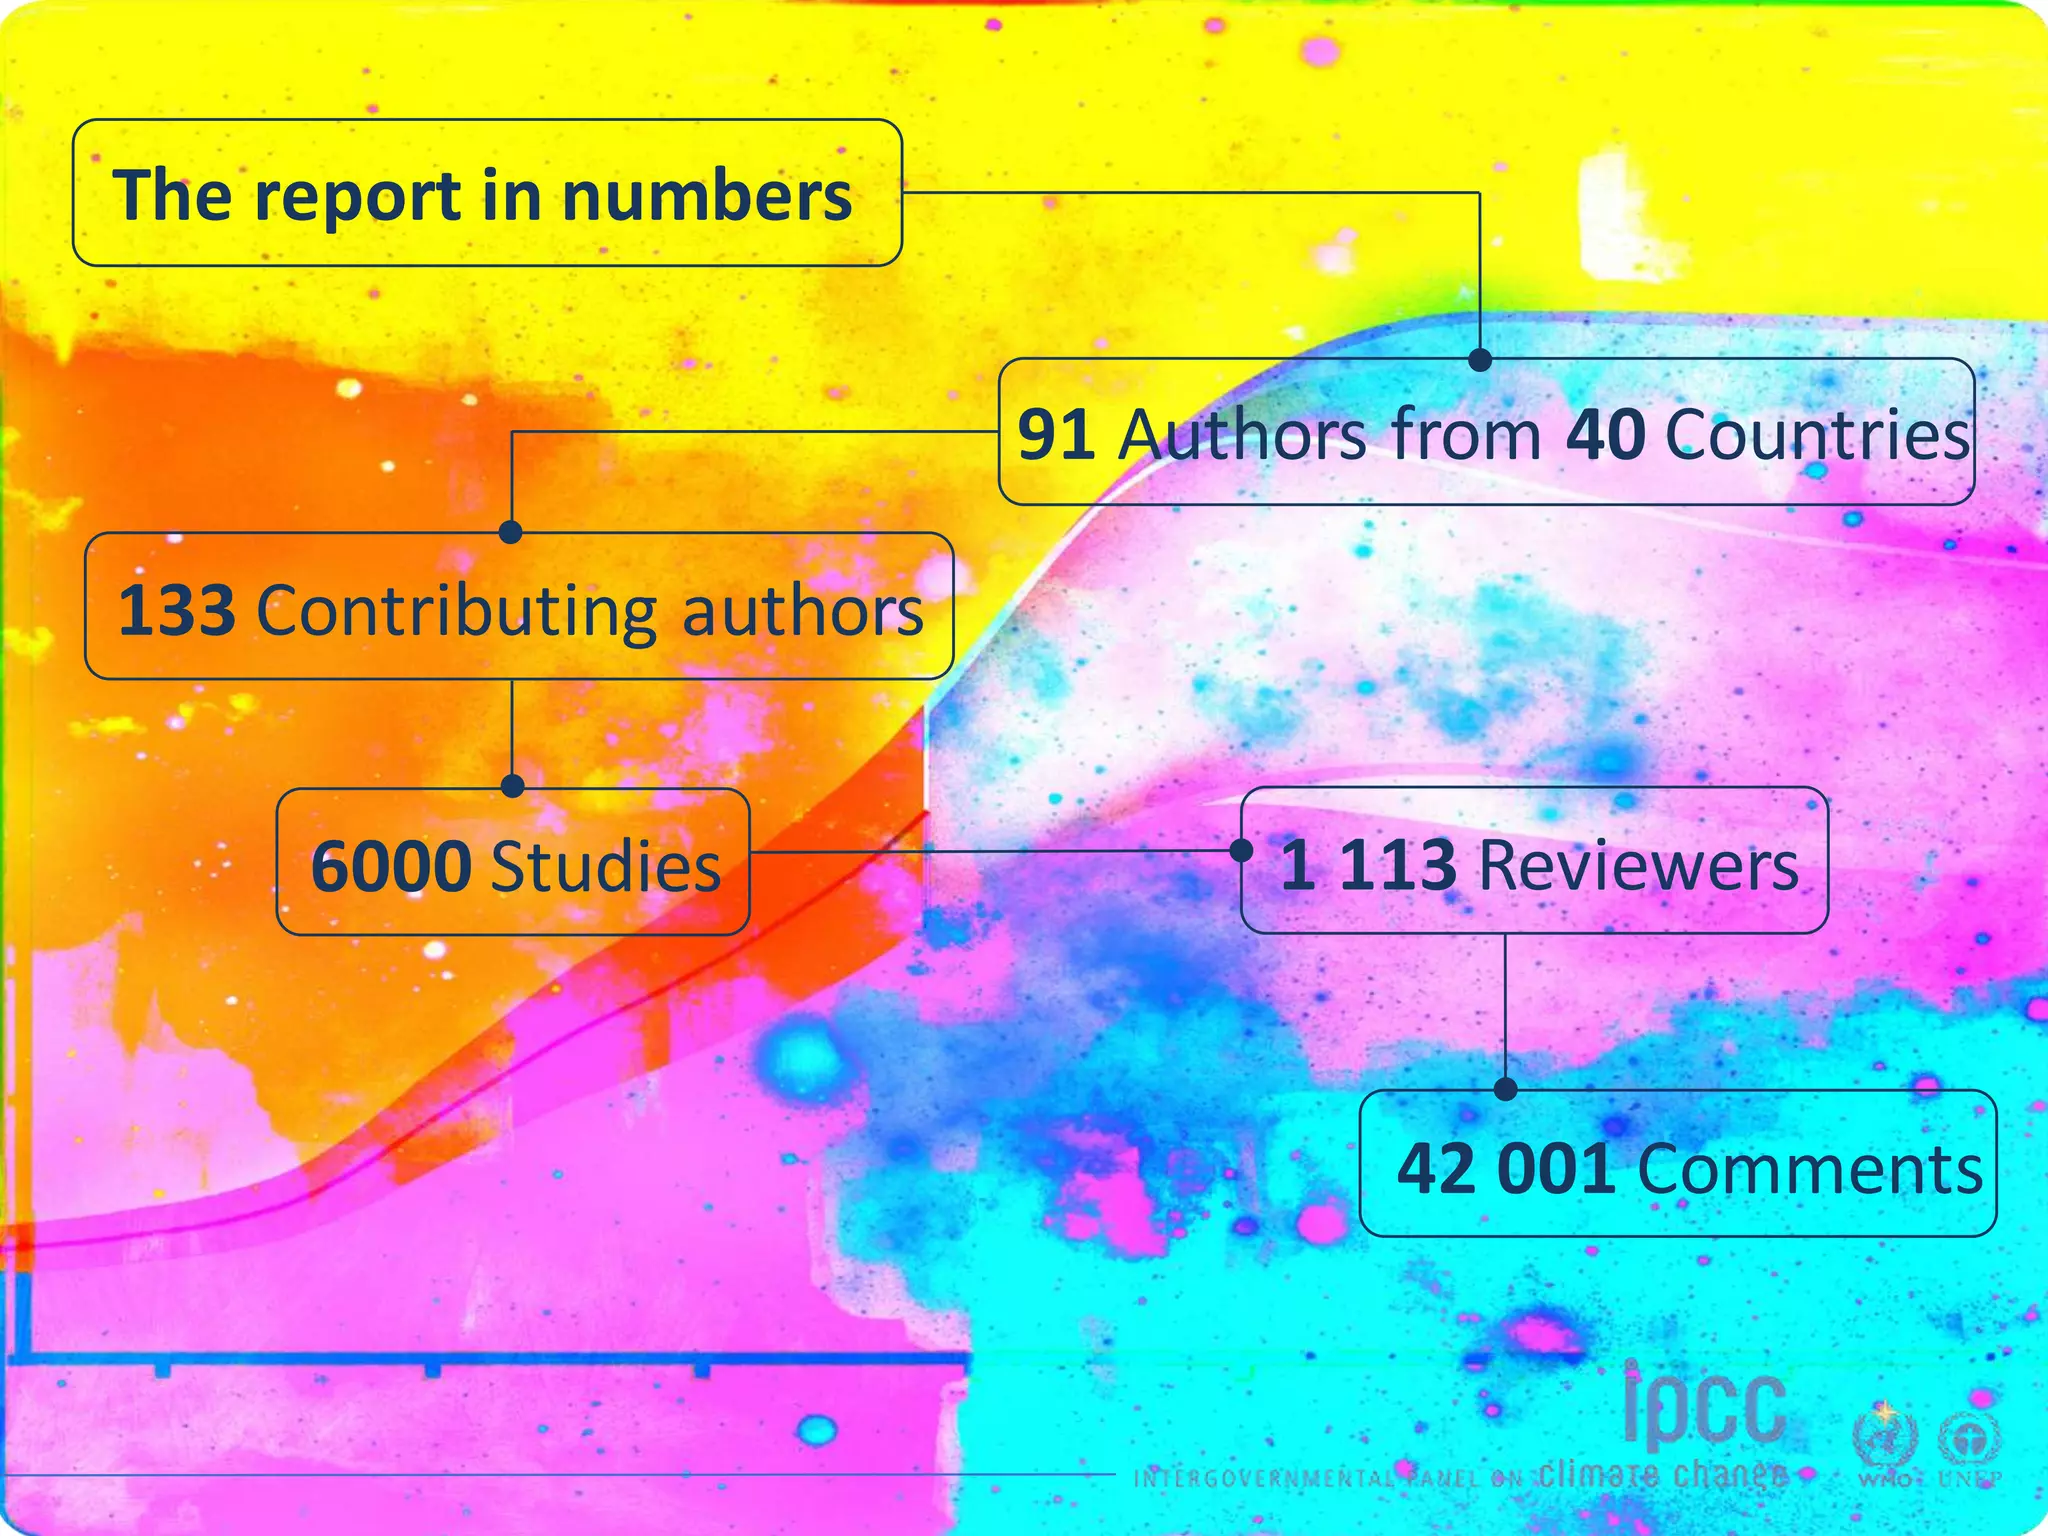
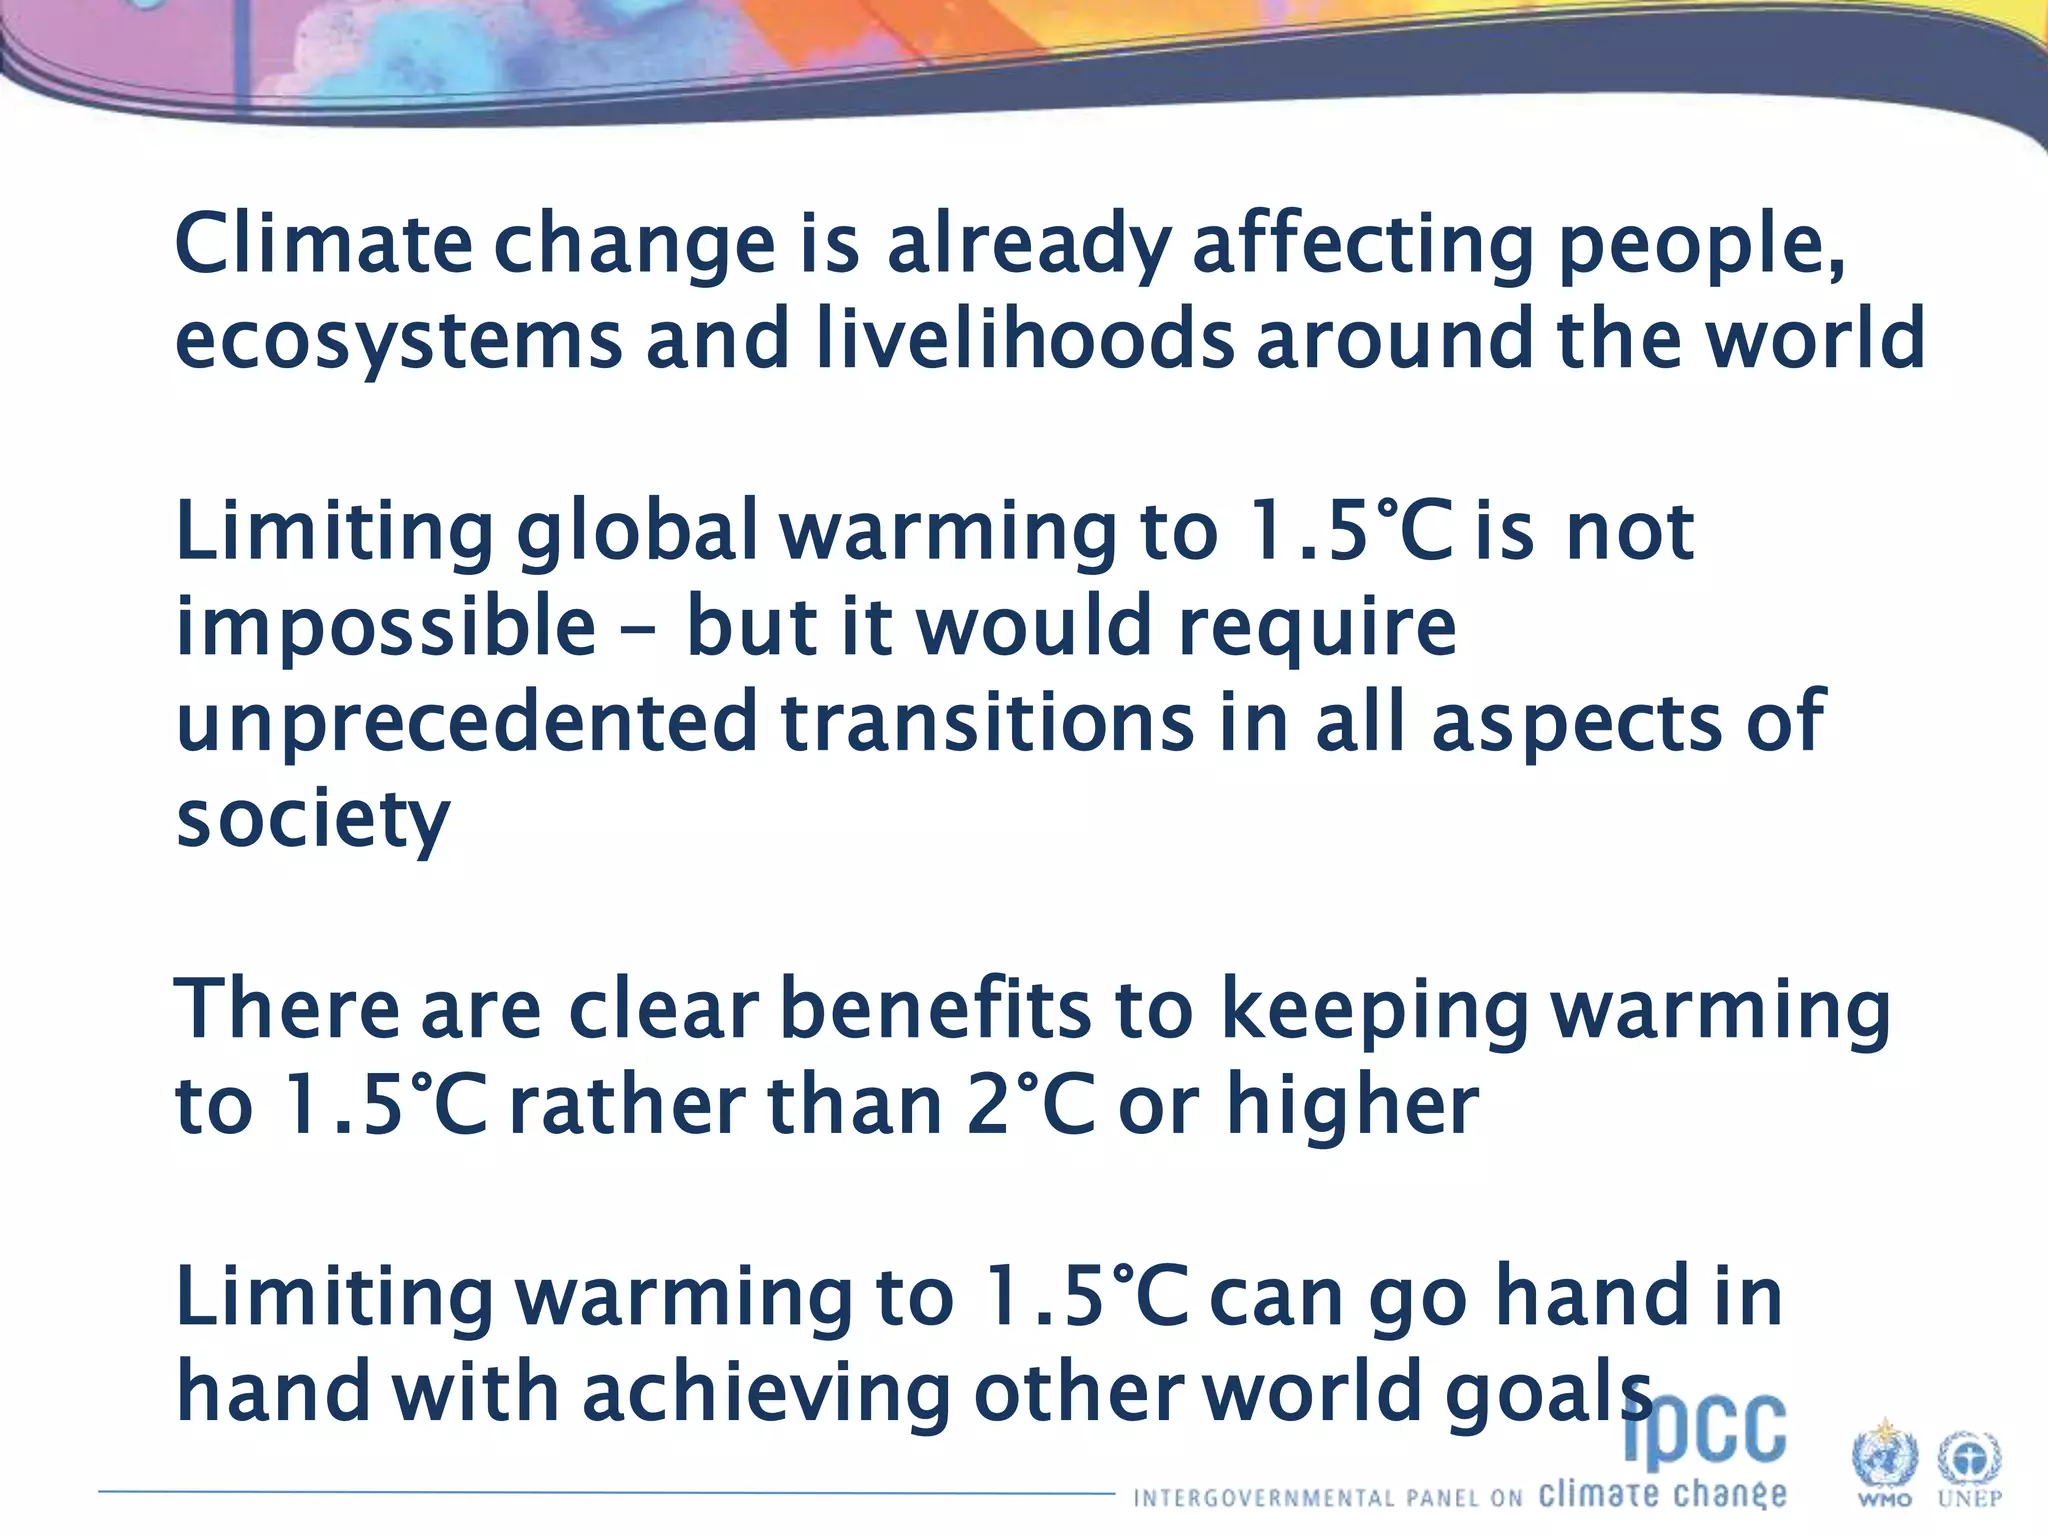
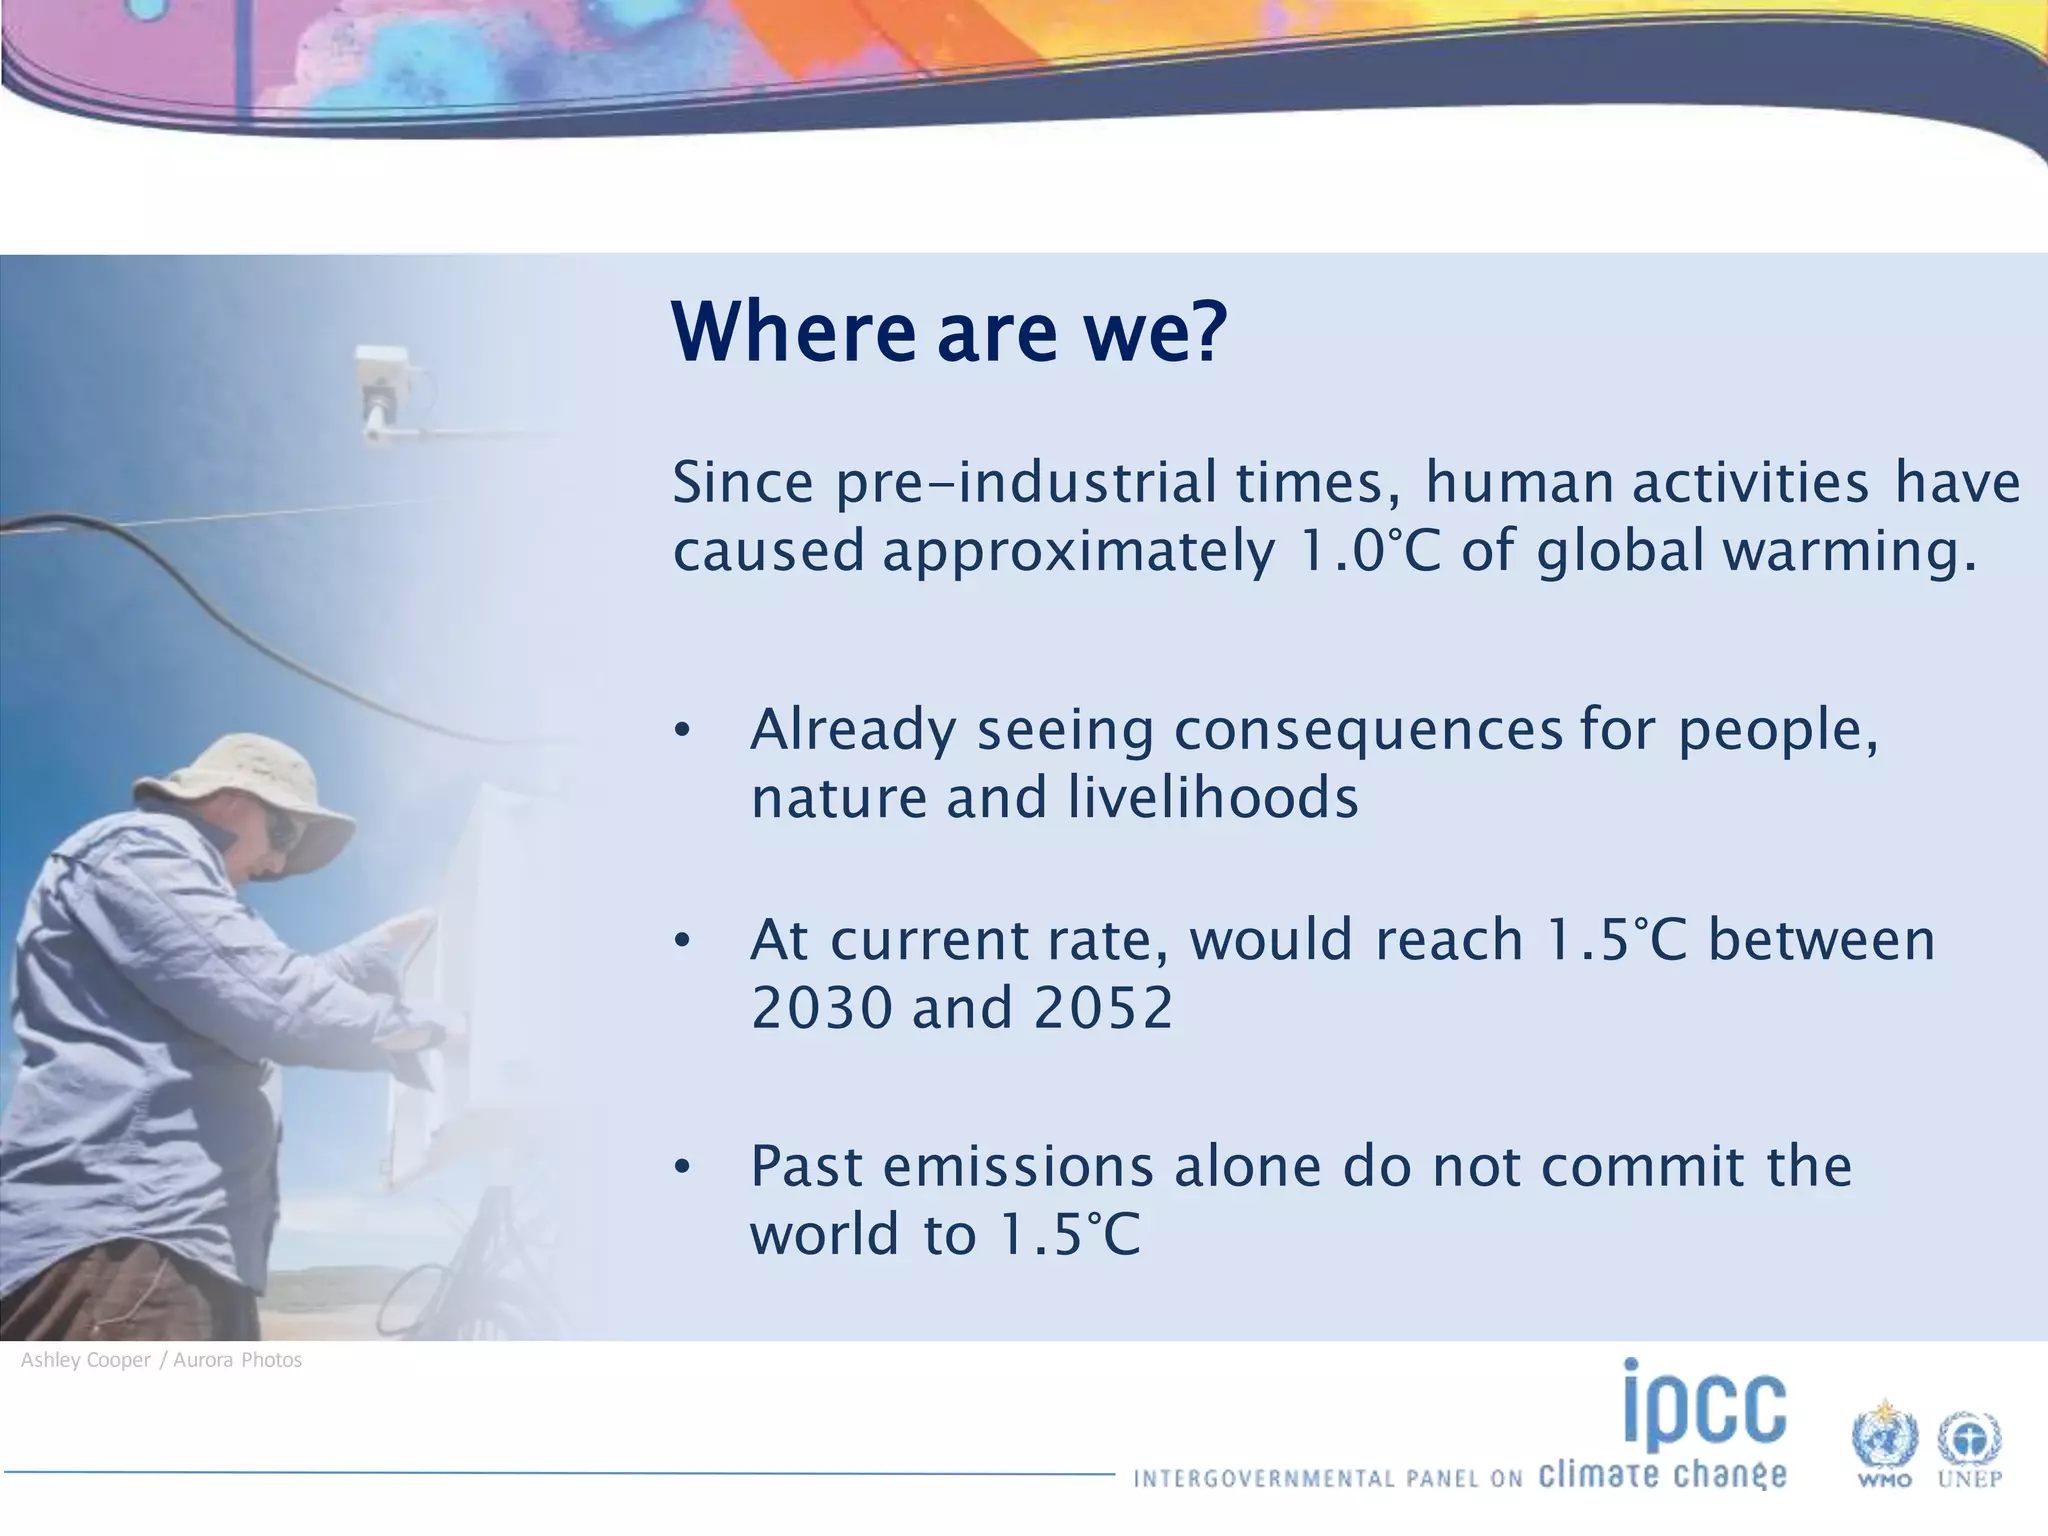
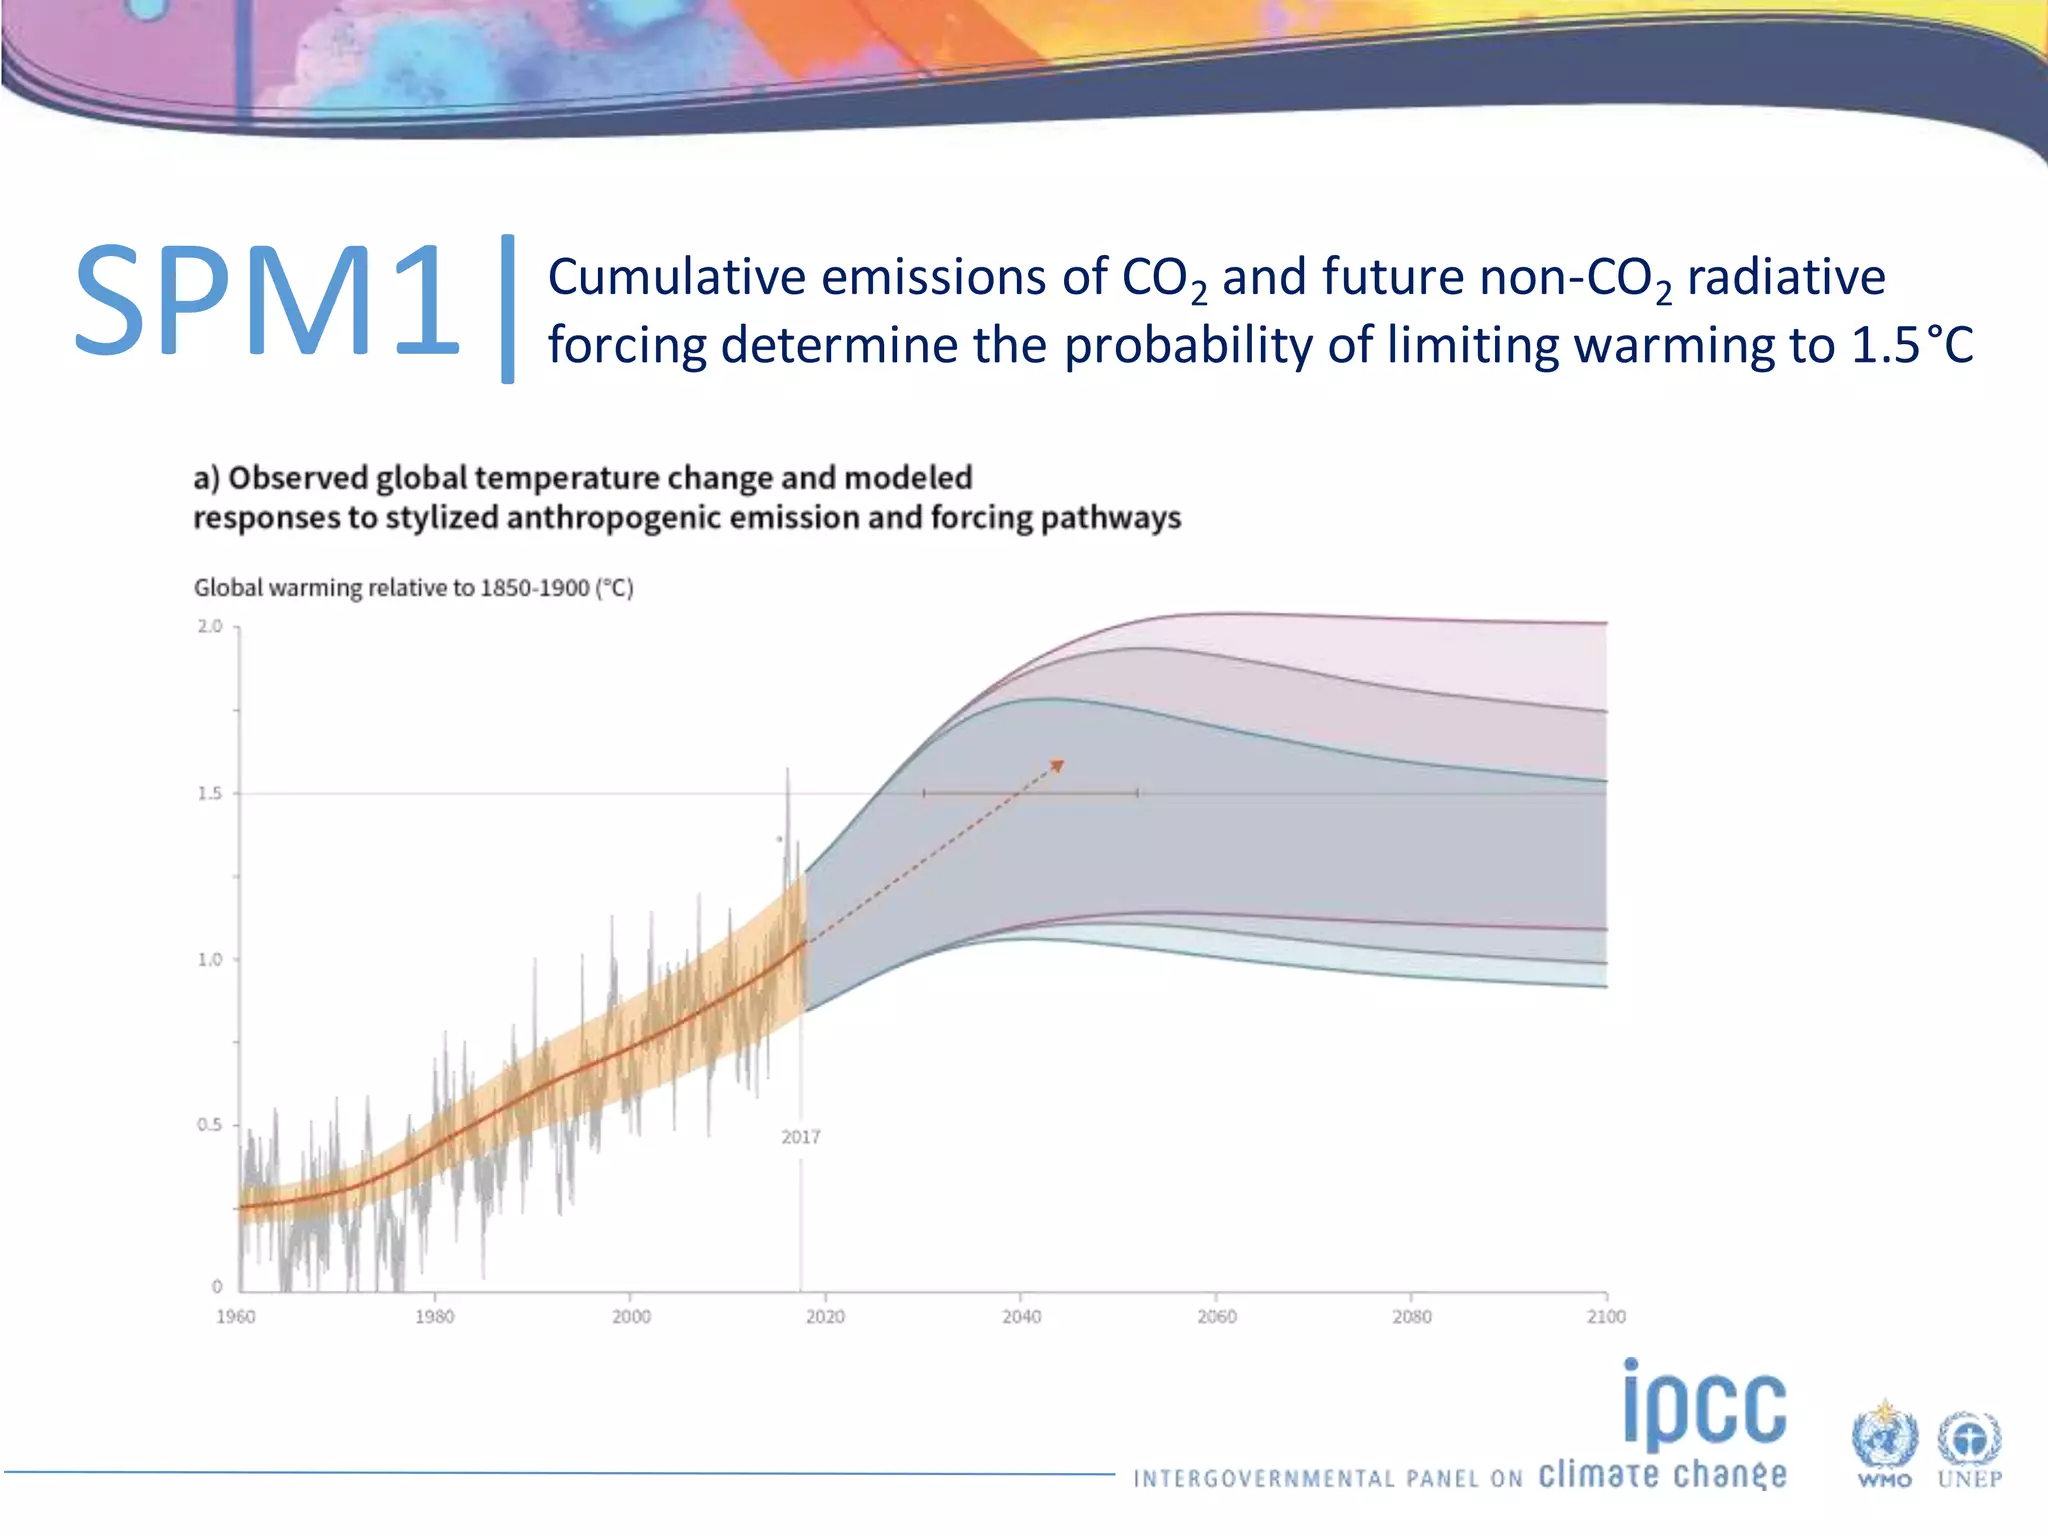
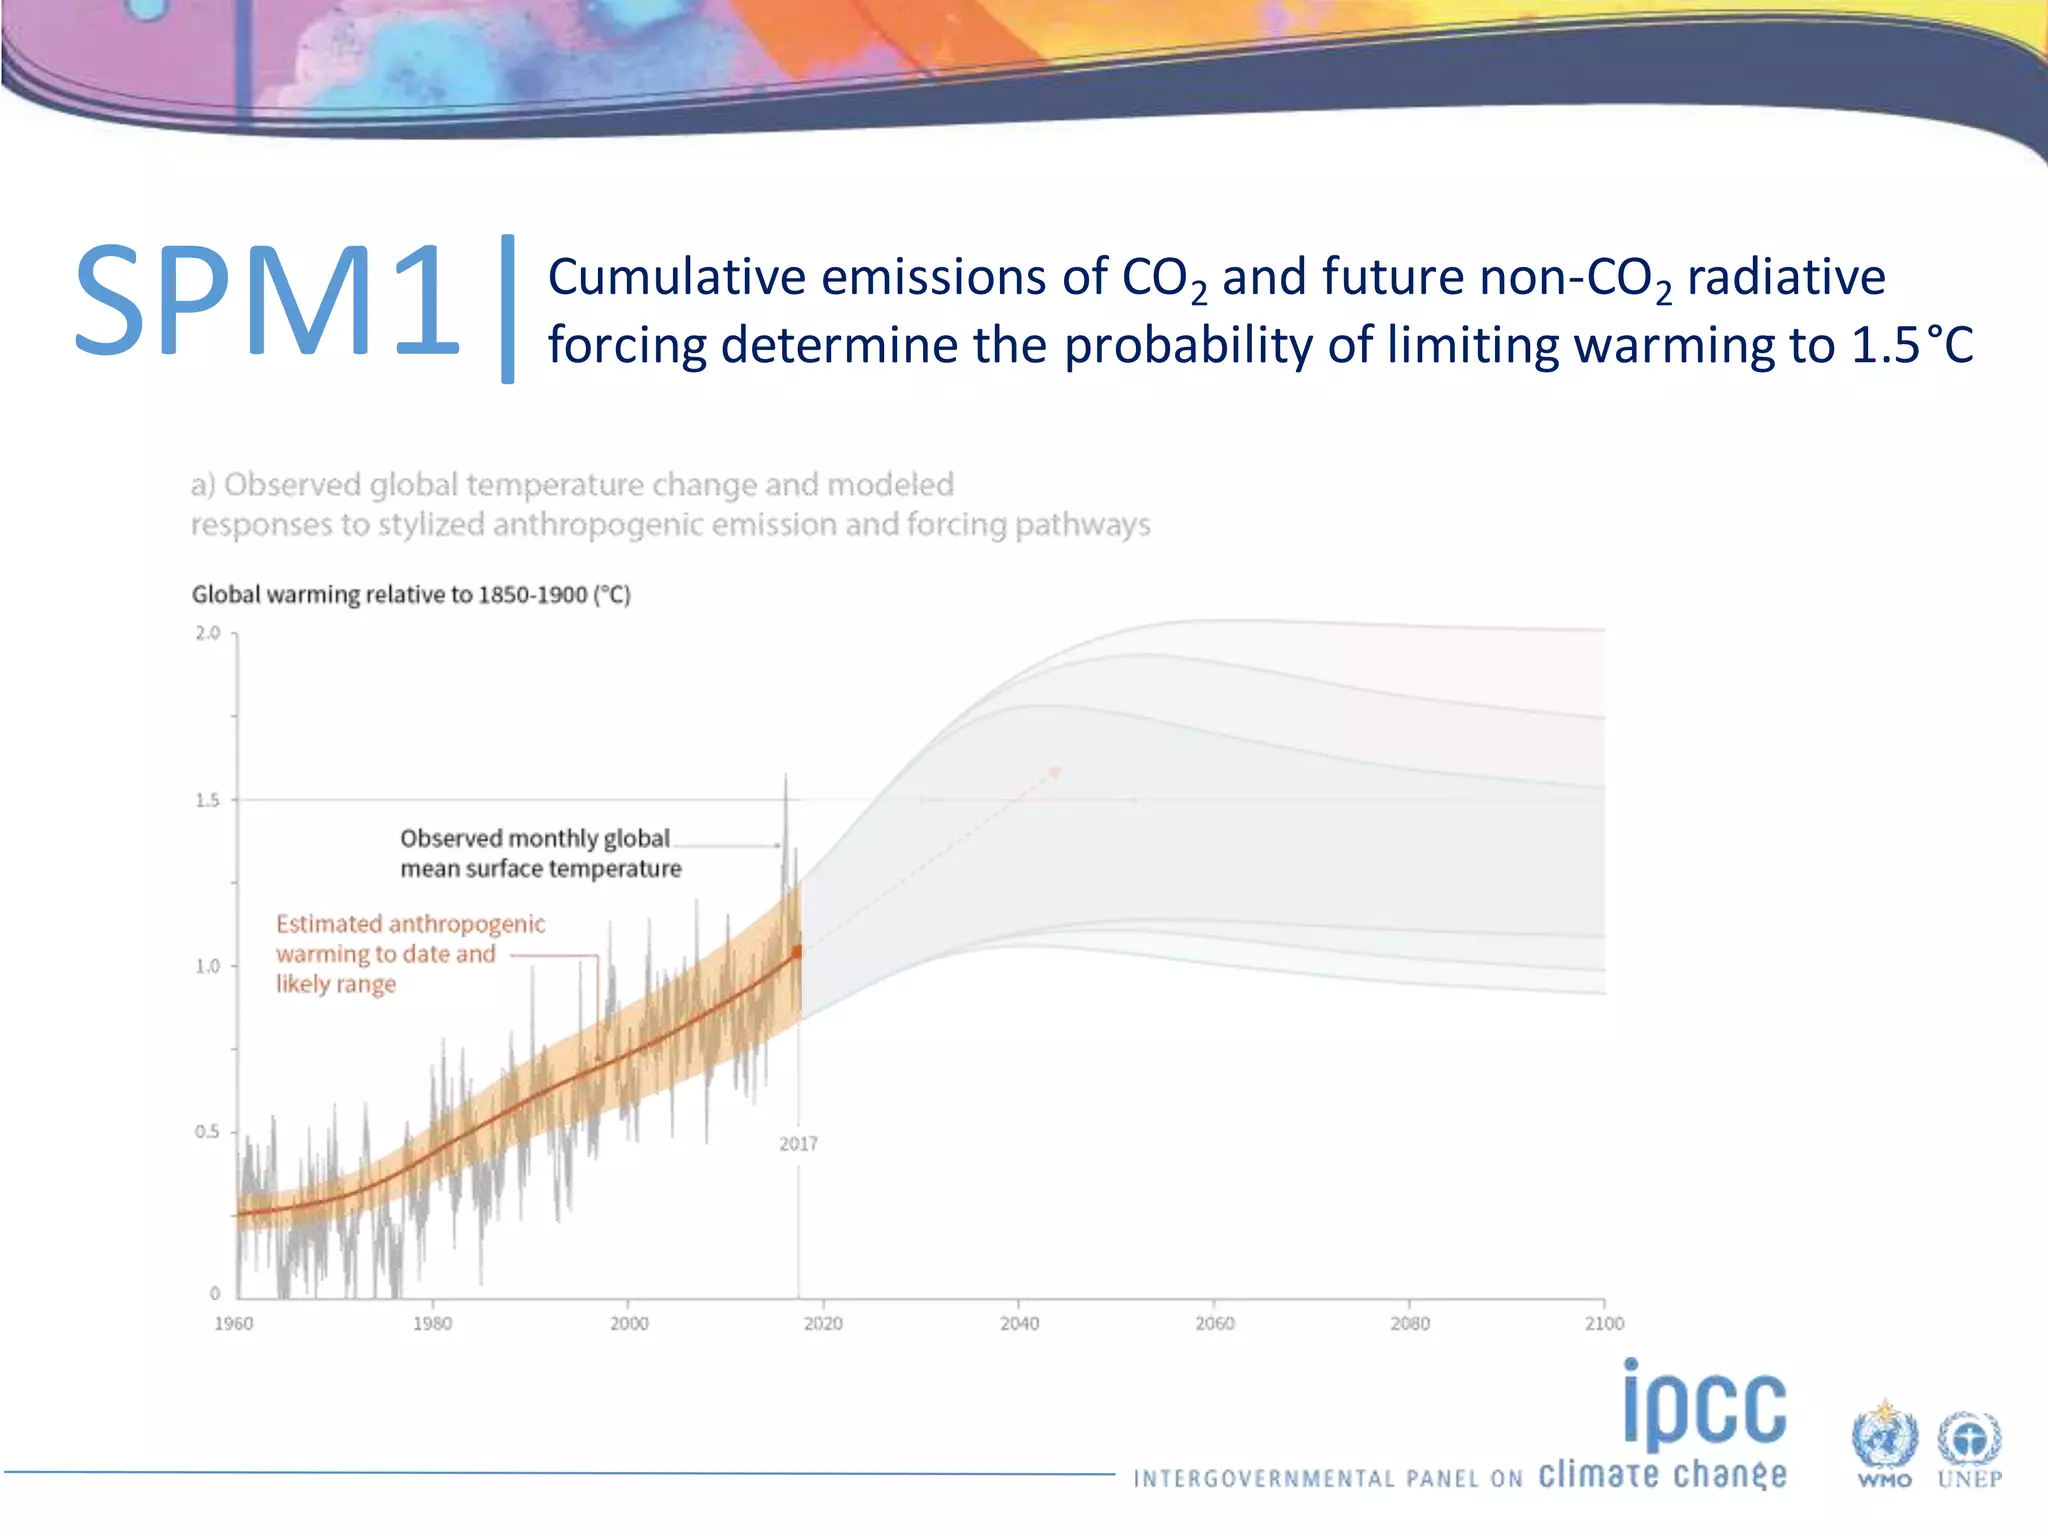
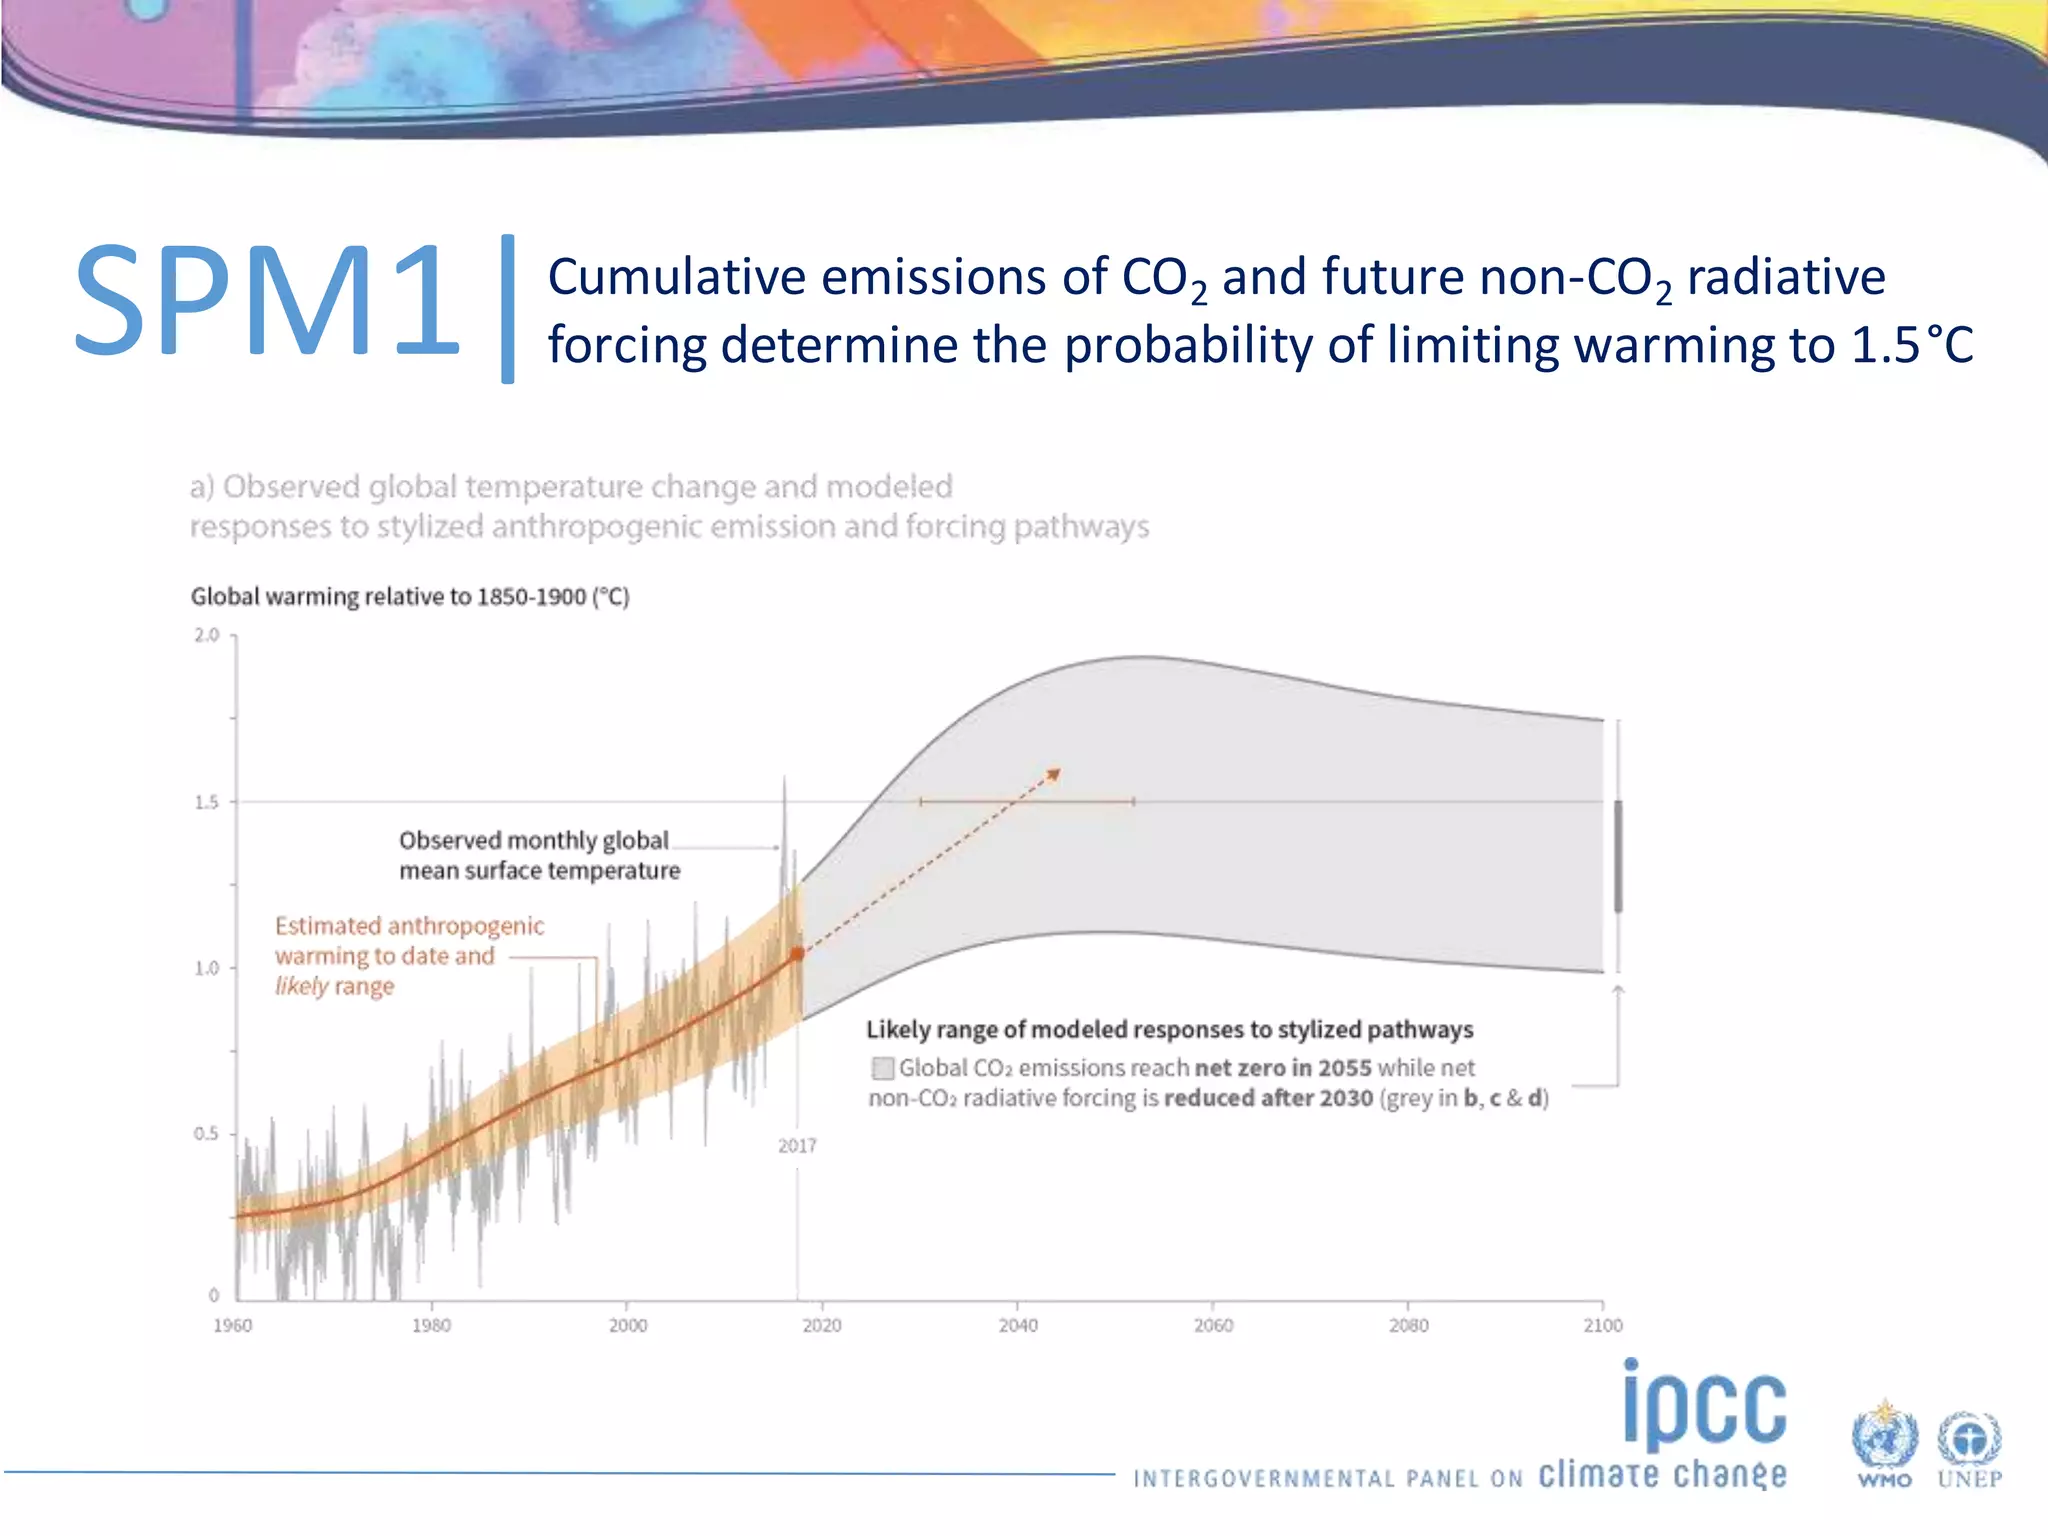
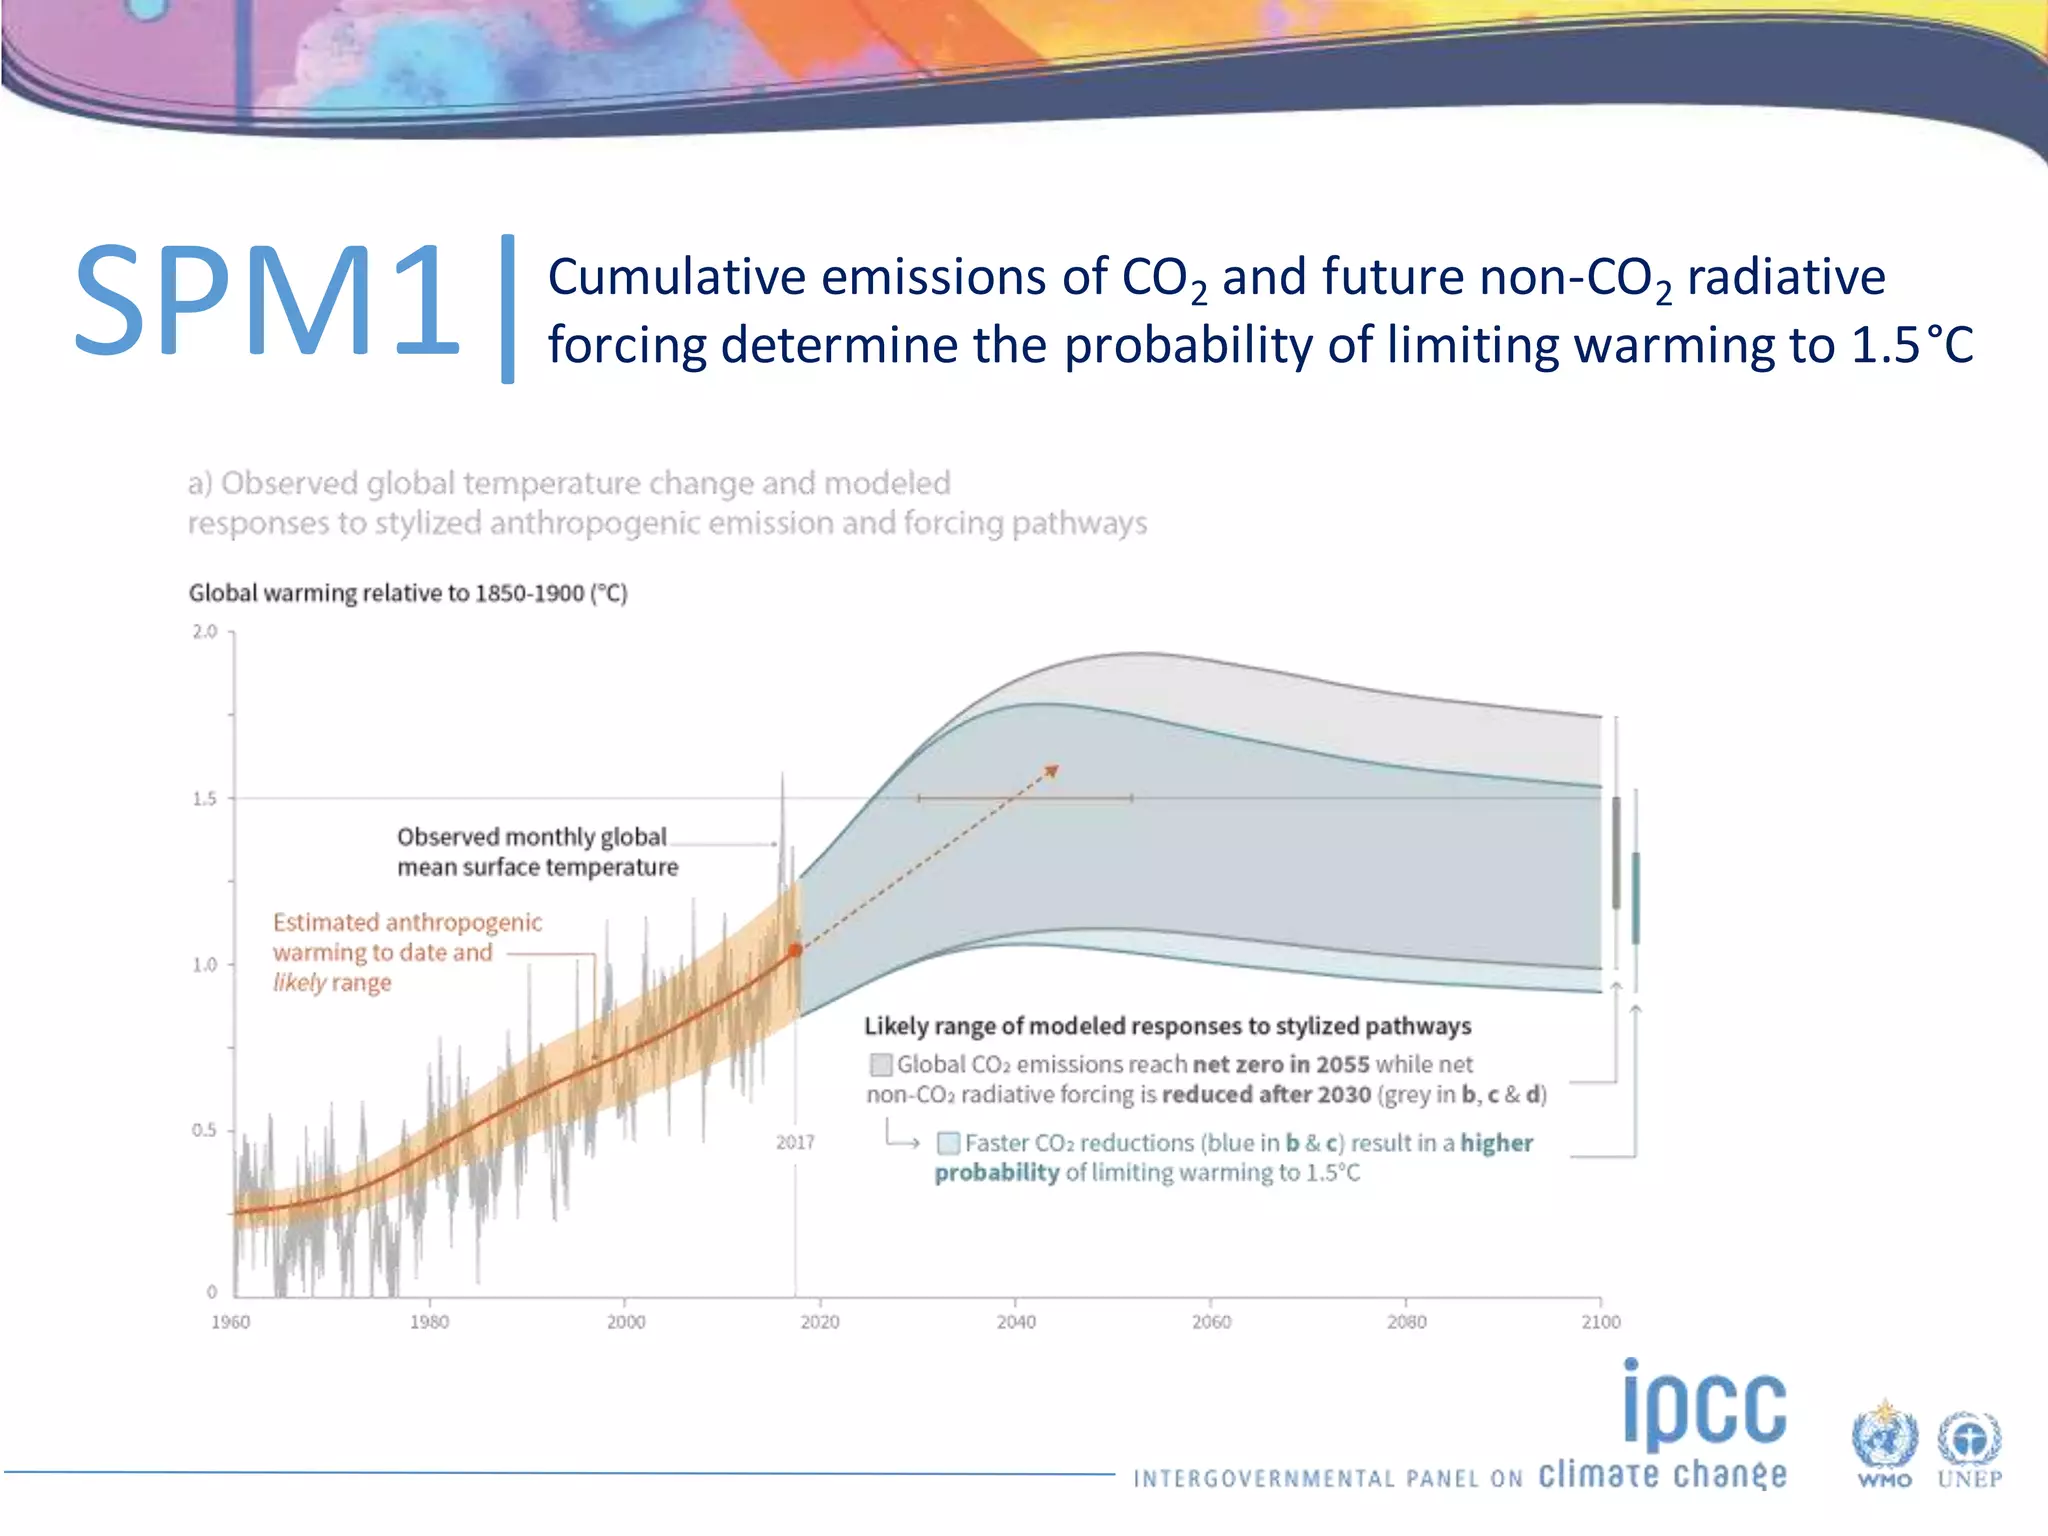
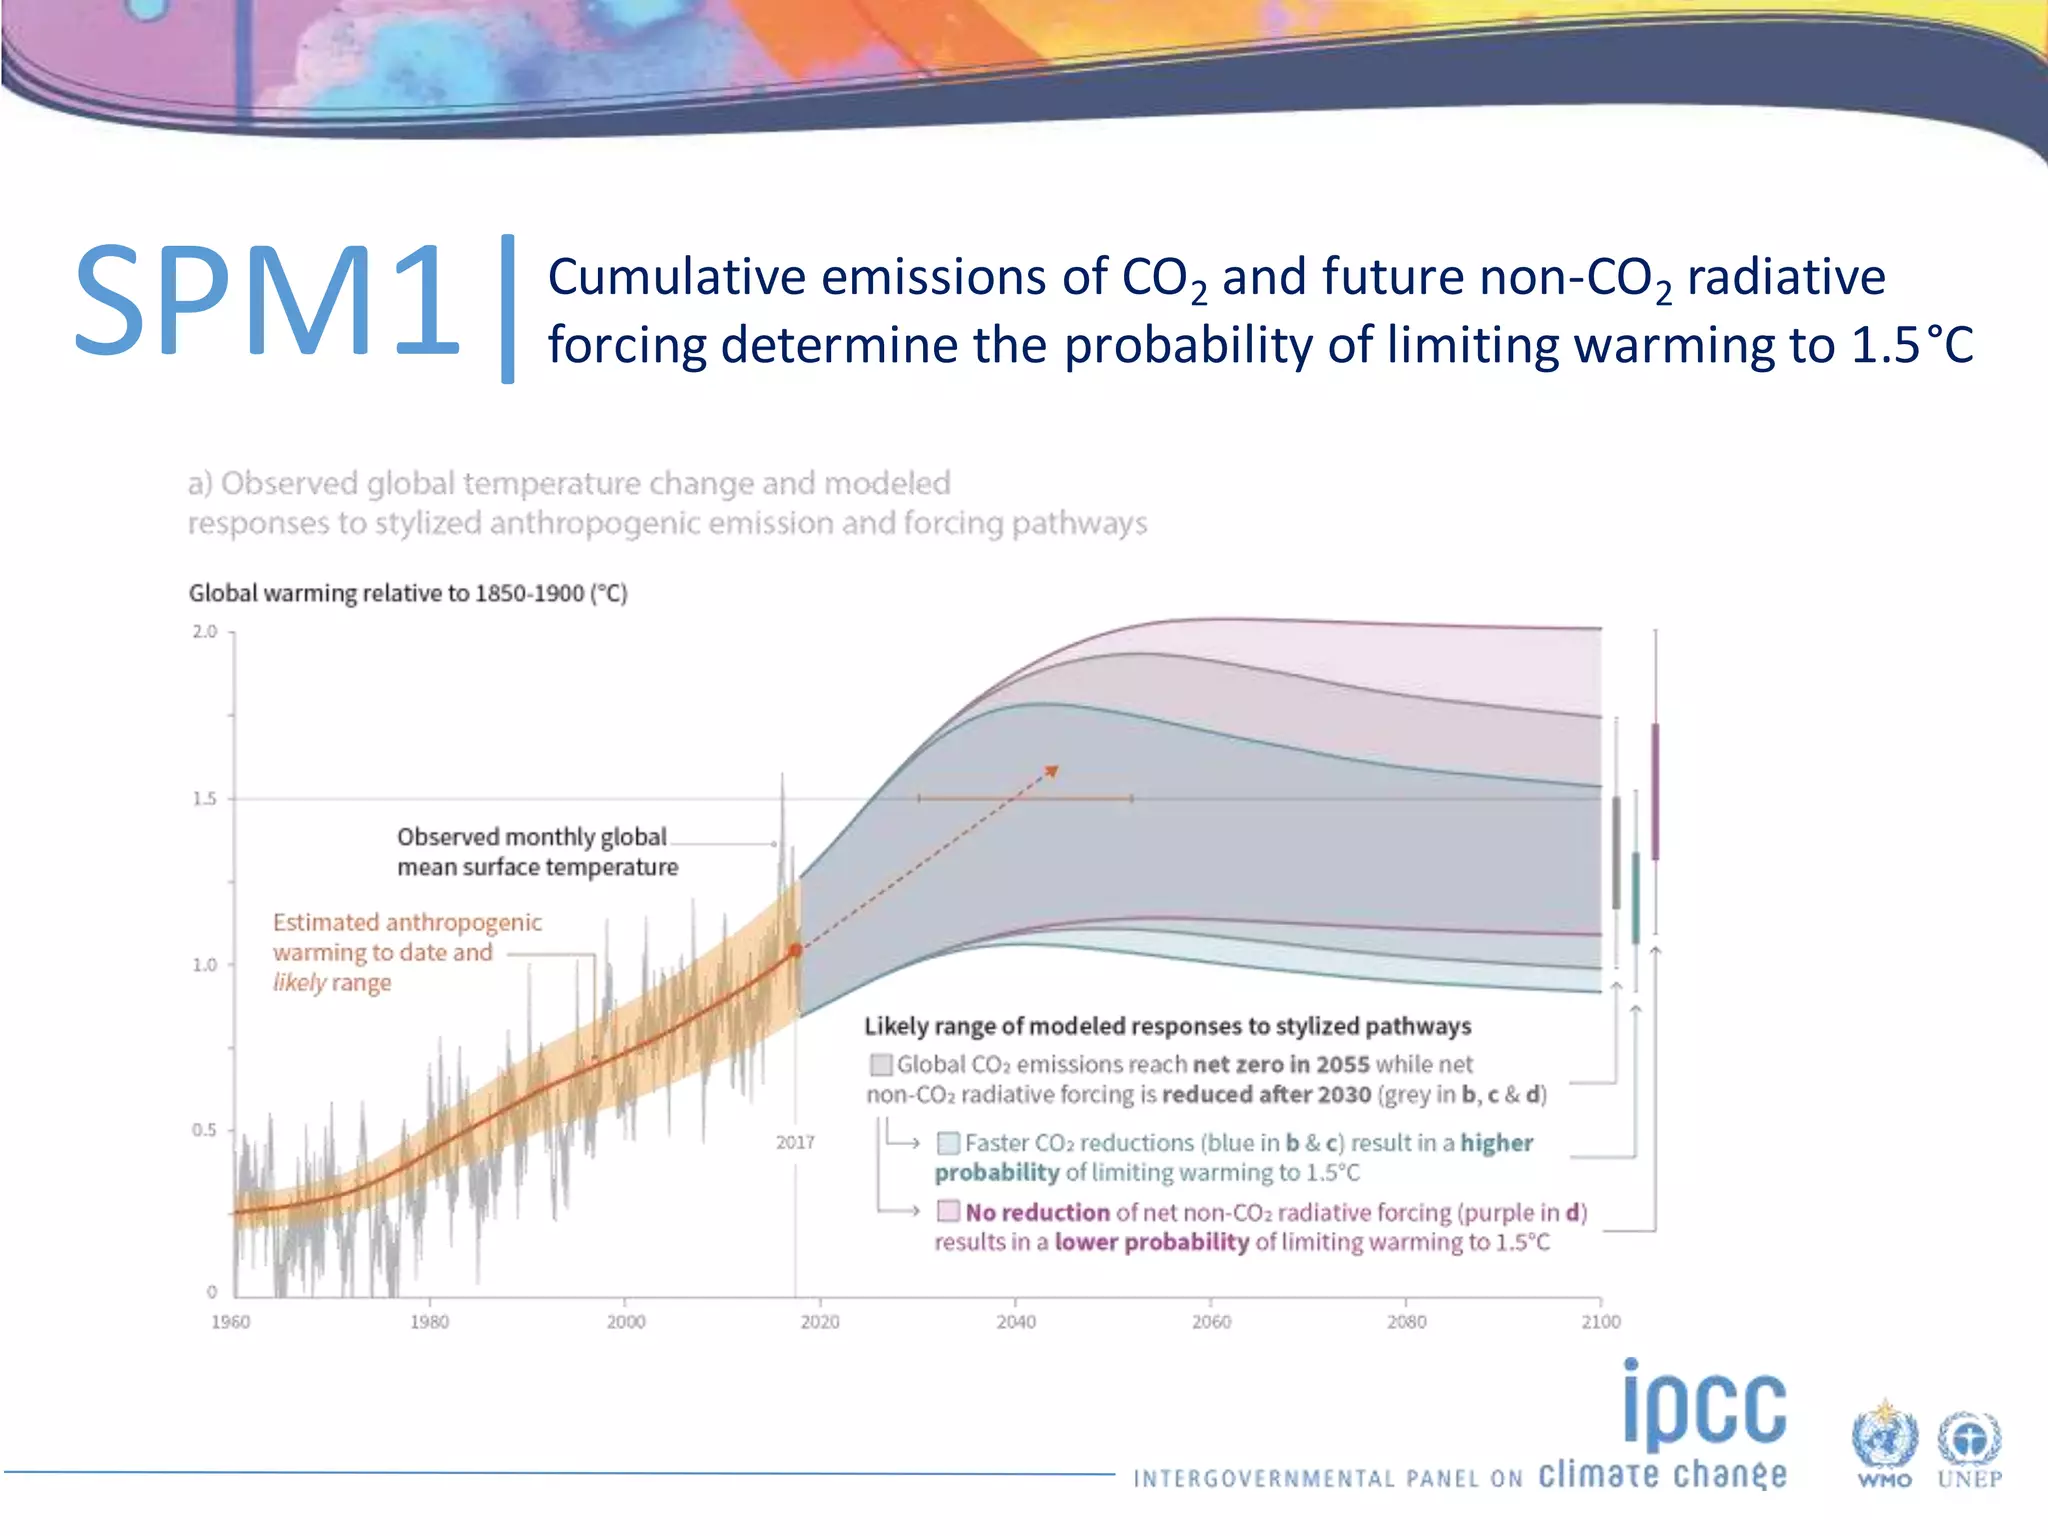
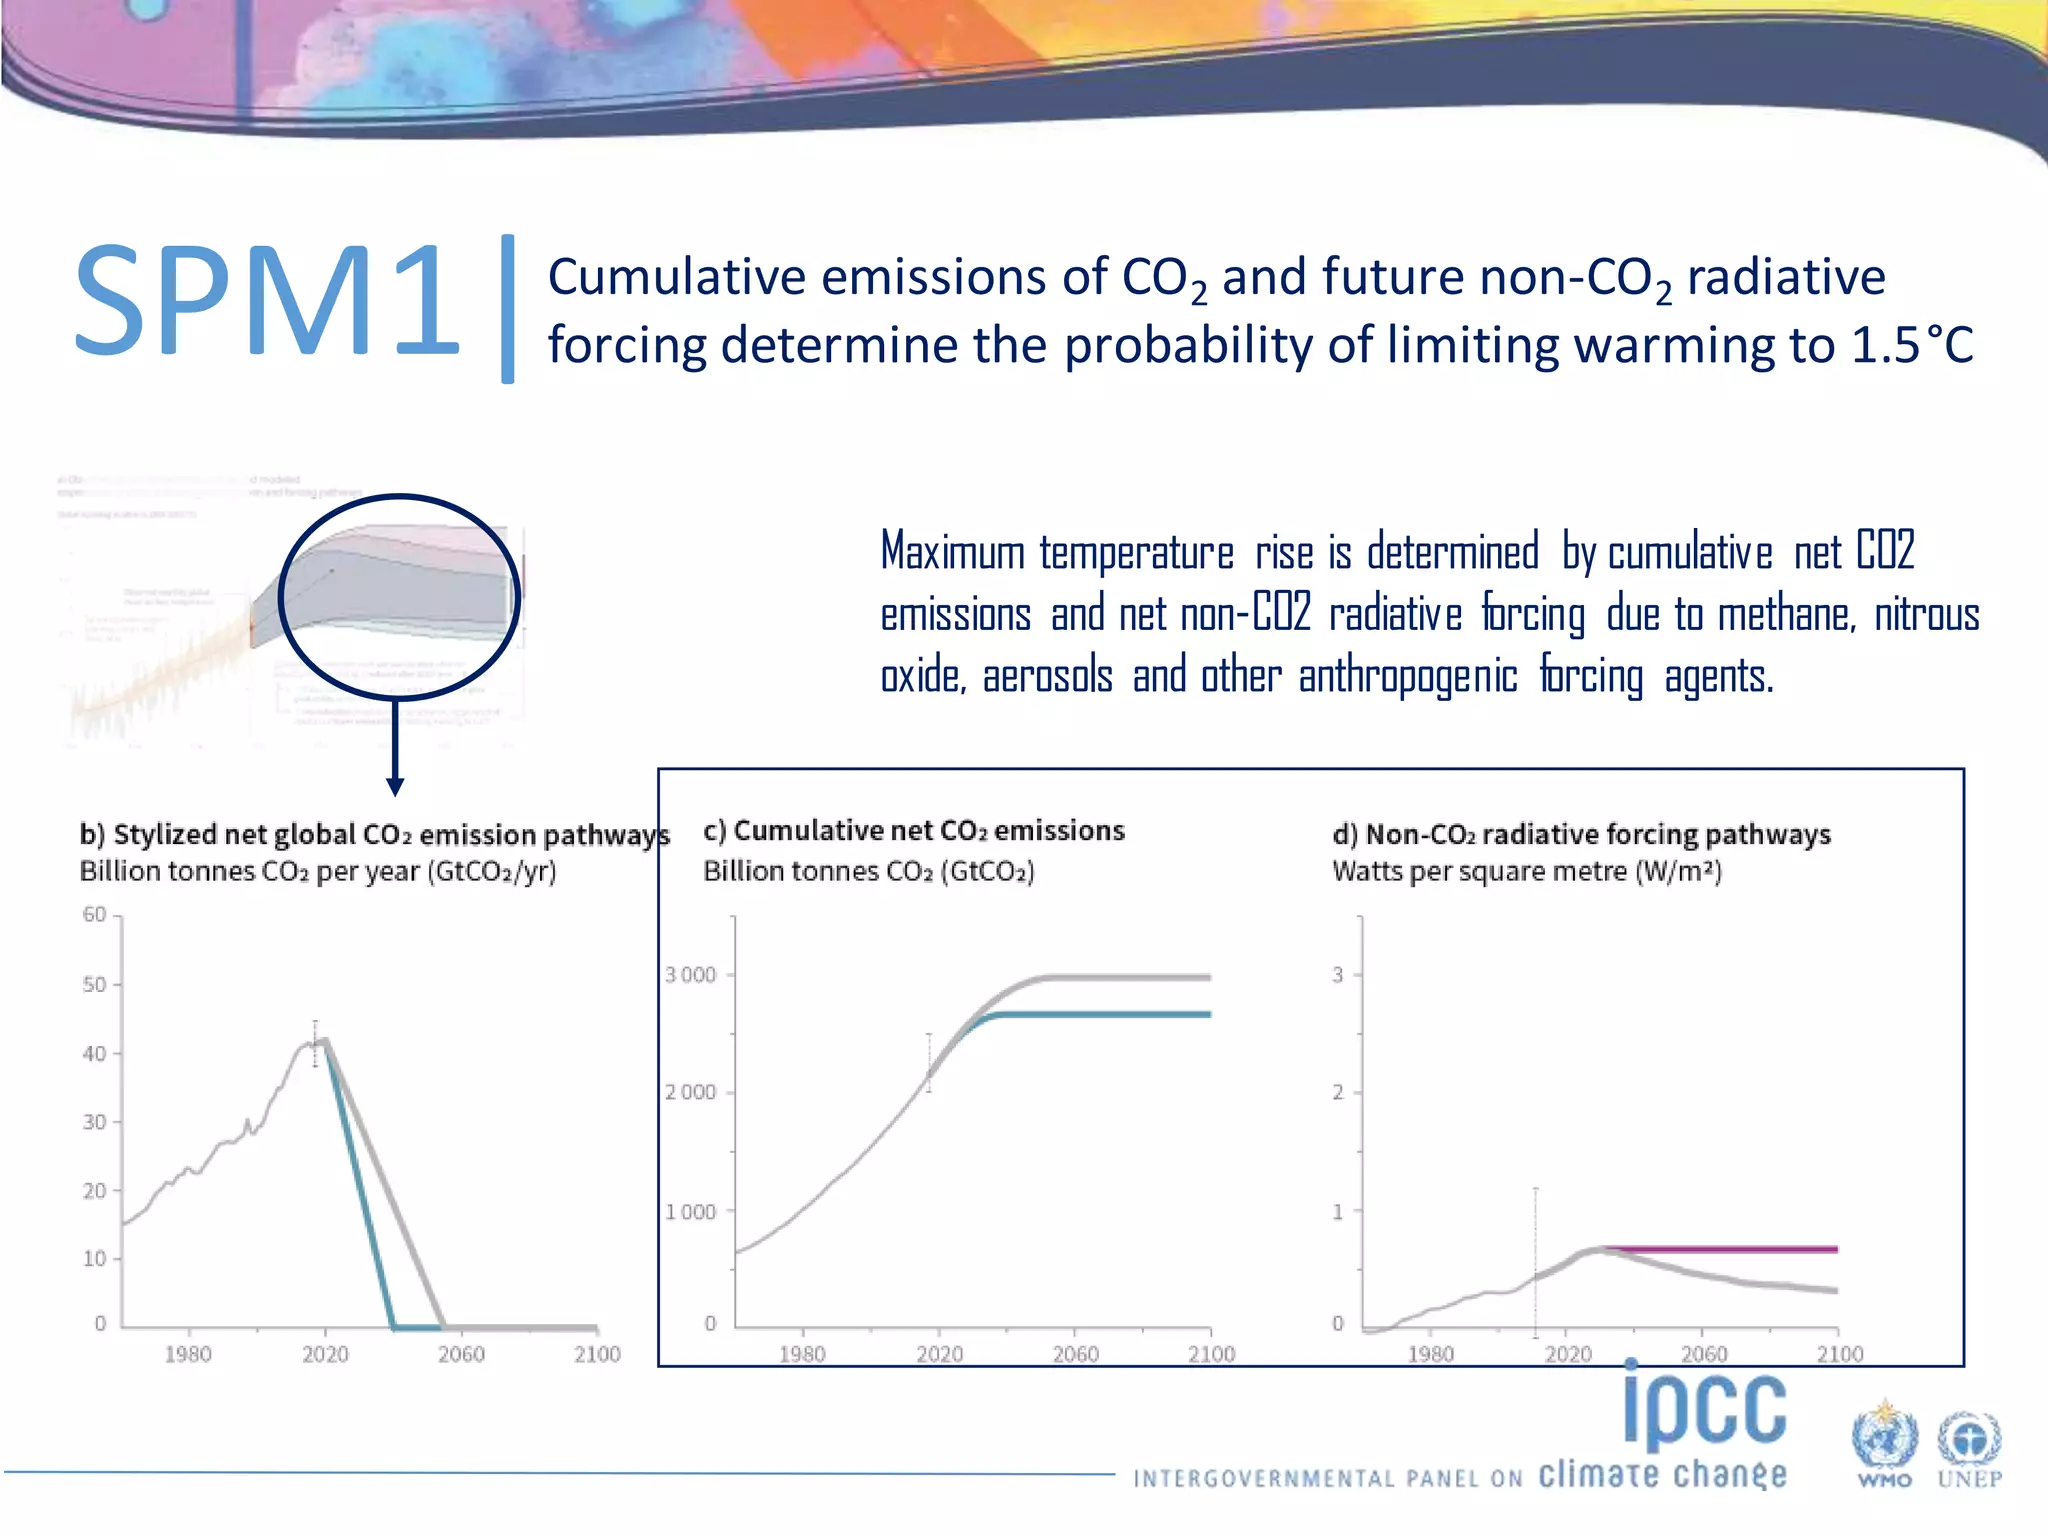
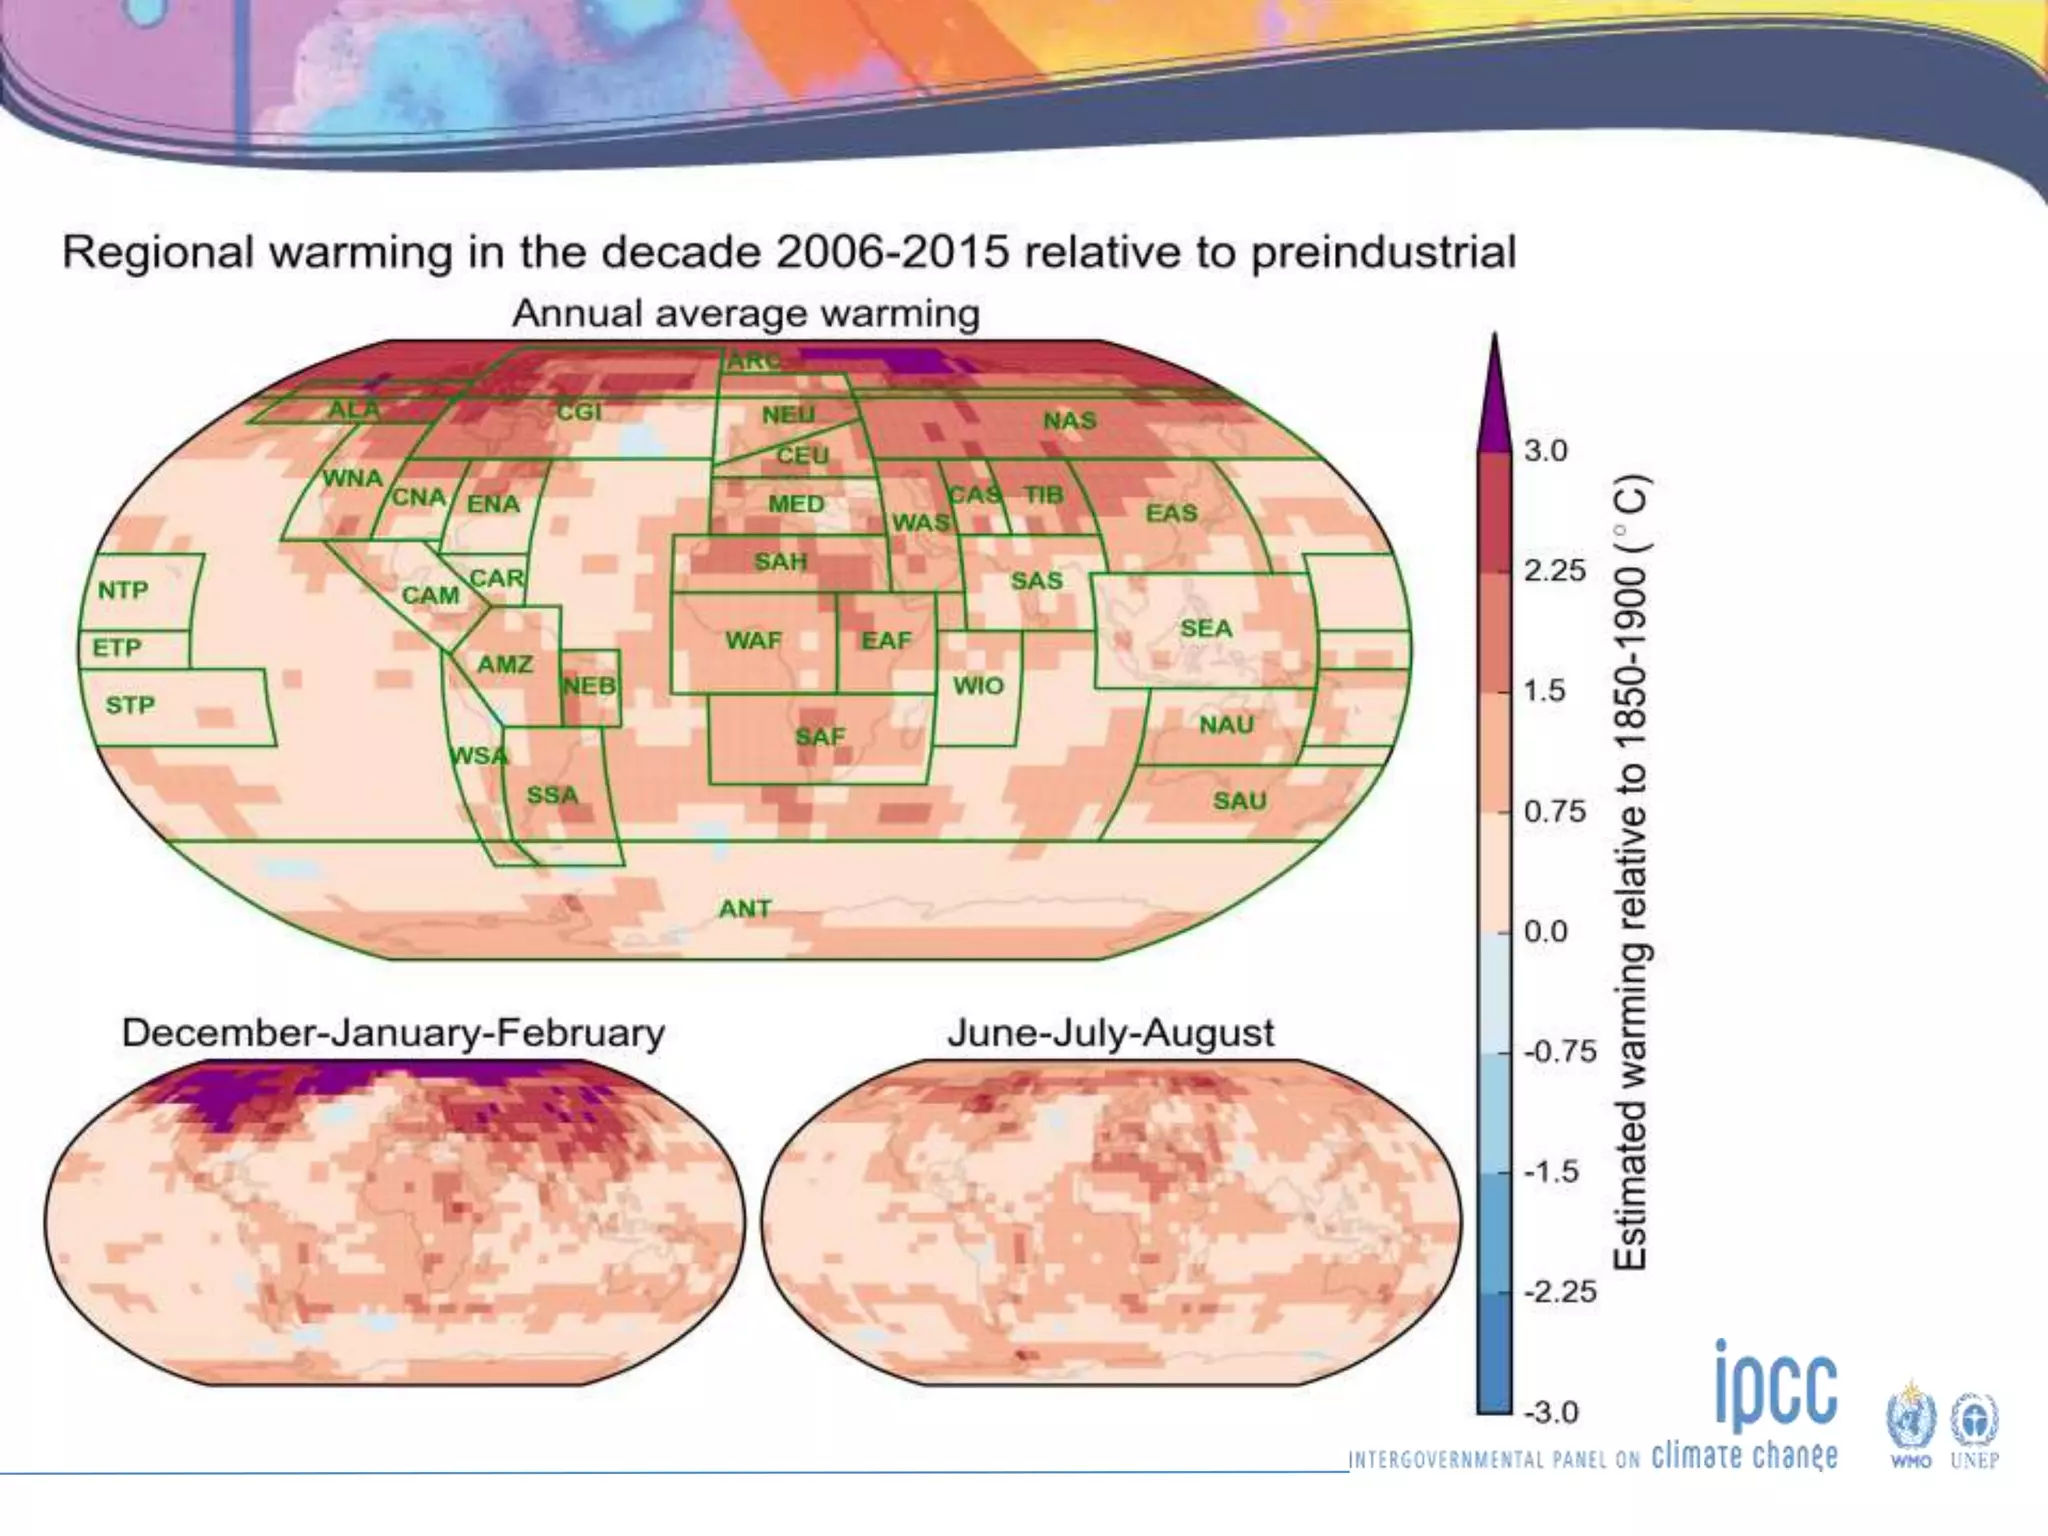
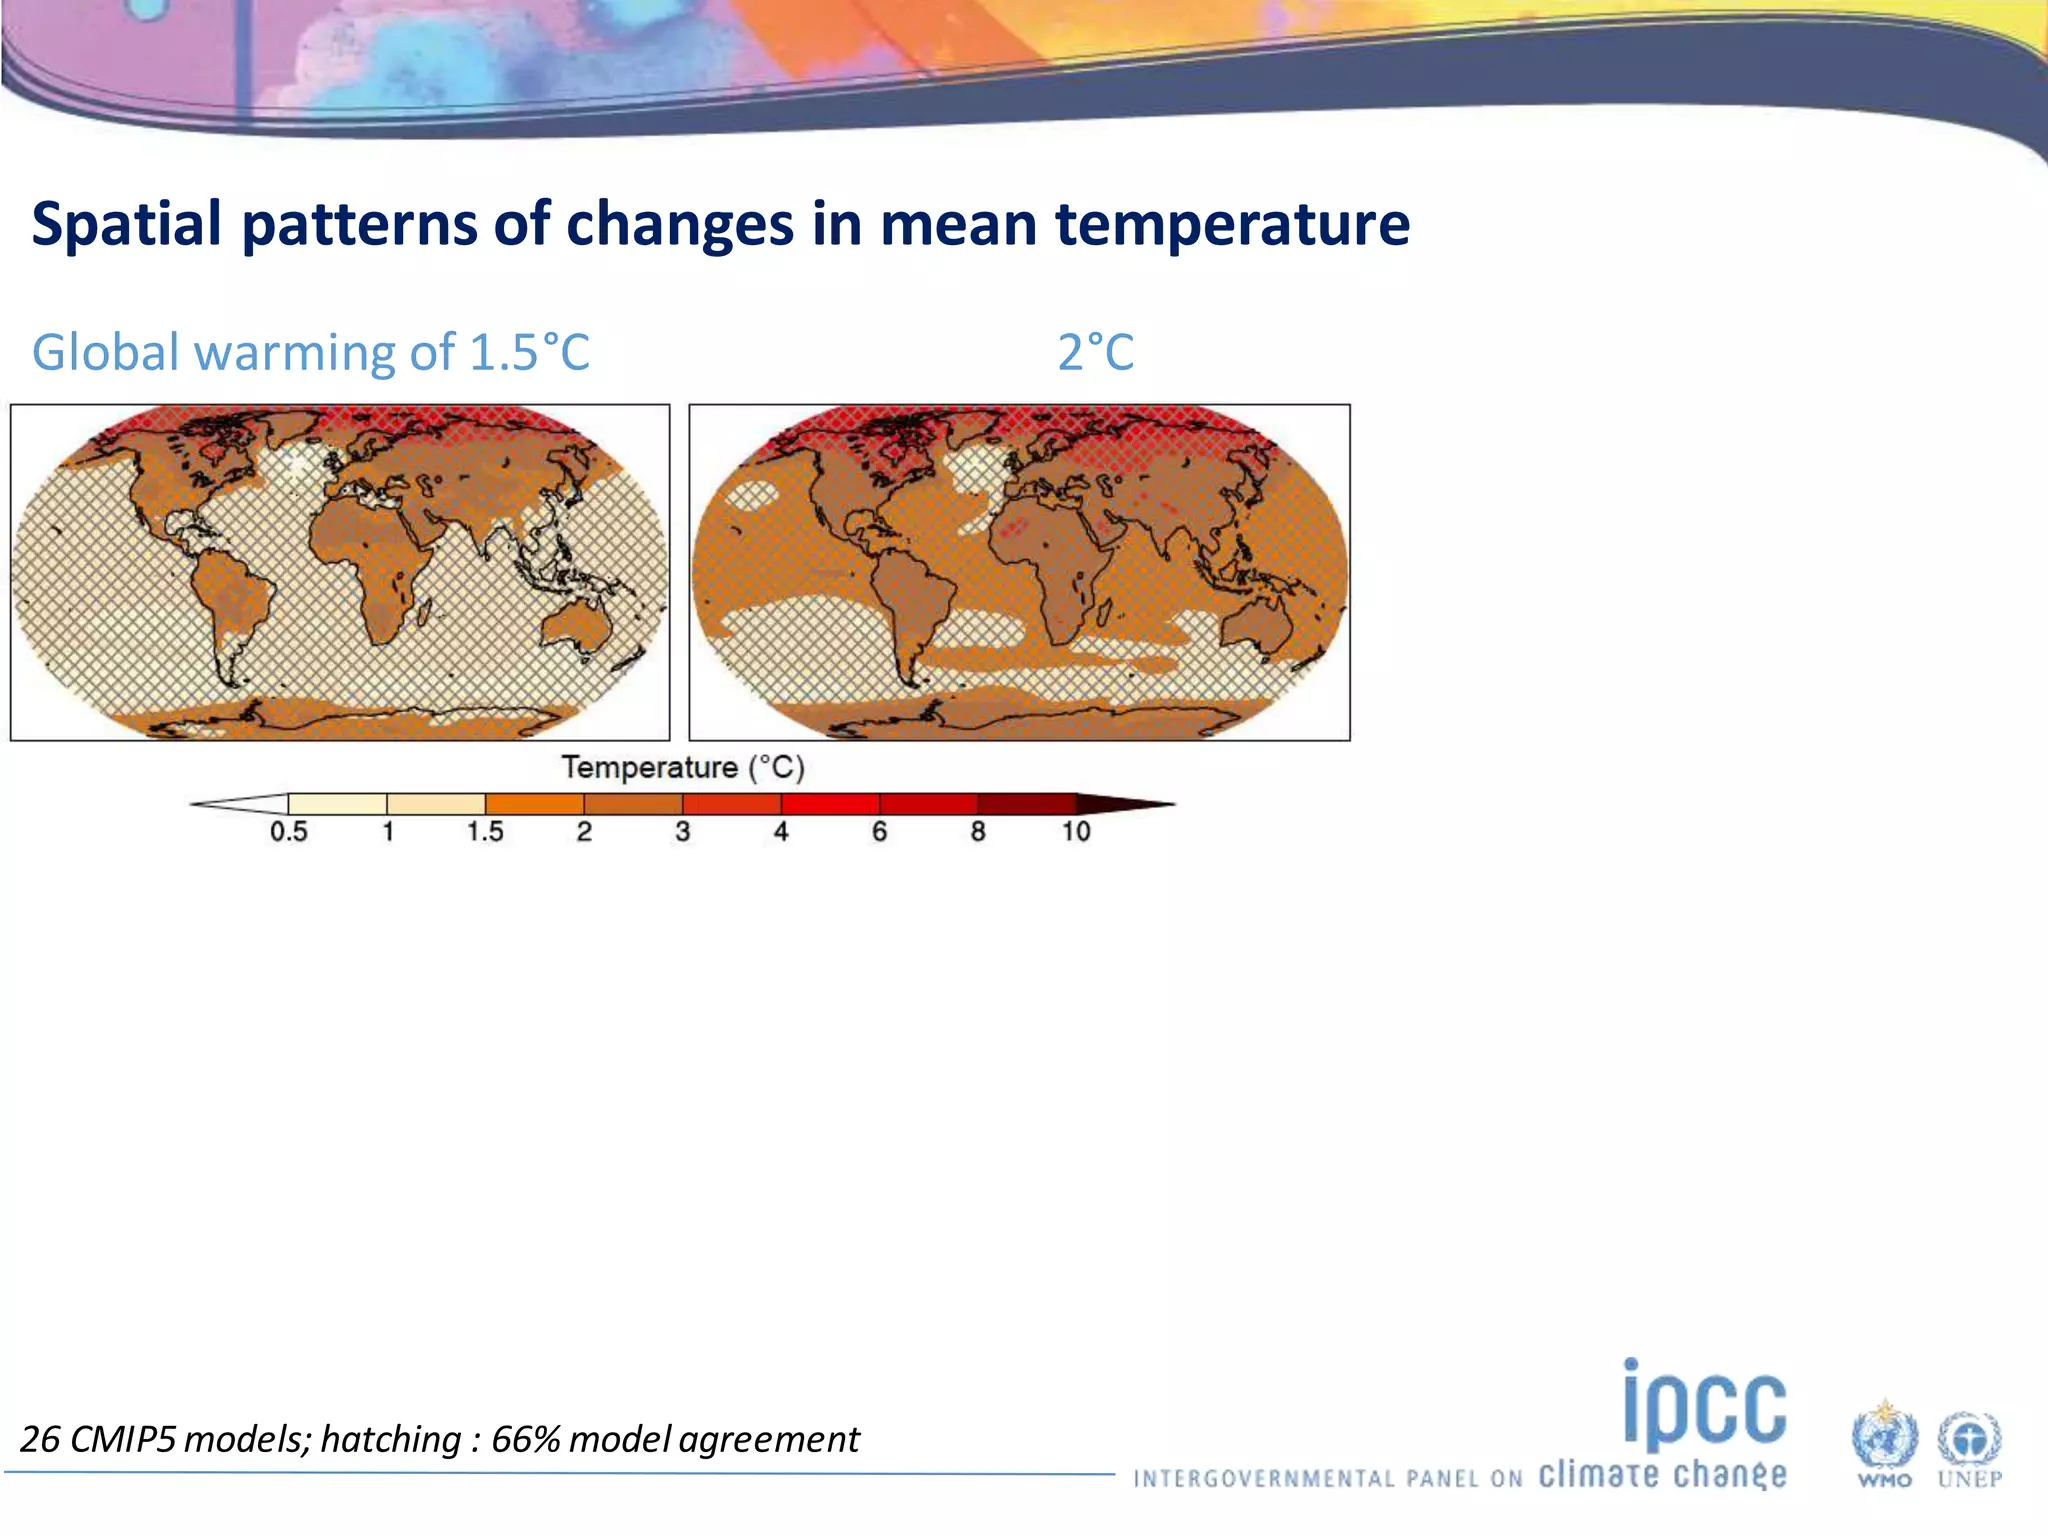
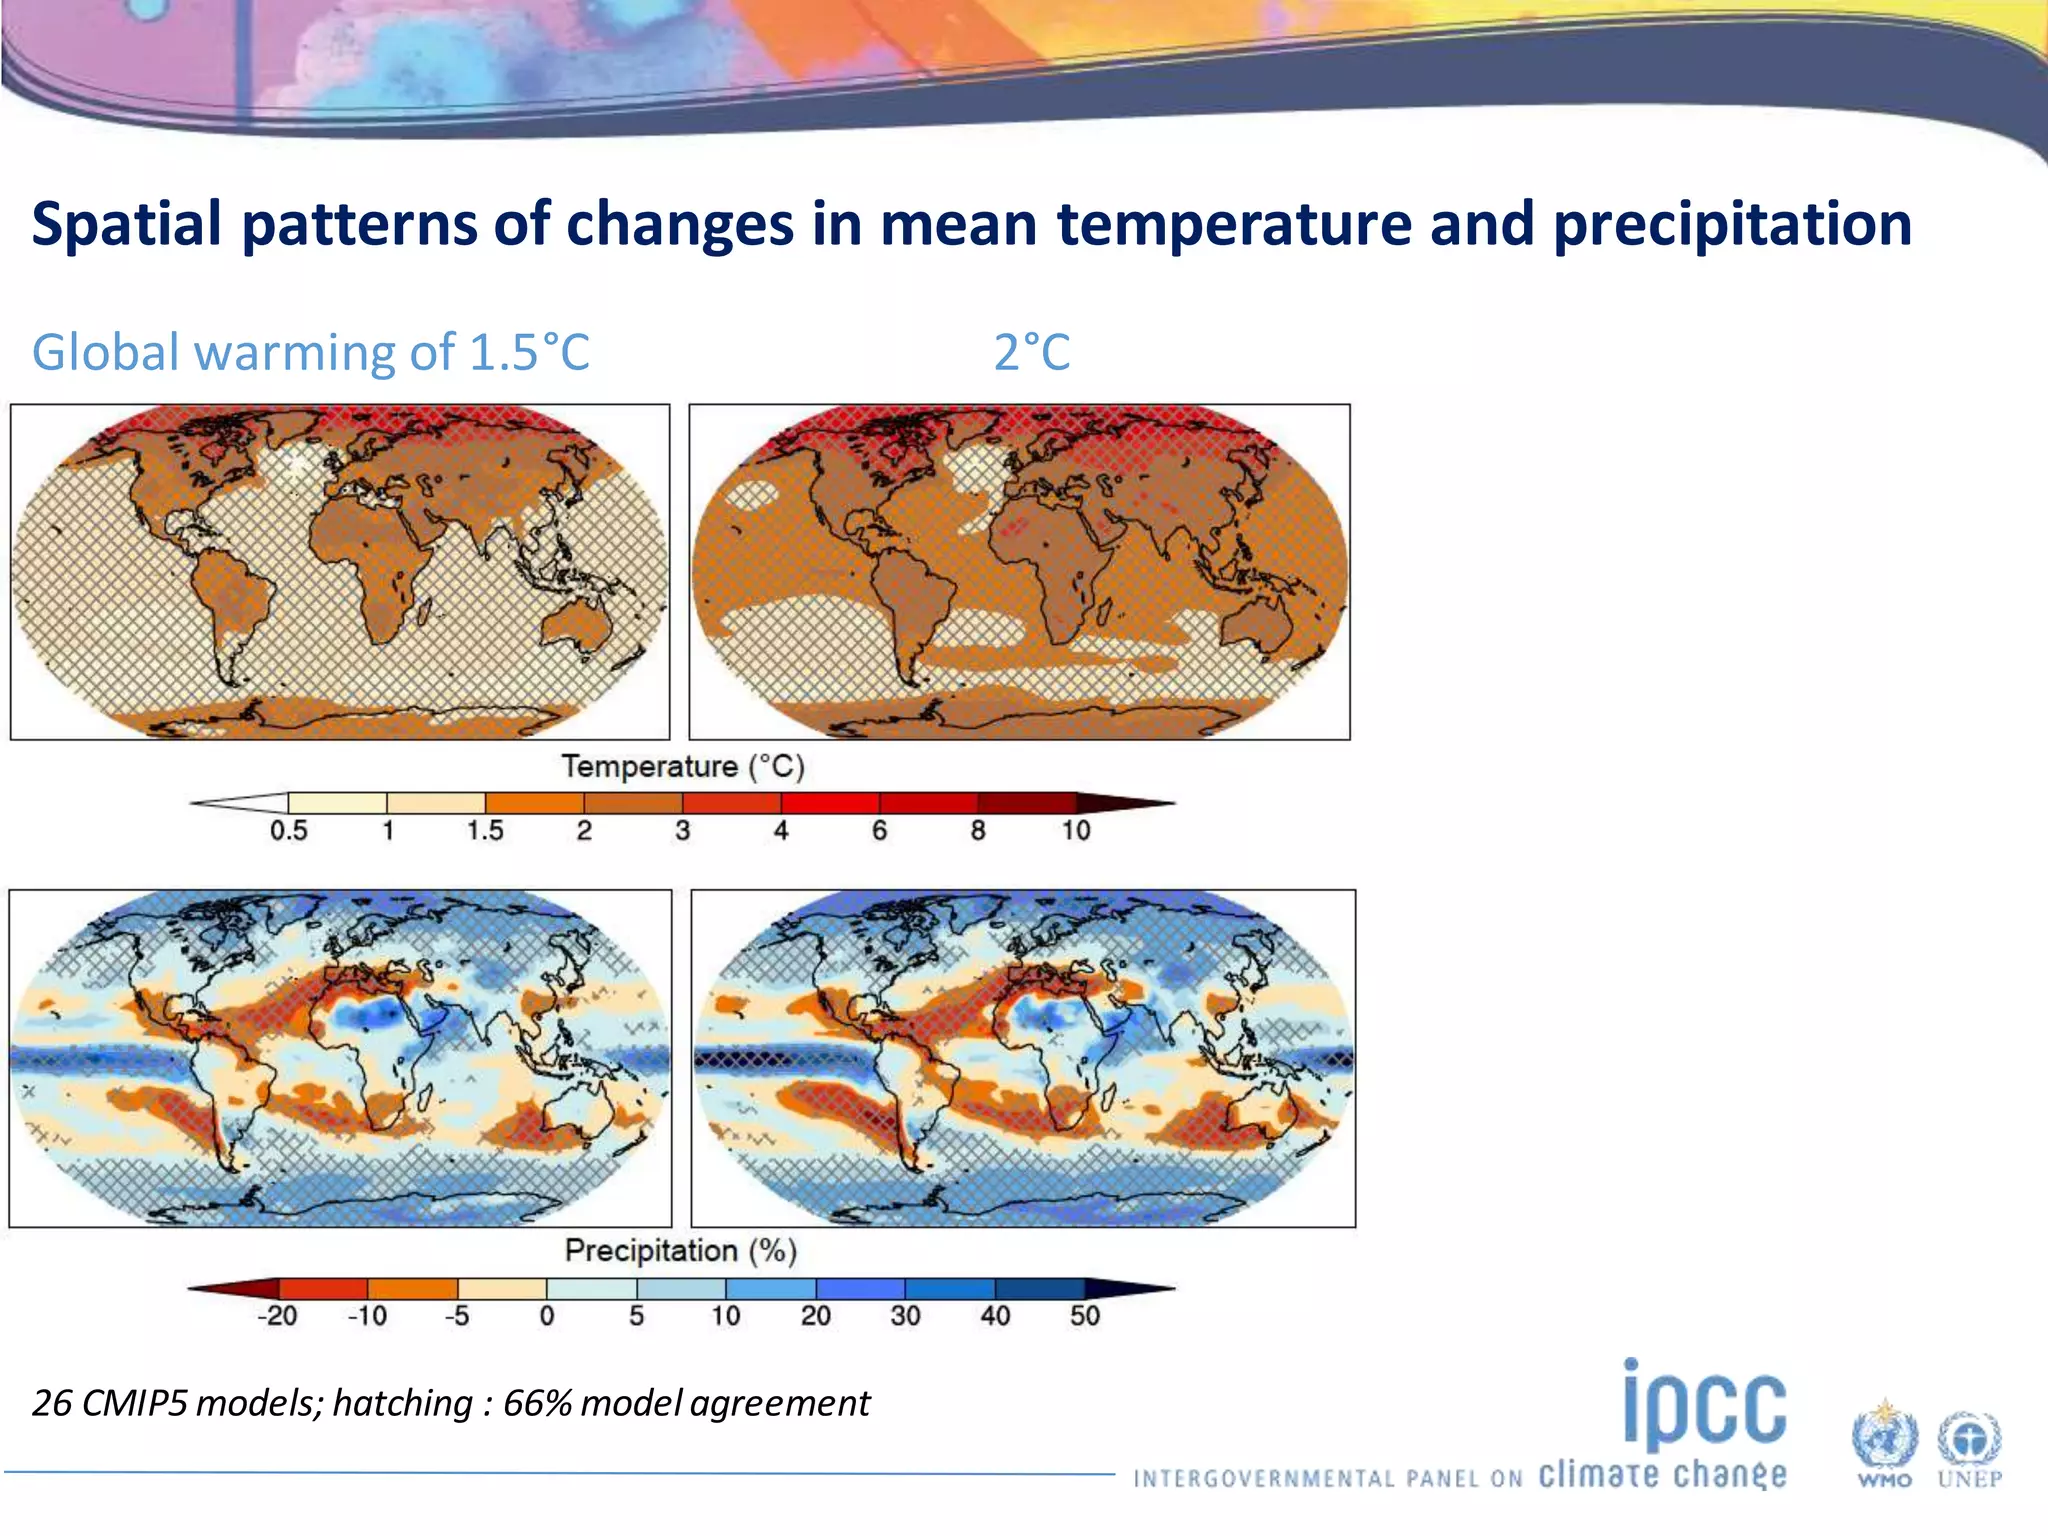
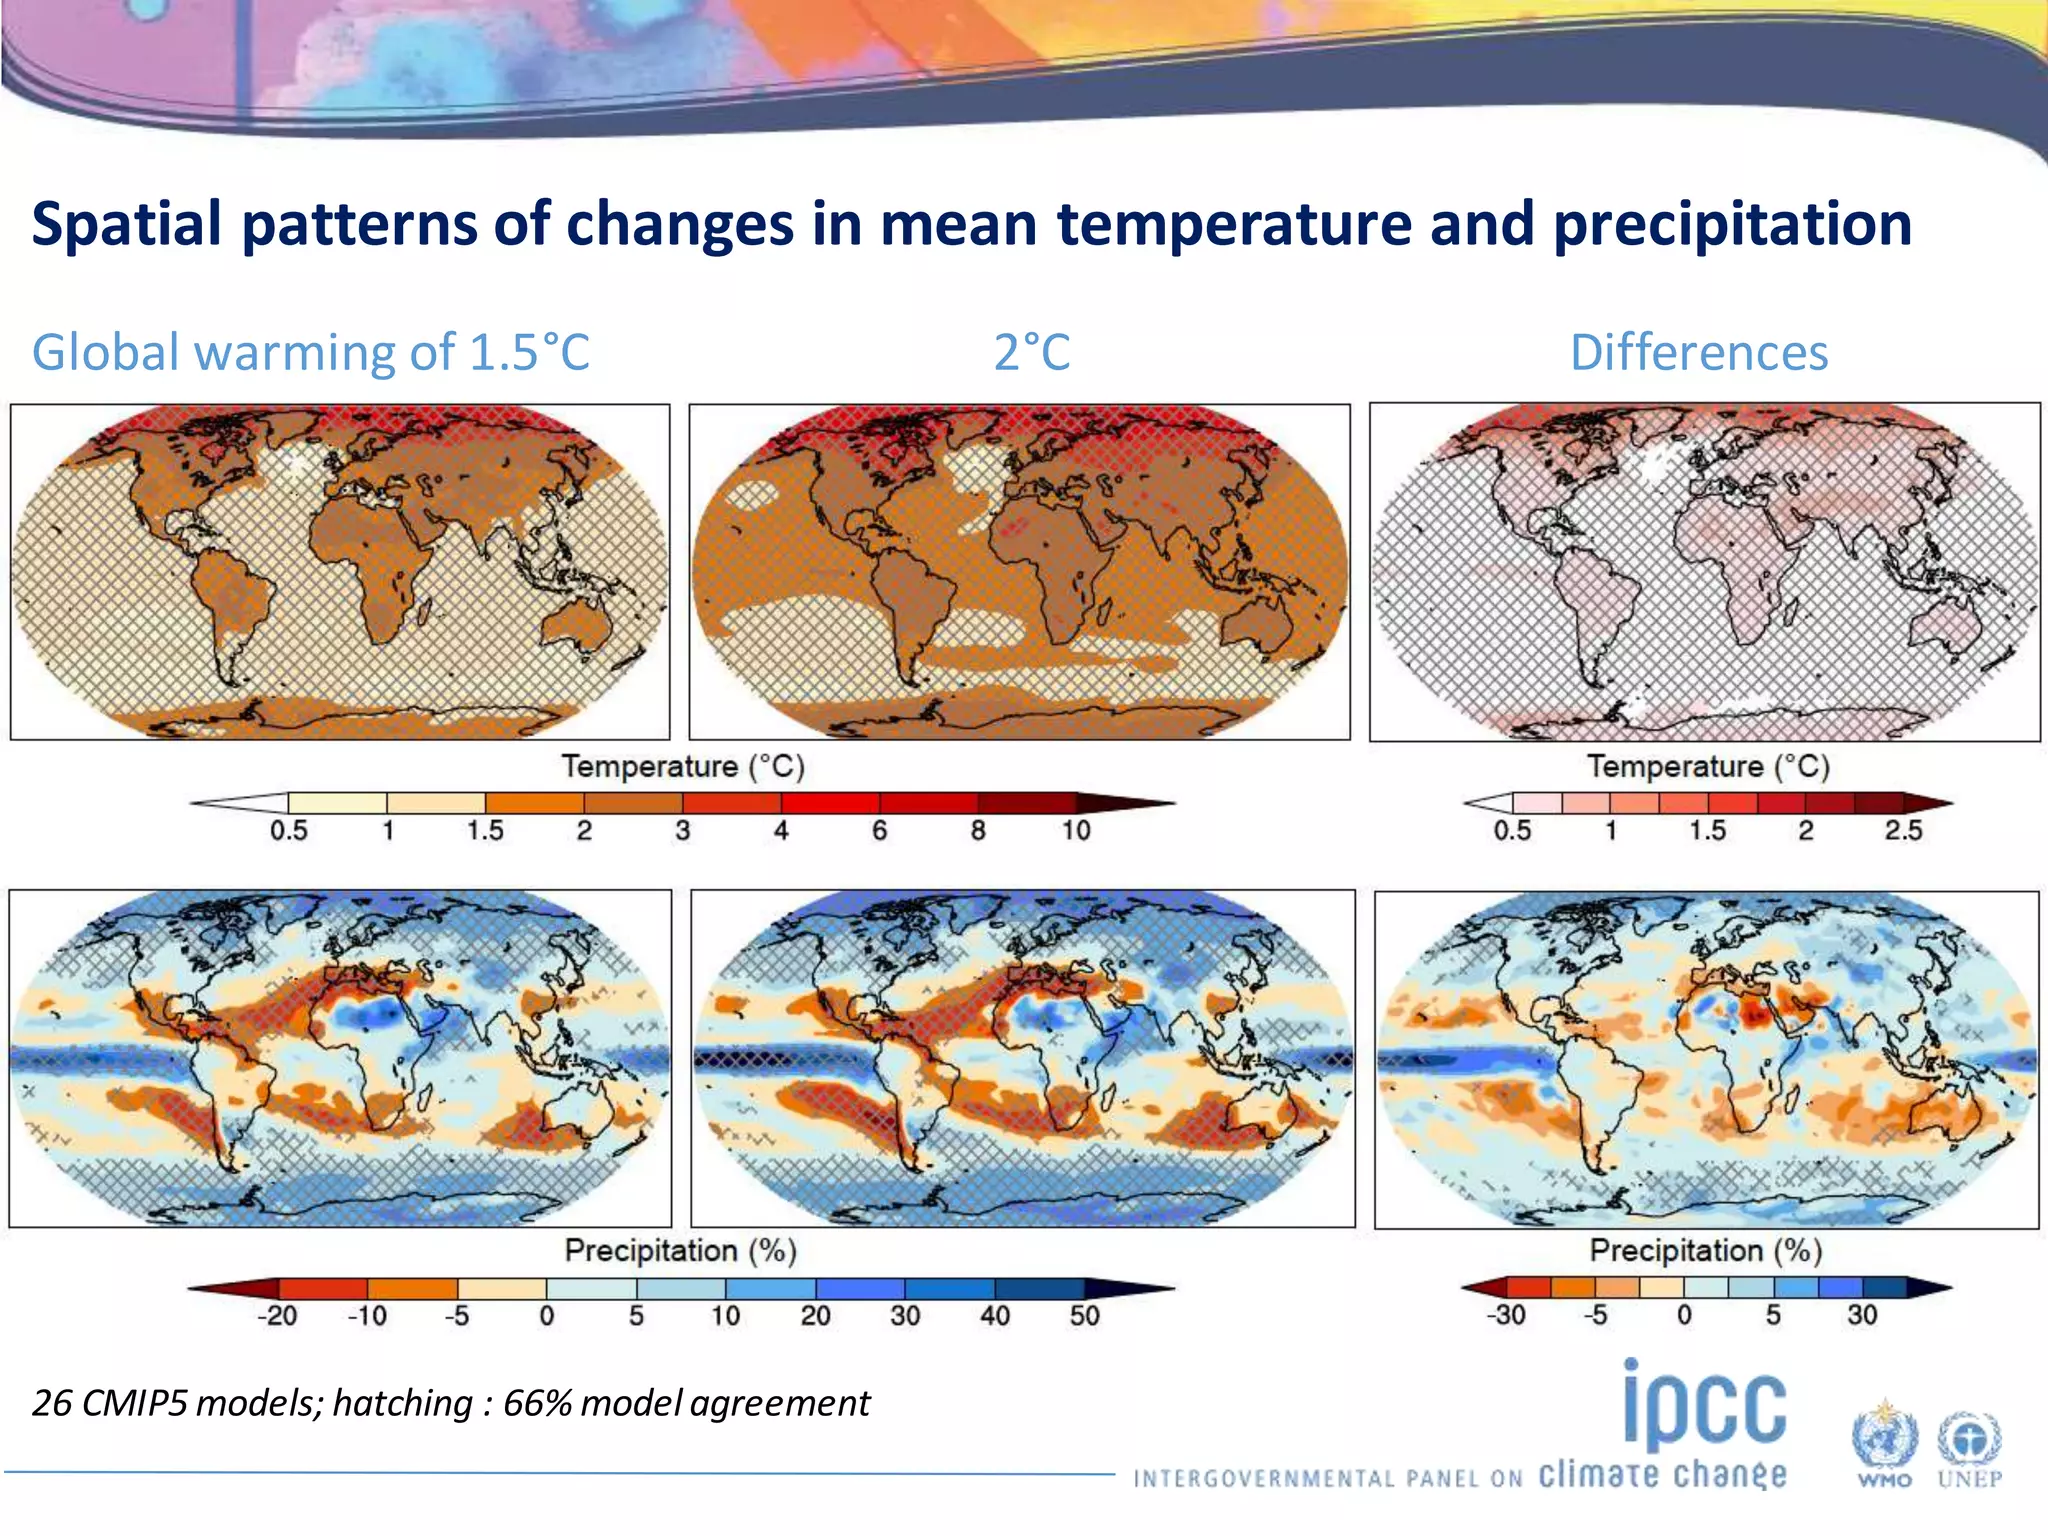
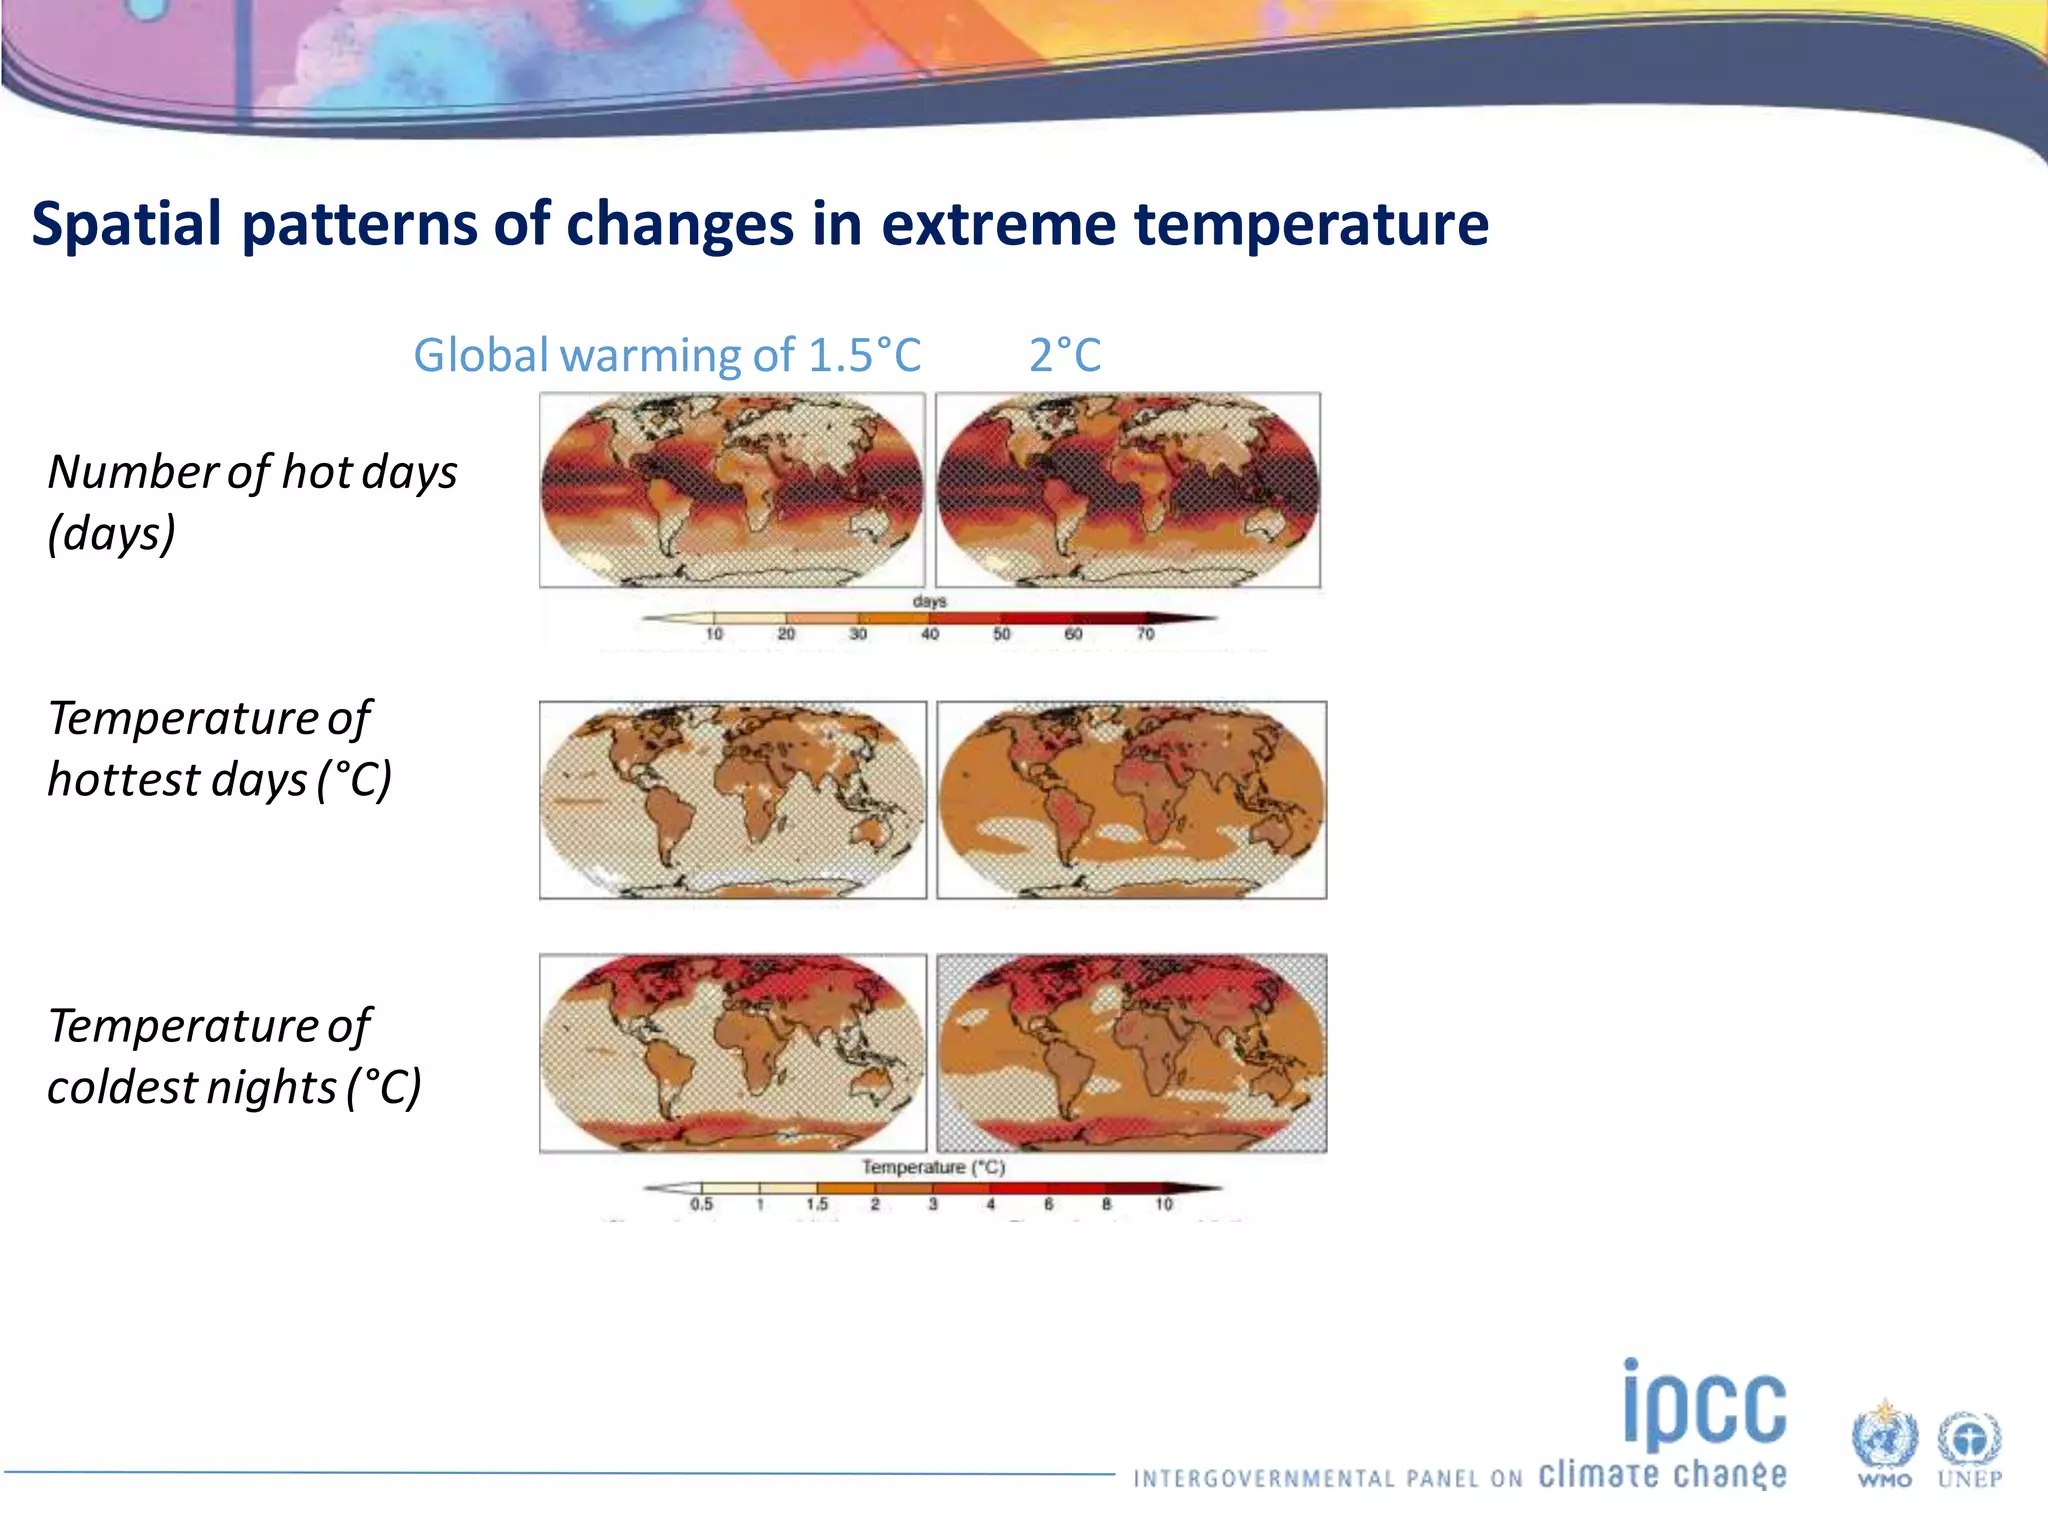
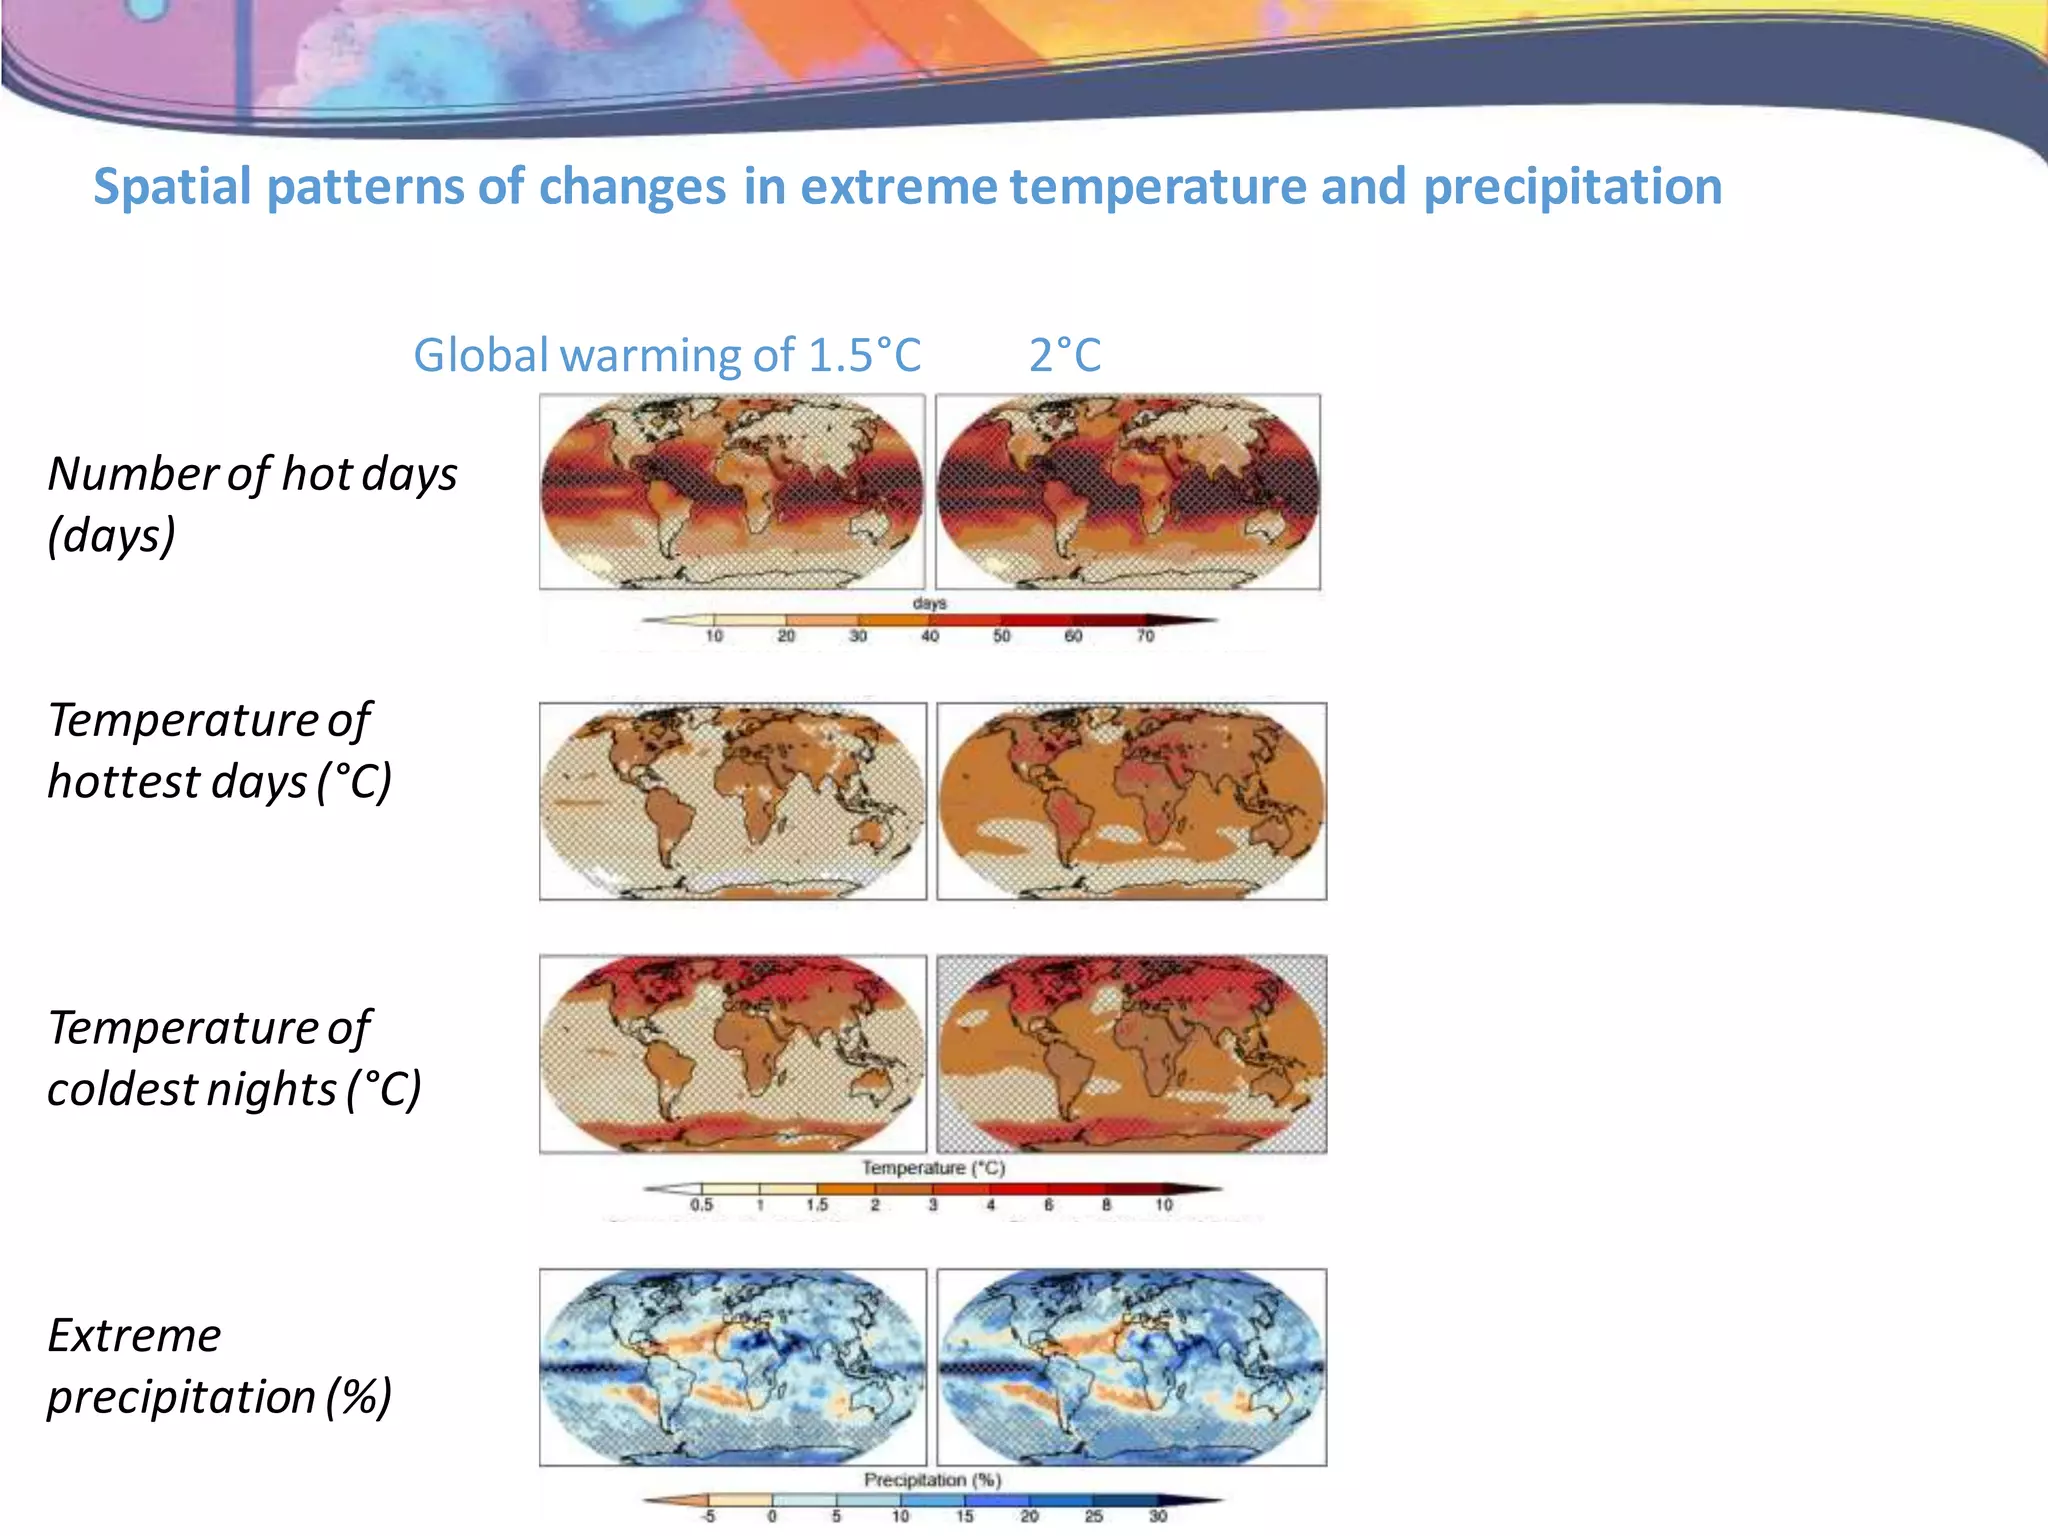
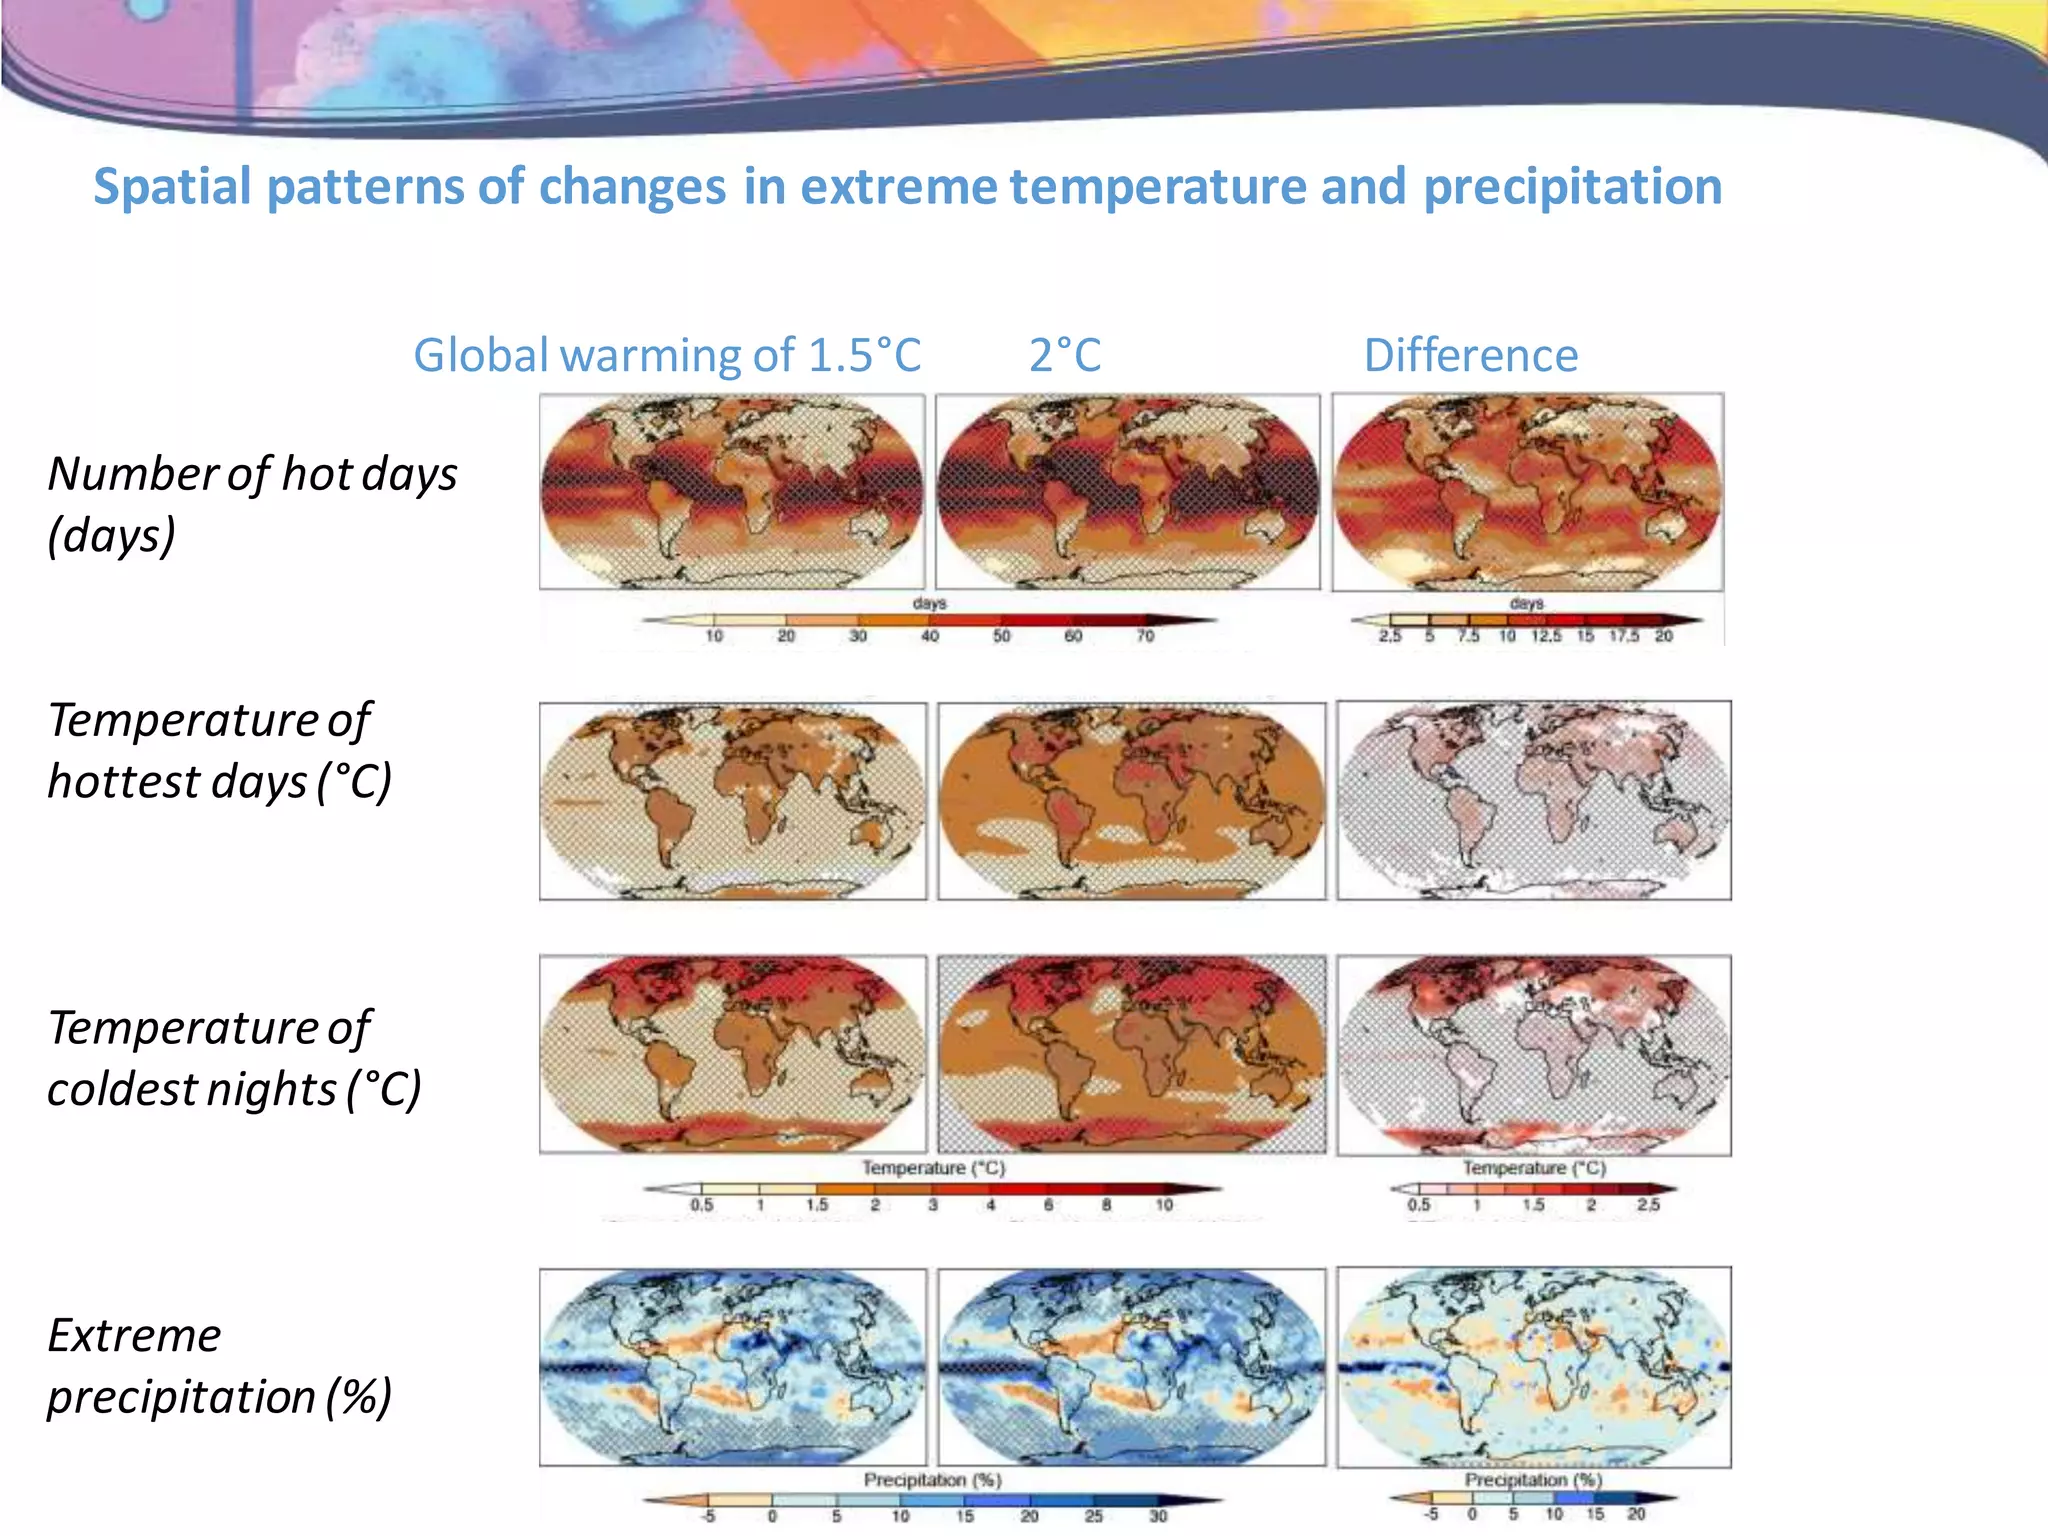
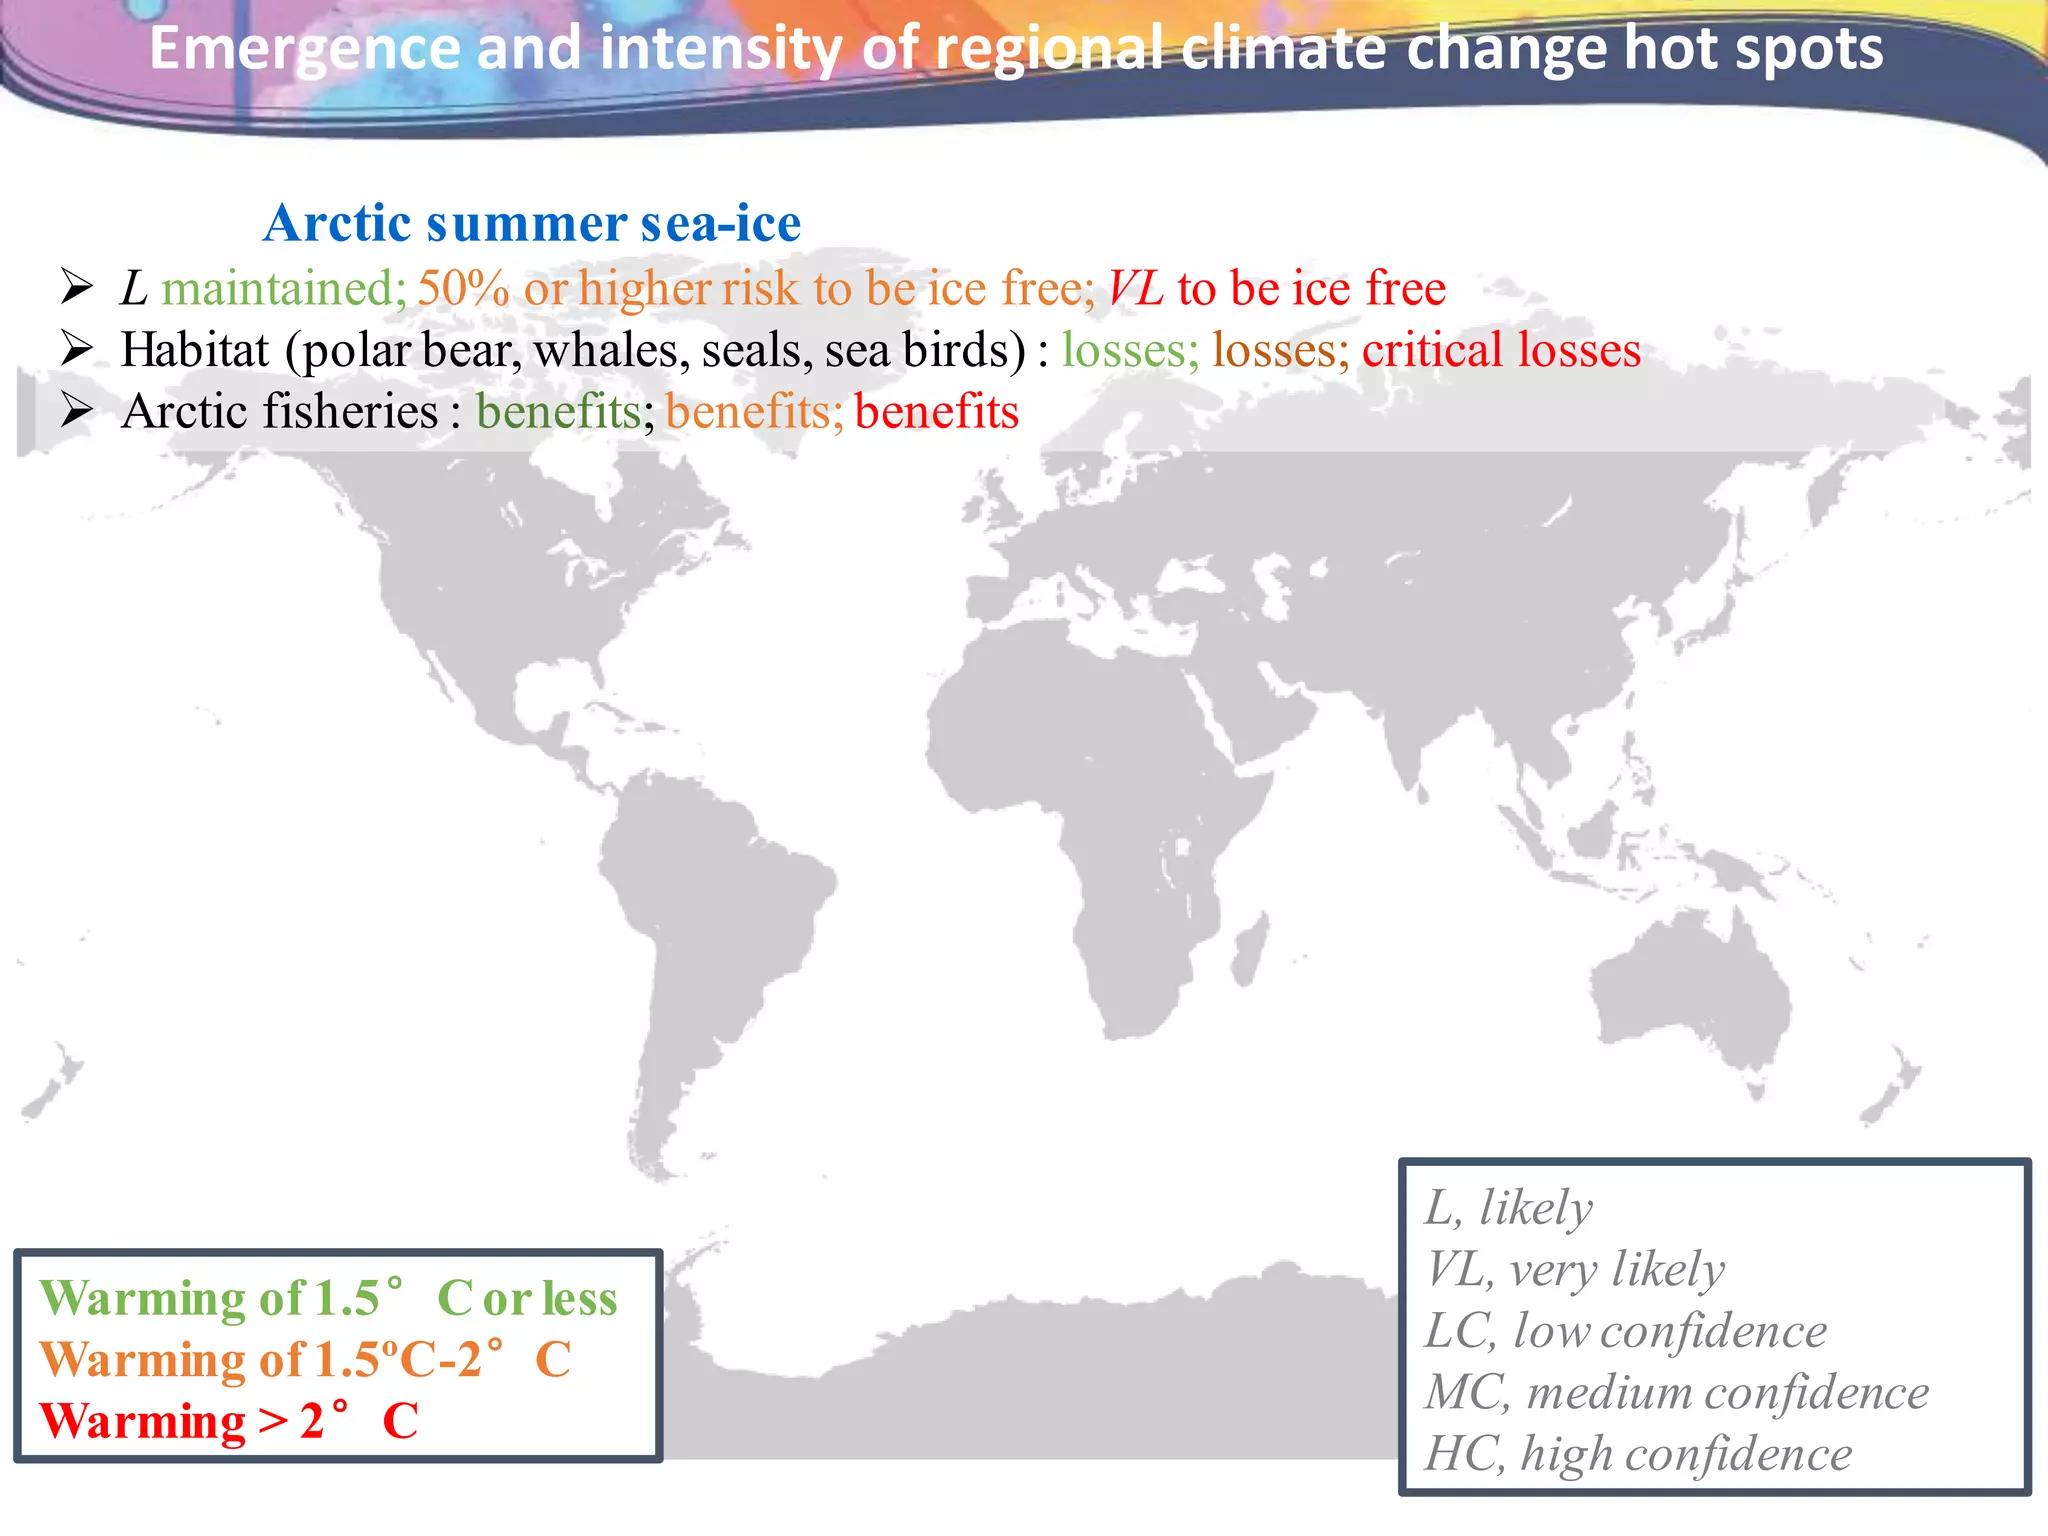
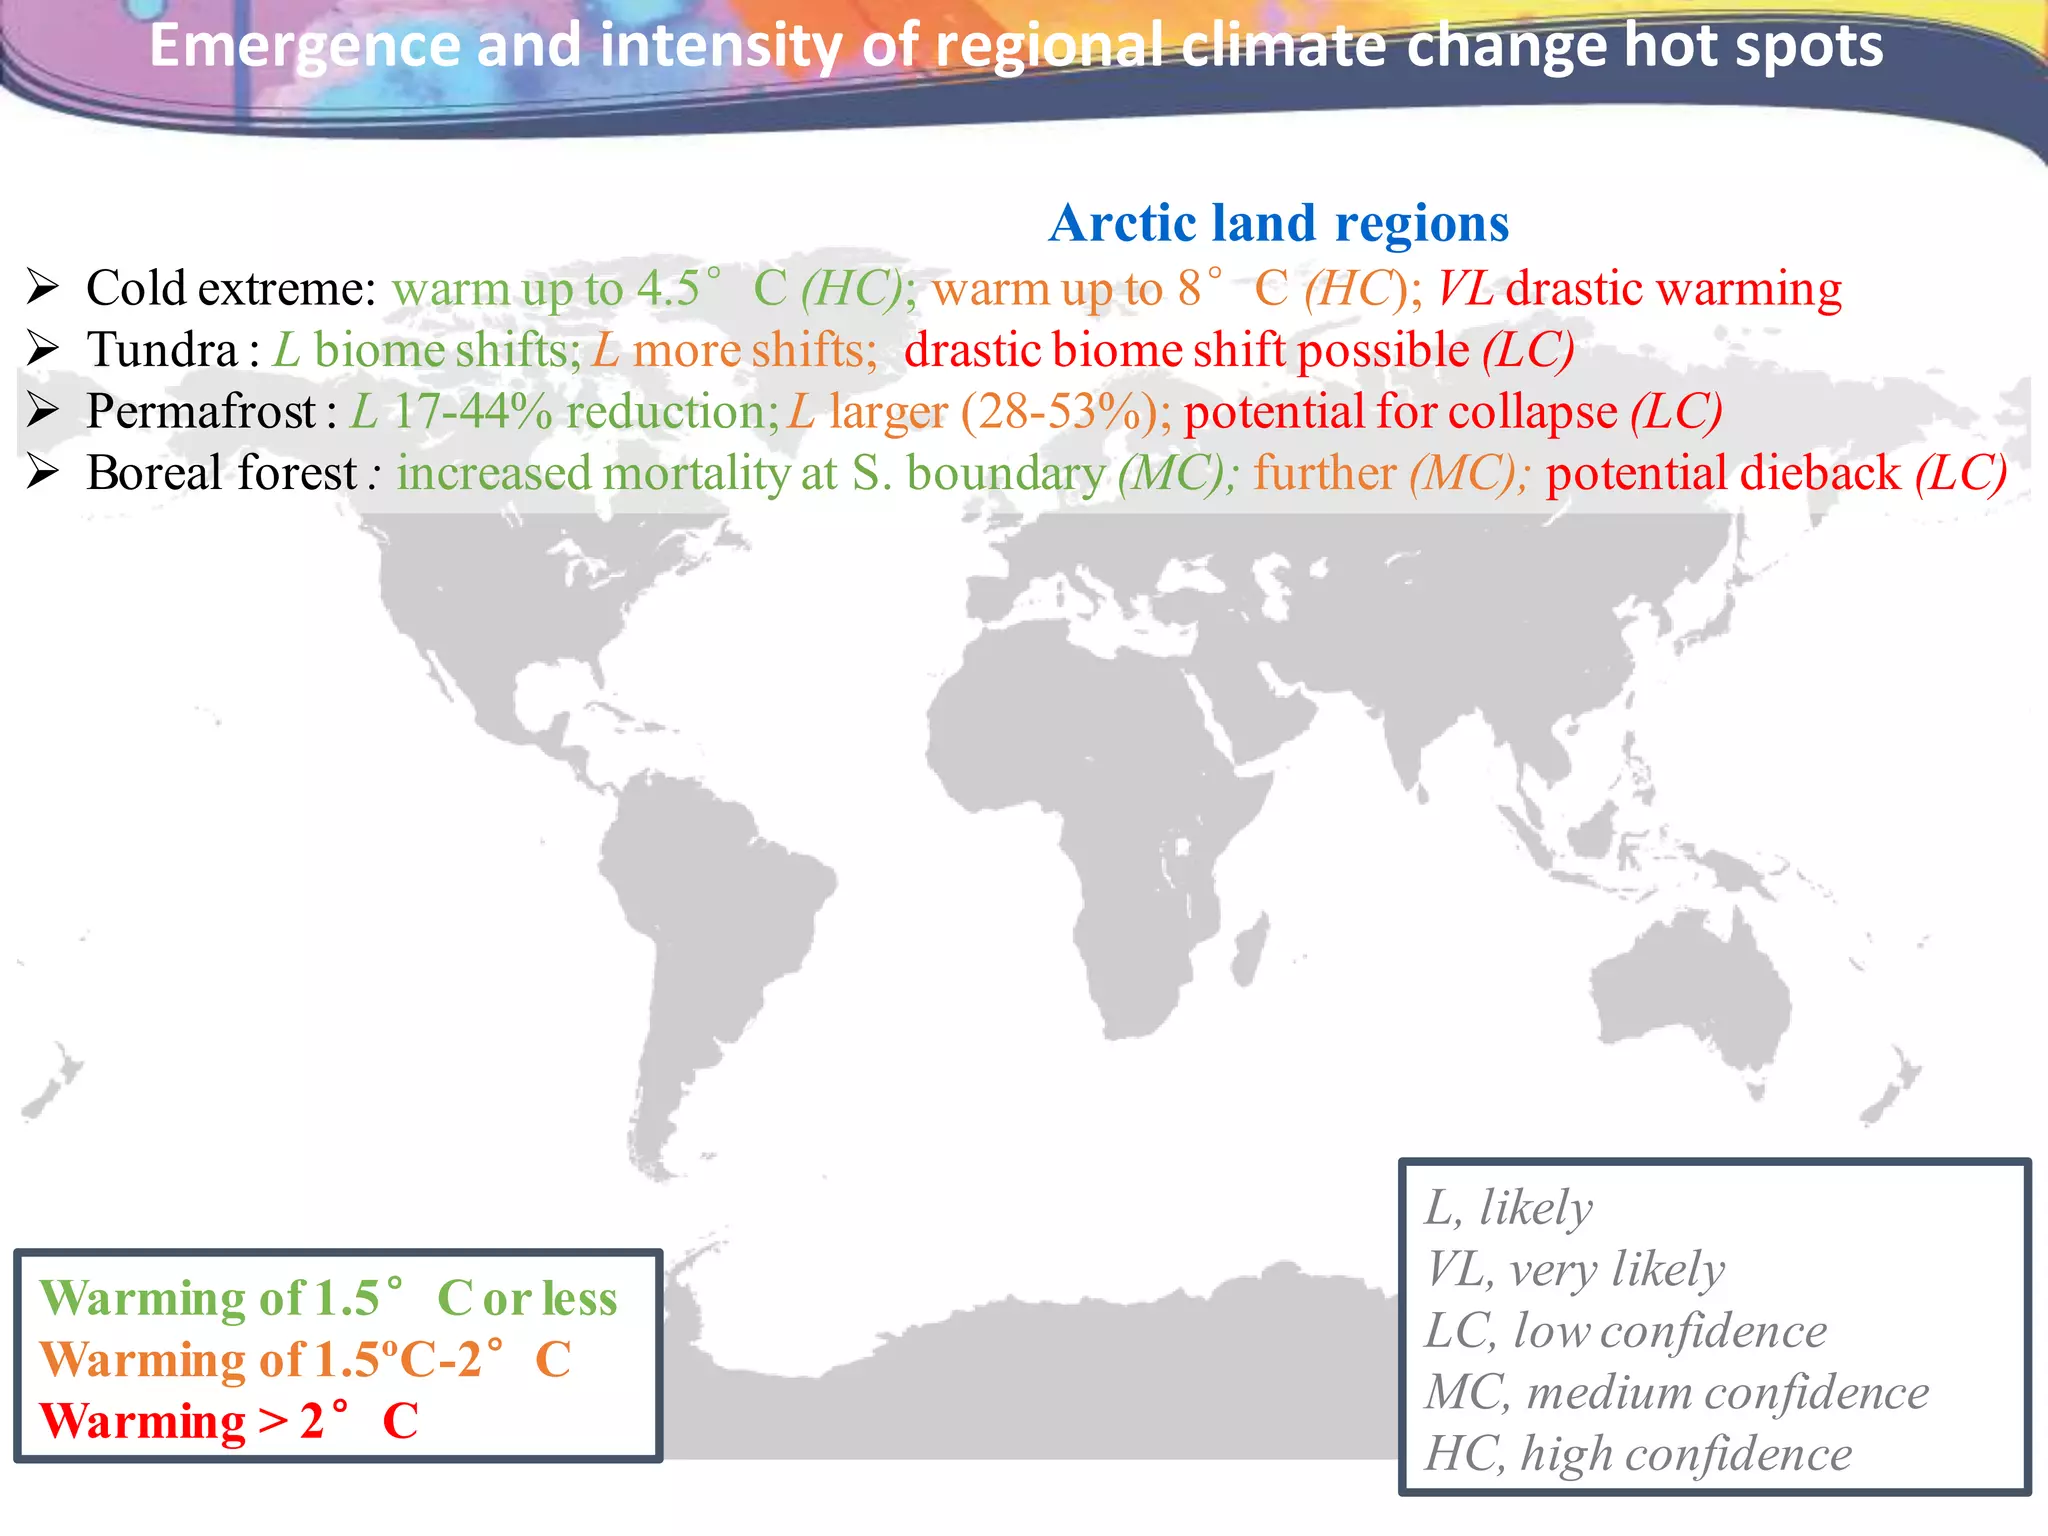
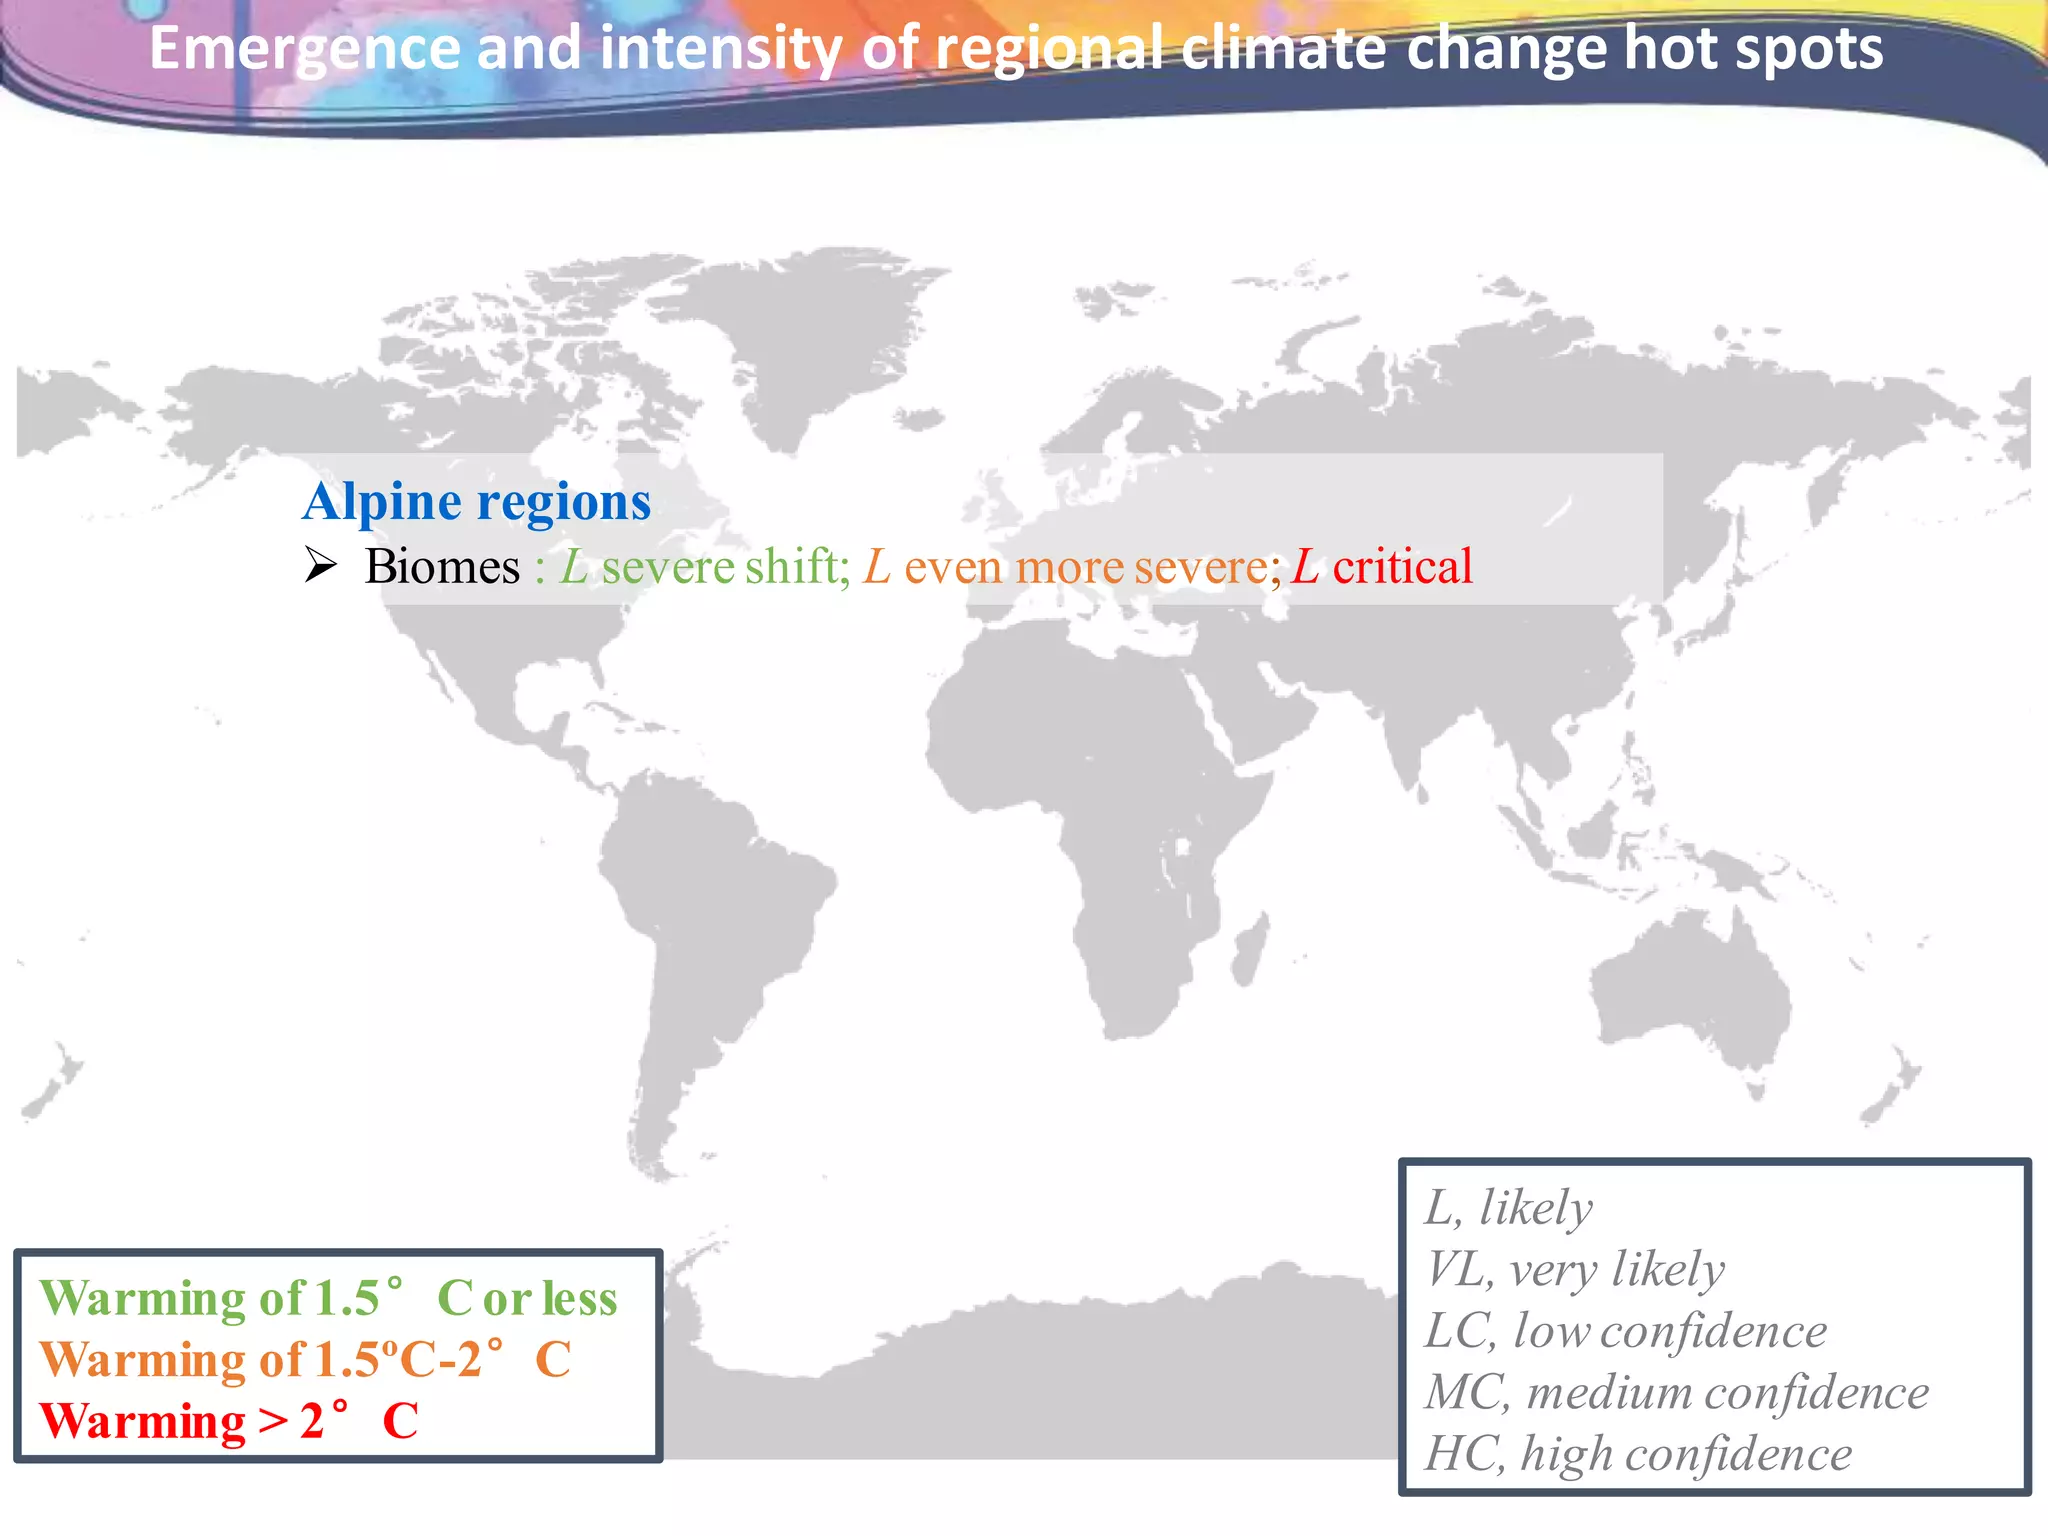
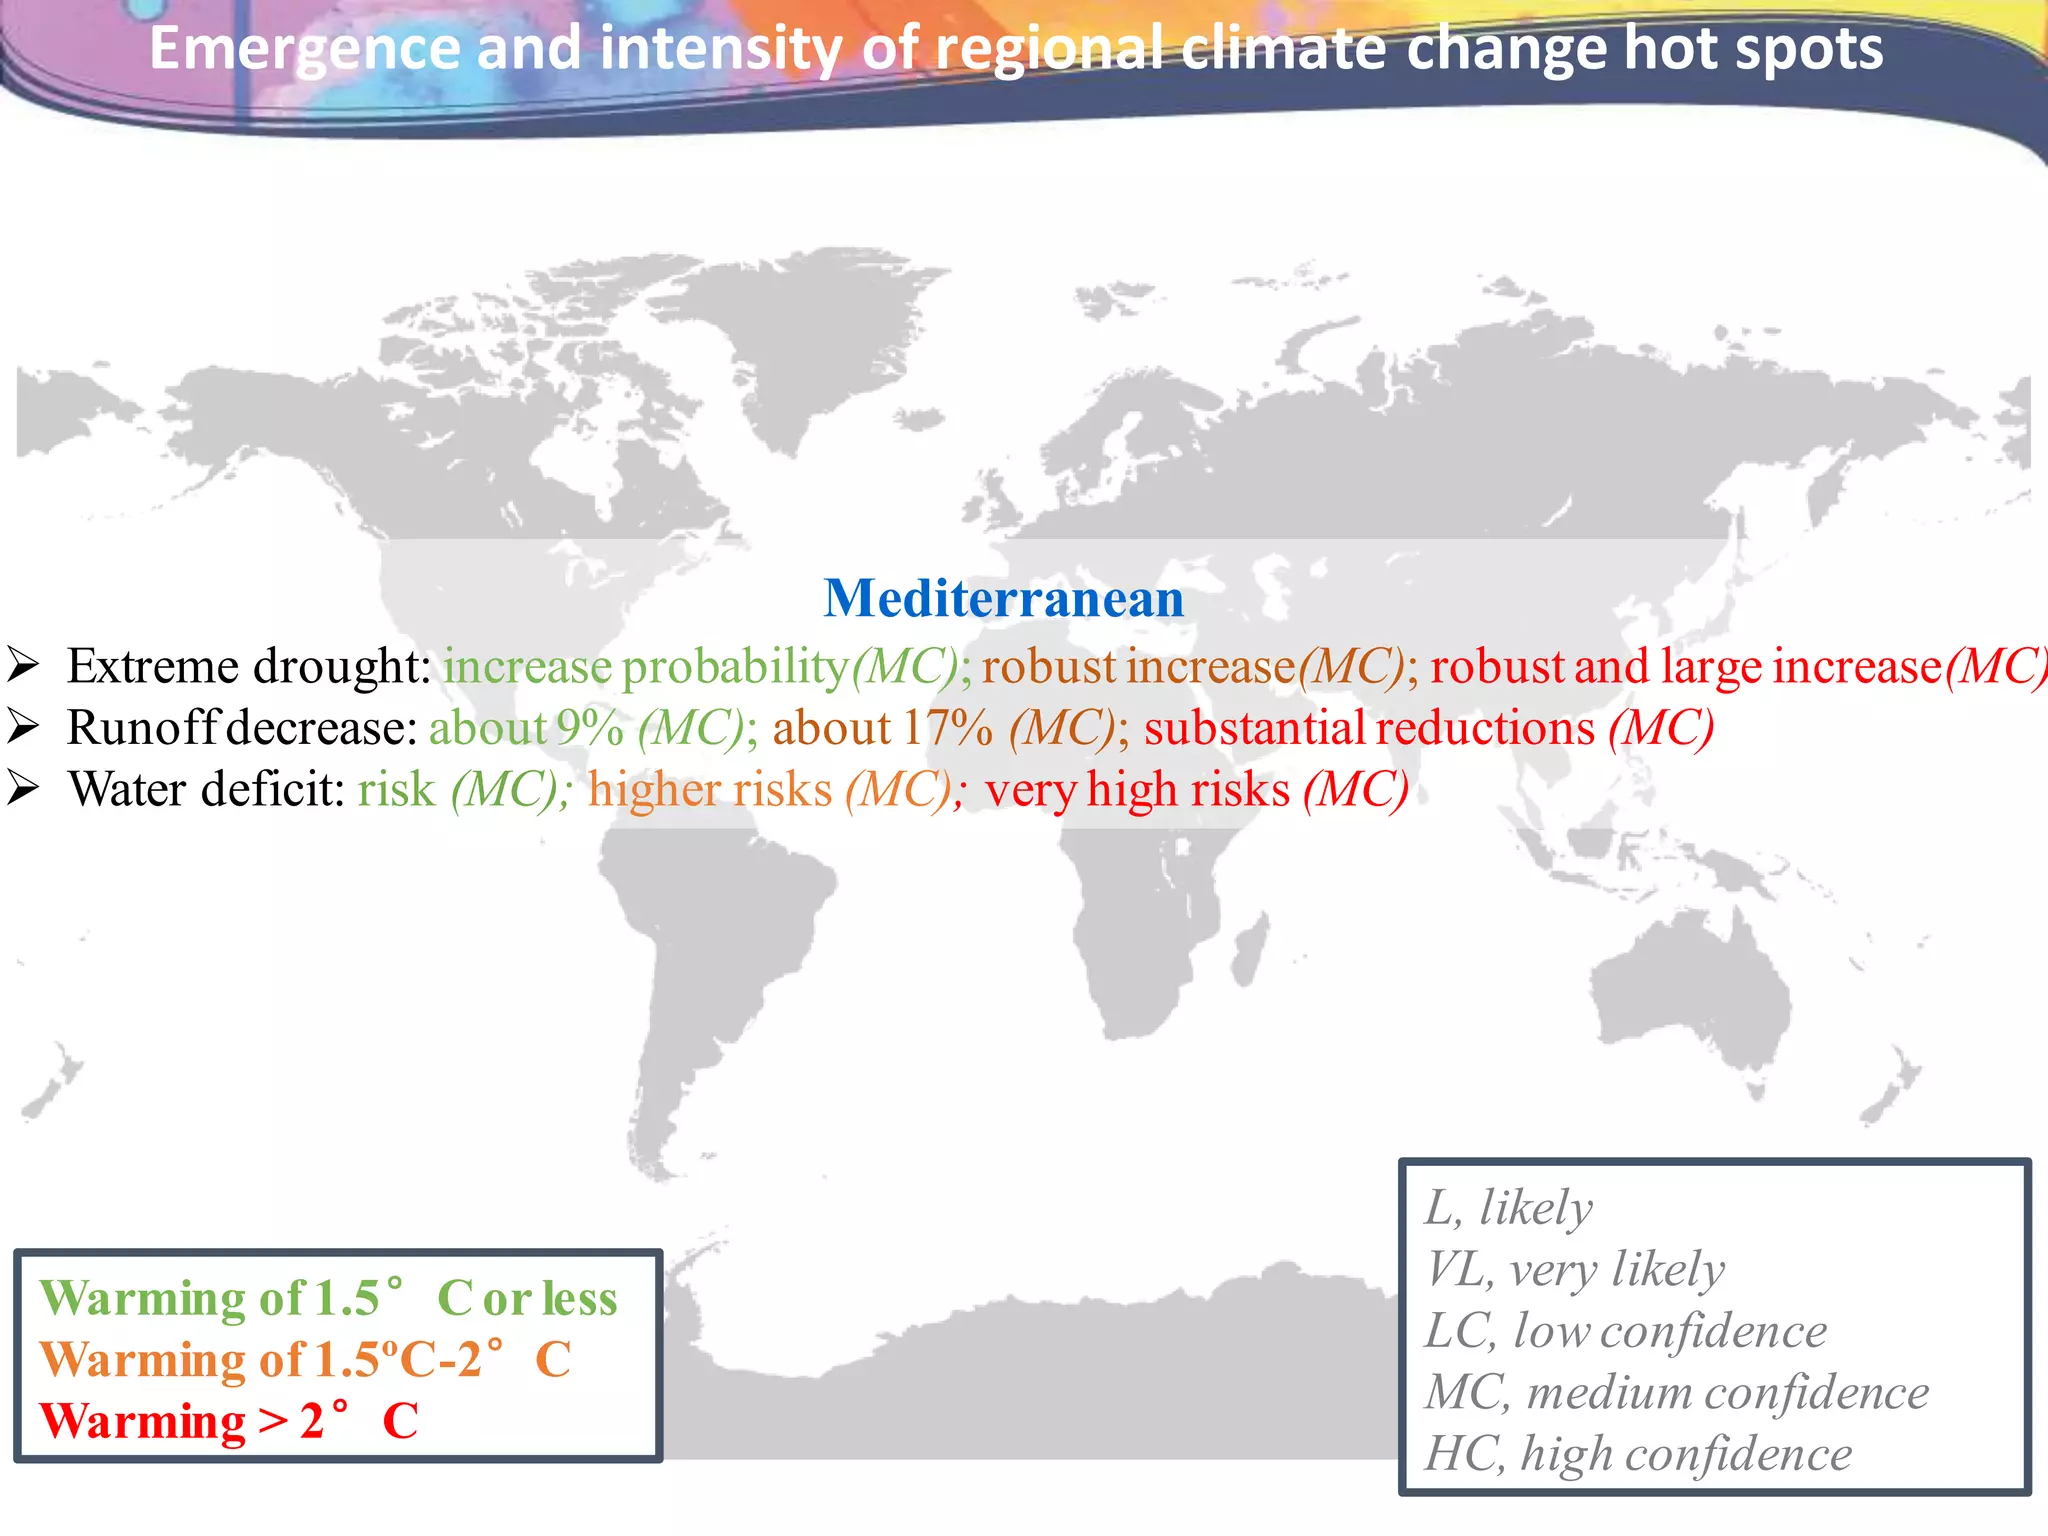
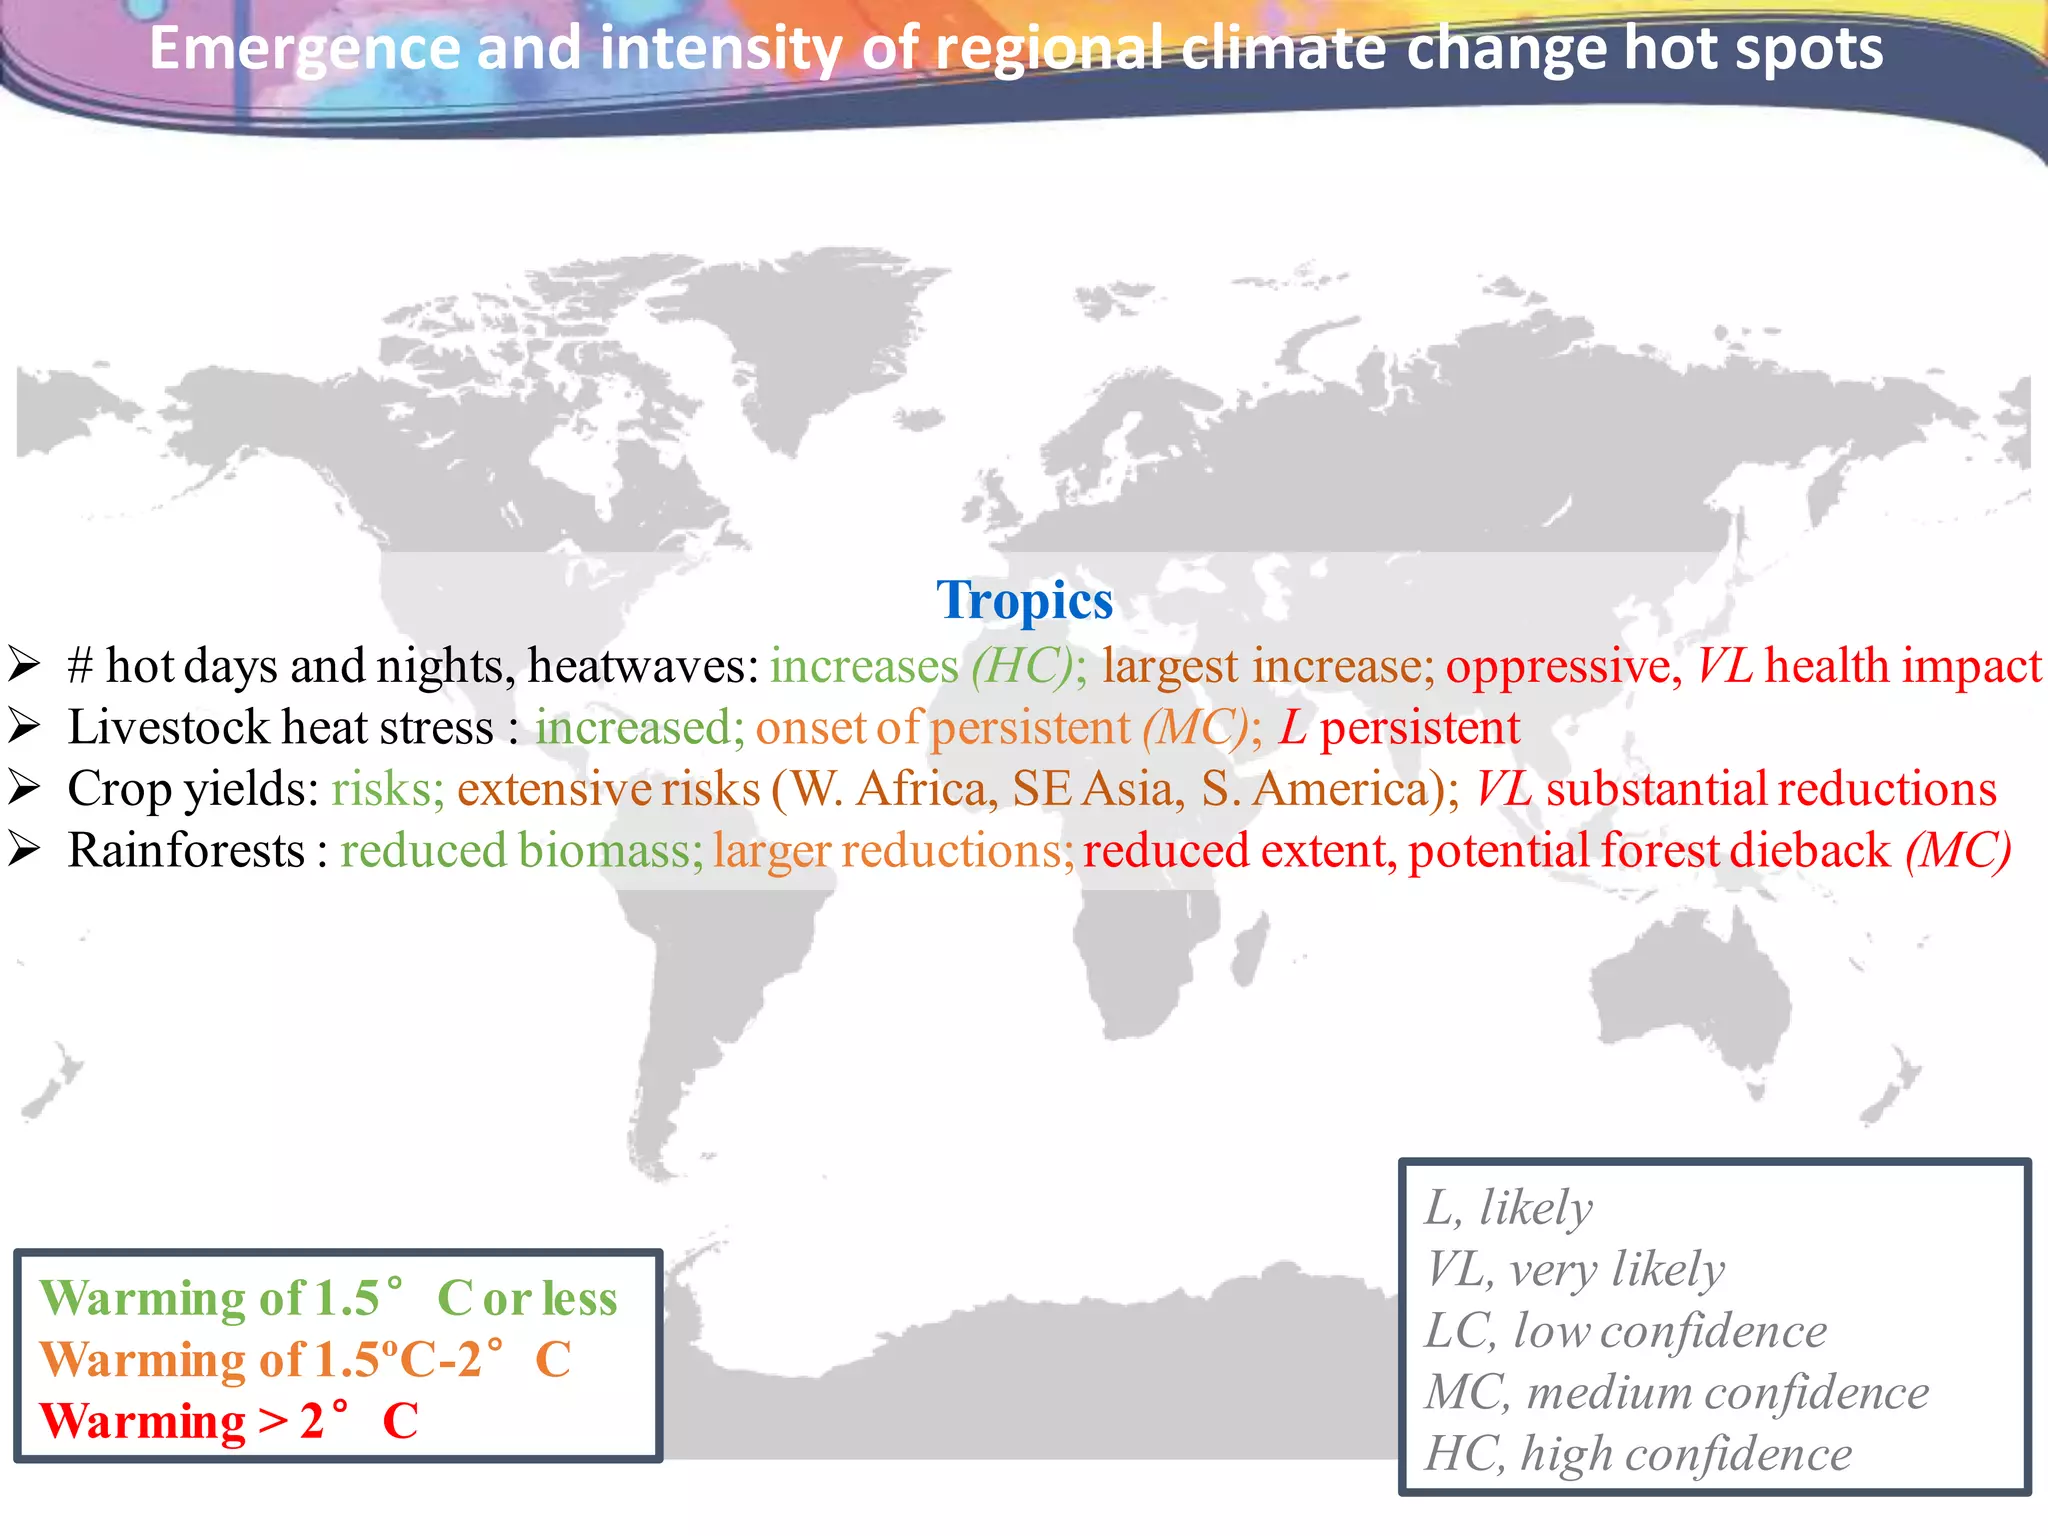
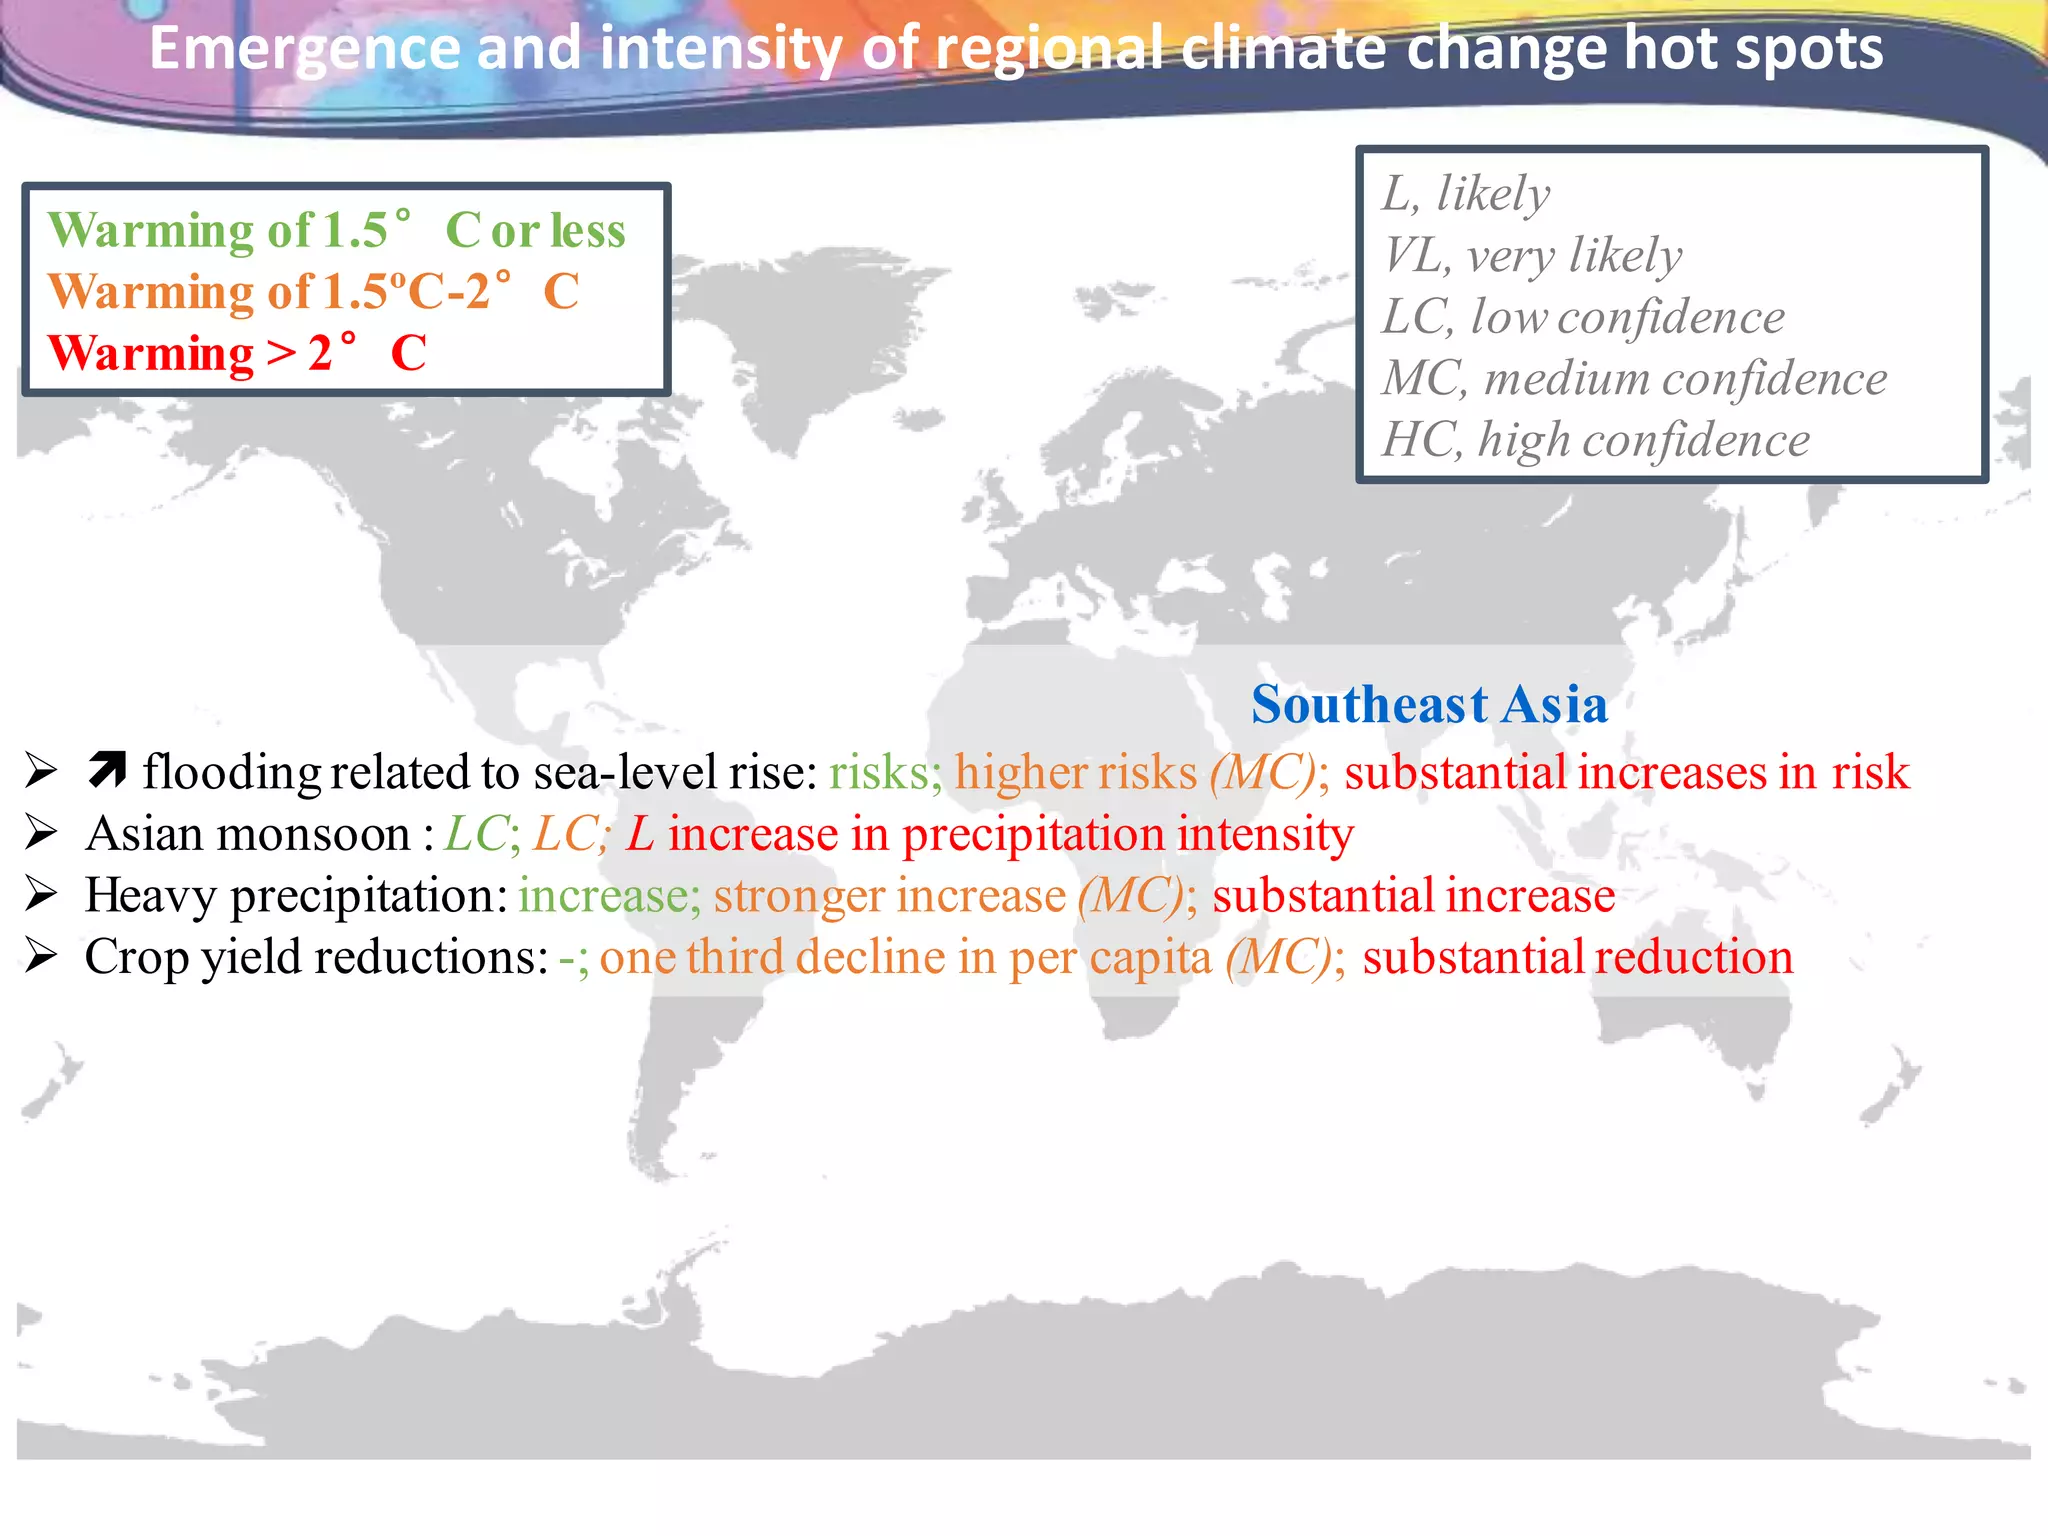
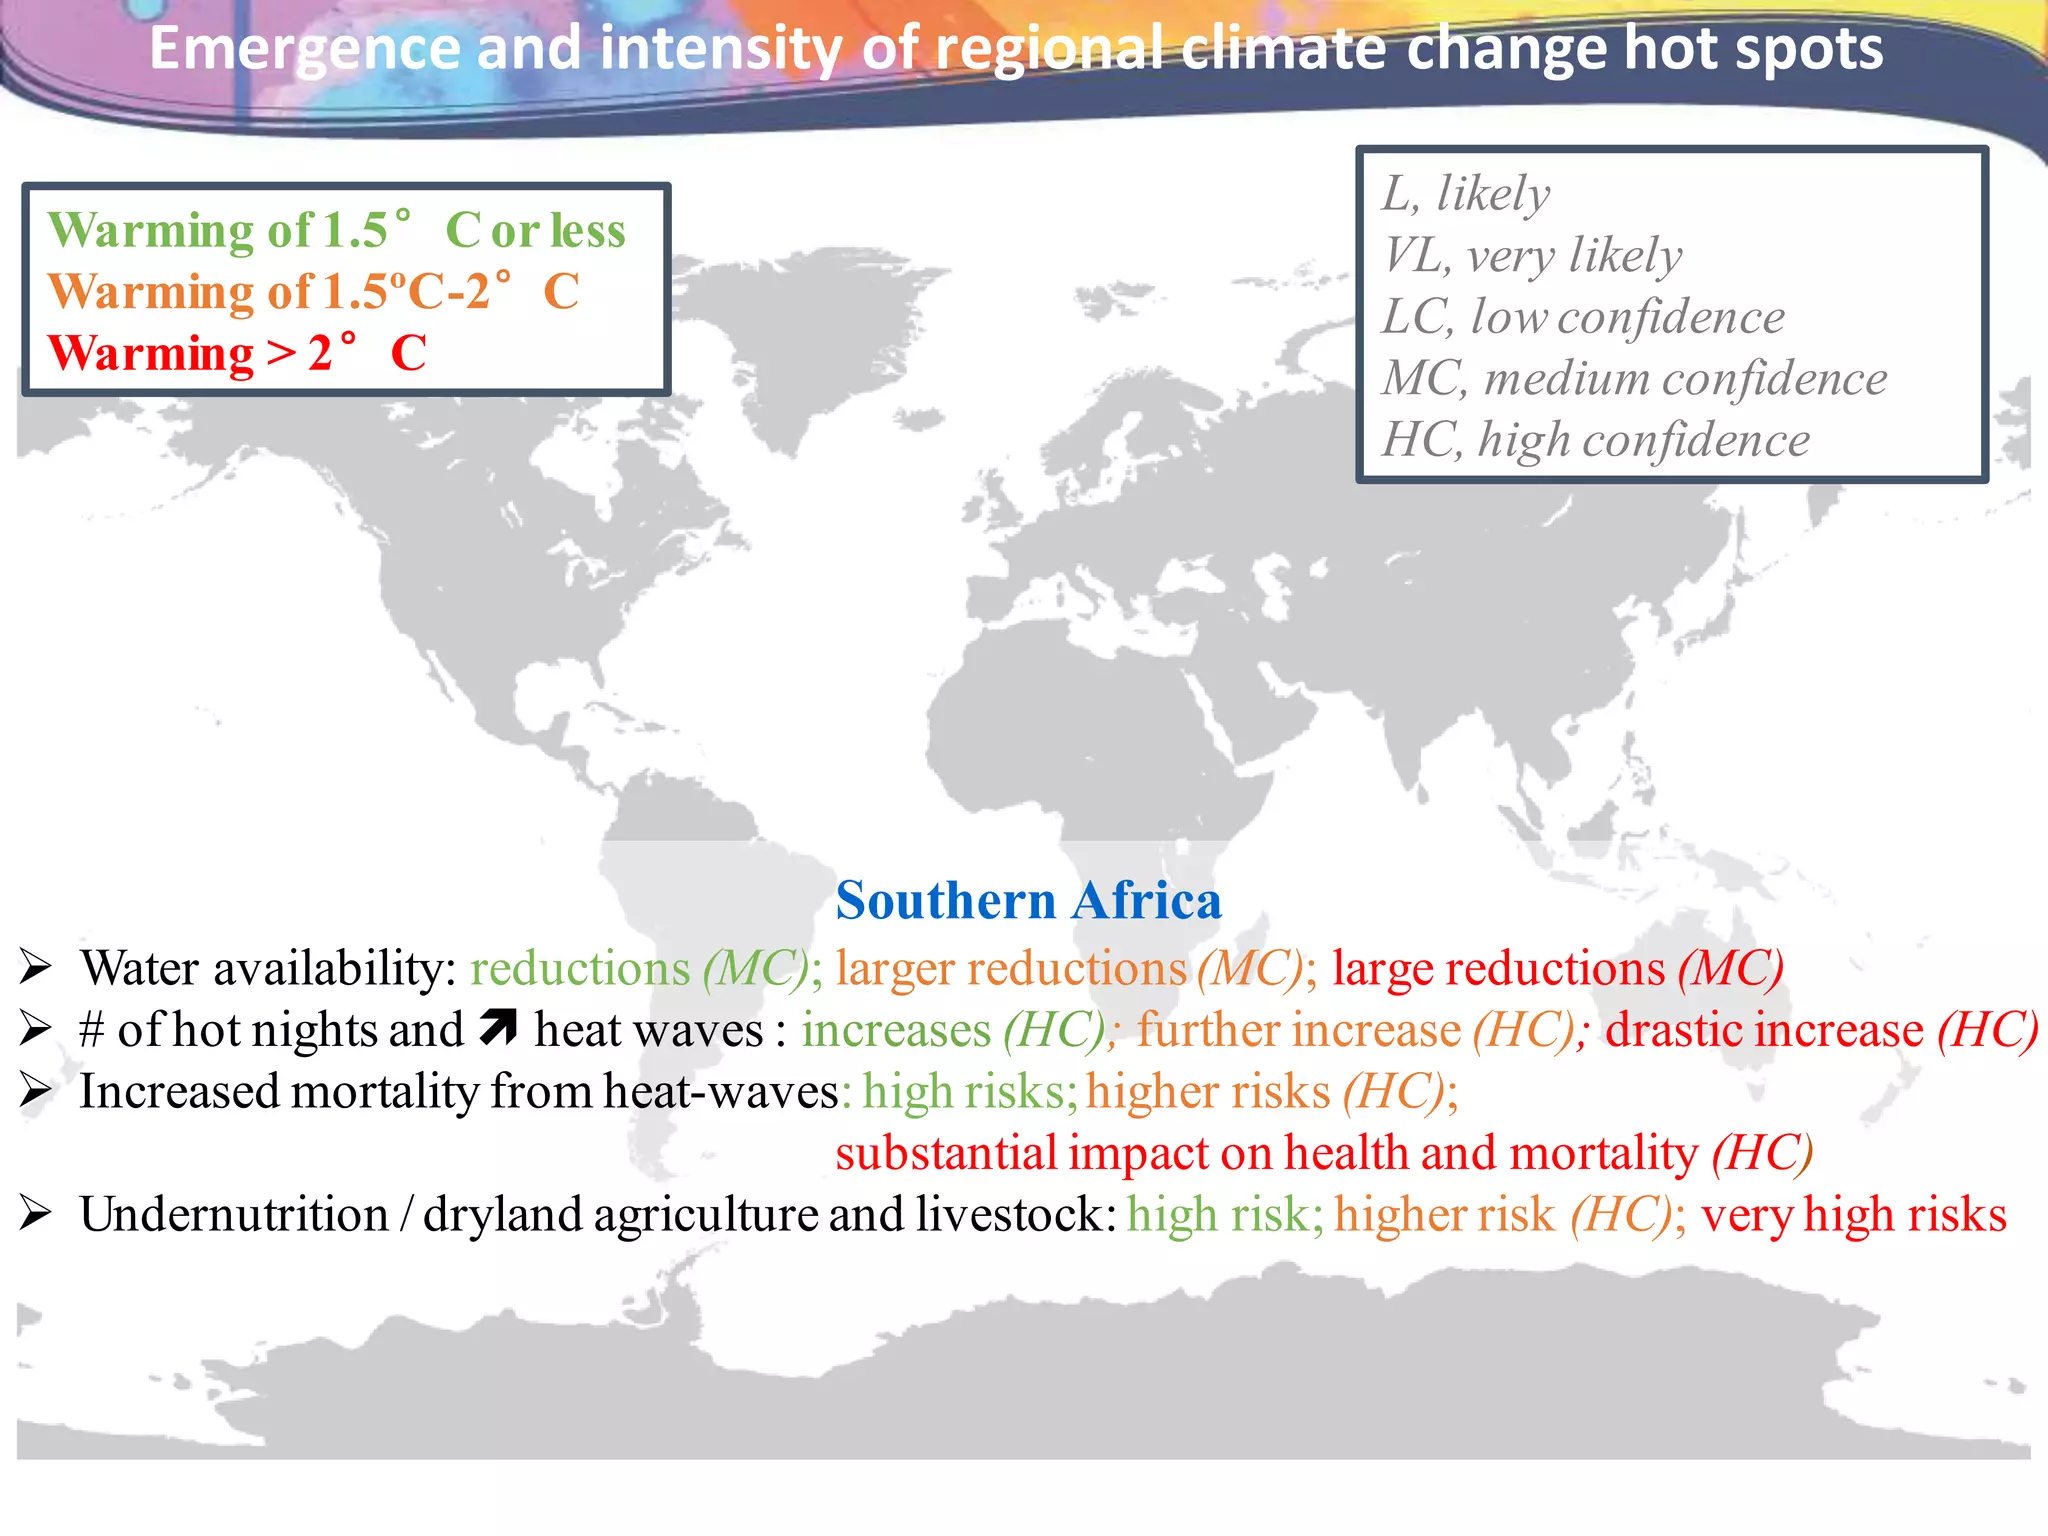
Global Warming of 1.5°C
An IPCC special report on the impacts of
global warming of 1.5°C above pre-industrial
levels and related global greenhouse gas
emission pathways, in the context of
strengthening the global response to the
threat of climate change, sustainable
development, and efforts to eradicate
poverty.
The report in numbers
91 Authors from 40 Countries
133 Contributing authors
6000 Studies 1 113 Reviewers
42 001 Comments
Climate change is already affecting people,
ecosystems and livelihoods around the world
Limiting global warming to 1.5°C is not
impossible – but it would require
unprecedented transitions in all aspects of
society
There are clear benefits to keeping warming
to 1.5°C rather than 2°C or higher
Limiting warming to 1.5°C can go hand in
hand with achieving other world goals
Chapter 1 - Framing and context (integration WGI-WGII-III)
Chapter 2 - Mitigation pathways compatible with 1.5°C in the context
of sustainable development (integration WGI-WGIII,pathways)
Chapter 3 - Impacts of 1.5°C global warming on natural and human
systems (integration WGI-WGII,global – regional)
Chapter 4 - Strengthening and implementing the global response to
the threat of climate change (systemstransitions, behaviour,
dimensions of feasibility)
Chapter 5 - Sustainable development,poverty eradication and
reducing inequalities (ethics, equity, societal transformation, SDGs)
Global warming of 1.5°C (SR1.5)
Understanding Global
Warming of 1.5°C
Where are we?
Since pre-industrial times, human activities have
caused approximately 1.0°C of global warming.
• Already seeing consequences for people,
nature and livelihoods
• At current rate, would reach 1.5°C between
2030 and 2052
• Past emissions alone do not commit the
world to 1.5°C
Ashley Cooper / Aurora Photos
Cumulative emissions of CO2 and future non-CO2 radiative
forcing determine the probability of limiting warming to 1.5°C
SPM1|
Cumulative emissions of CO2 and future non-CO2 radiative
forcing determine the probability of limiting warming to 1.5°C
SPM1|
Cumulative emissions of CO2 and future non-CO2 radiative
forcing determine the probability of limiting warming to 1.5°C
SPM1|
Cumulative emissions of CO2 and future non-CO2 radiative
forcing determine the probability of limiting warming to 1.5°C
SPM1|
Cumulative emissions of CO2 and future non-CO2 radiative
forcing determine the probability of limiting warming to 1.5°C
SPM1|
Cumulative emissions of CO2 and future non-CO2 radiative
forcing determine the probability of limiting warming to 1.5°C
SPM1|
Cumulative emissions of CO2 and future non-CO2 radiative
forcing determine the probability of limiting warming to 1.5°C
SPM1|
Faster immediate CO2 emission
reductions limit cumulative CO2
emissions
Cumulative emissions of CO2 and future non-CO2 radiative
forcing determine the probability of limiting warming to 1.5°C
SPM1|
Cumulative emissions of CO2 and future non-CO2 radiative
forcing determine the probability of limiting warming to 1.5°C
SPM1|
Maximum temperature rise is determined by cumulative net CO2
emissions and net non-CO2 radiative forcing due to methane, nitrous
oxide, aerosols and other anthropogenic forcing agents.
Projected Climate
Change, Potential Impacts
and Associated Risks
Spatial patterns of changes in mean temperature
26 CMIP5 models; hatching : 66% model agreement
Global warming of 1.5°C 2°C
26 CMIP5 models; hatching : 66% model agreement
Spatial patterns of changes in mean temperature and precipitation
Global warming of 1.5°C 2°C
Global warming of 1.5°C 2°C Difference
Global warming of 1.5°C 2°C Differences
26 CMIP5 models; hatching : 66% model agreement
Spatial patterns of changes in mean temperature and precipitation
Numberof hotdays
(days)
Temperatureof
hottest days(°C)
Temperatureof
coldestnights(°C)
Global warming of 1.5°C 2°C
Spatial patterns of changes in extreme temperature
Spatial patterns of changes in extreme temperature and precipitation
Numberof hotdays
(days)
Temperatureof
hottest days(°C)
Temperatureof
coldestnights(°C)
Extreme
precipitation(%)
Global warming of 1.5°C 2°C
Spatial patterns of changes in extreme temperature and precipitation
Numberof hotdays
(days)
Temperatureof
hottest days(°C)
Temperatureof
coldestnights(°C)
Extreme
precipitation(%)
Global warming of 1.5°C 2°C Difference
Arctic summer sea-ice
 L maintained;50% or higher risk to be ice free;VL to be ice free
 Habitat (polar bear, whales, seals, sea birds) : losses; losses; critical losses
 Arctic fisheries : benefits; benefits; benefits
L, likely
VL, very likely
LC, low confidence
MC, medium confidence
HC, high confidence
Emergence and intensity of regional climate change hot spots
Warming of 1.5°Cor less
Warming of 1.5ºC-2°C
Warming > 2°C
L, likely
VL, very likely
LC, low confidence
MC, medium confidence
HC, high confidence
Arctic land regions
 Cold extreme: warm up to 4.5°C (HC); warm up to 8°C (HC); VL drastic warming
 Tundra : L biome shifts; L more shifts; drastic biome shift possible (LC)
 Permafrost : L 17-44% reduction;L larger (28-53%); potential for collapse (LC)
 Boreal forest : increased mortality at S. boundary (MC); further (MC); potential dieback (LC)
Emergence and intensity of regional climate change hot spots
Warming of 1.5°Cor less
Warming of 1.5ºC-2°C
Warming > 2°C
L, likely
VL, very likely
LC, low confidence
MC, medium confidence
HC, high confidence
Alpine regions
 Biomes : L severe shift; L even more severe; L critical
Emergence and intensity of regional climate change hot spots
Warming of 1.5°Cor less
Warming of 1.5ºC-2°C
Warming > 2°C
L, likely
VL, very likely
LC, low confidence
MC, medium confidence
HC, high confidence
Mediterranean
 Extreme drought: increase probability(MC); robust increase(MC); robust and large increase(MC)
 Runoffdecrease: about 9% (MC); about 17% (MC); substantial reductions (MC)
 Water deficit: risk (MC); higher risks (MC); very high risks (MC)
Emergence and intensity of regional climate change hot spots
Warming of 1.5°Cor less
Warming of 1.5ºC-2°C
Warming > 2°C
L, likely
VL, very likely
LC, low confidence
MC, medium confidence
HC, high confidence
Tropics
 # hot days and nights, heatwaves: increases (HC); largest increase; oppressive, VL health impact
 Livestock heat stress : increased; onset of persistent (MC); L persistent
 Crop yields: risks; extensive risks (W. Africa, SEAsia, S.America); VL substantial reductions
 Rainforests : reduced biomass;larger reductions;reduced extent, potential forest dieback (MC)
Emergence and intensity of regional climate change hot spots
Warming of 1.5°Cor less
Warming of 1.5ºC-2°C
Warming > 2°C
L, likely
VL, very likely
LC, low confidence
MC, medium confidence
HC, high confidence
Southeast Asia
  flooding related to sea-level rise: risks; higher risks (MC); substantial increases in risk
 Asian monsoon : LC; LC; L increase in precipitation intensity
 Heavy precipitation:increase; stronger increase (MC); substantial increase
 Crop yield reductions: -; one third decline in per capita (MC); substantial reduction
Emergence and intensity of regional climate change hot spots
Warming of 1.5°Cor less
Warming of 1.5ºC-2°C
Warming > 2°C
L, likely
VL, very likely
LC, low confidence
MC, medium confidence
HC, high confidence
West African and the Sahel
 Monsoon : uncertain ; uncertain ; strengthening (LC)
 Hot nights, longer, more frequent heat waves: L ; L further ; VL substantial 
  in maize and sorghumproduction: L, about 40%  suitable area; L larger ;
major regional food insecurities (MC)
 Undernutrition risks : increased; higher; high
Emergence and intensity of regional climate change hot spots
Warming of 1.5°Cor less
Warming of 1.5ºC-2°C
Warming > 2°C
Warming of 1.5°Cor less
Warming of 1.5ºC-2°C
Warming > 2°C
L, likely
VL, very likely
LC, low confidence
MC, medium confidence
HC, high confidence
Southern Africa
 Water availability: reductions (MC); larger reductions(MC); large reductions (MC)
 # of hot nights and  heat waves : increases (HC); further increase (HC); drastic increase (HC)
 Increased mortality from heat-waves: high risks;higher risks (HC);
substantial impact on health and mortality (HC)
 Undernutrition / dryland agriculture and livestock:high risk; higher risk (HC); very high risks
Emergence and intensity of regional climate change hot spots
Small islands:
 Inundation risk : land exposed;tens of thousands displaced ; substantial, widespread impacts
 Coastal flooding: risks; high risks ; substantial and widespread impacts
 Fresh water stress : increased; projected aridity; substantial and widespread impacts
 # of warm days : increase; further increase (70 warm days/year), persistent heat stress in
cattle ; persistent heat stress
 Loss of coral reefs: 70-90%; most coral reefs ; loss of most coral reefs (VL)
L, likely
VL, very likely
LC, low confidence
MC, medium confidence
HC, high confidence
Emergence and intensity of regional climate change hot spots
Warming of 1.5°Cor less
Warming of 1.5ºC-2°C
Warming > 2°C

SR15-PartAB-ValerieSBSTA.pdf

  • 1.
  • 2.
    Global Warming of1.5°C An IPCC special report on the impacts of global warming of 1.5°C above pre-industrial levels and related global greenhouse gas emission pathways, in the context of strengthening the global response to the threat of climate change, sustainable development, and efforts to eradicate poverty.
  • 3.
    The report innumbers 91 Authors from 40 Countries 133 Contributing authors 6000 Studies 1 113 Reviewers 42 001 Comments
  • 4.
    Climate change isalready affecting people, ecosystems and livelihoods around the world Limiting global warming to 1.5°C is not impossible – but it would require unprecedented transitions in all aspects of society There are clear benefits to keeping warming to 1.5°C rather than 2°C or higher Limiting warming to 1.5°C can go hand in hand with achieving other world goals
  • 6.
    Chapter 1 -Framing and context (integration WGI-WGII-III) Chapter 2 - Mitigation pathways compatible with 1.5°C in the context of sustainable development (integration WGI-WGIII,pathways) Chapter 3 - Impacts of 1.5°C global warming on natural and human systems (integration WGI-WGII,global – regional) Chapter 4 - Strengthening and implementing the global response to the threat of climate change (systemstransitions, behaviour, dimensions of feasibility) Chapter 5 - Sustainable development,poverty eradication and reducing inequalities (ethics, equity, societal transformation, SDGs) Global warming of 1.5°C (SR1.5)
  • 7.
  • 8.
    Where are we? Sincepre-industrial times, human activities have caused approximately 1.0°C of global warming. • Already seeing consequences for people, nature and livelihoods • At current rate, would reach 1.5°C between 2030 and 2052 • Past emissions alone do not commit the world to 1.5°C Ashley Cooper / Aurora Photos
  • 9.
    Cumulative emissions ofCO2 and future non-CO2 radiative forcing determine the probability of limiting warming to 1.5°C SPM1|
  • 10.
    Cumulative emissions ofCO2 and future non-CO2 radiative forcing determine the probability of limiting warming to 1.5°C SPM1|
  • 11.
    Cumulative emissions ofCO2 and future non-CO2 radiative forcing determine the probability of limiting warming to 1.5°C SPM1|
  • 12.
    Cumulative emissions ofCO2 and future non-CO2 radiative forcing determine the probability of limiting warming to 1.5°C SPM1|
  • 13.
    Cumulative emissions ofCO2 and future non-CO2 radiative forcing determine the probability of limiting warming to 1.5°C SPM1|
  • 14.
    Cumulative emissions ofCO2 and future non-CO2 radiative forcing determine the probability of limiting warming to 1.5°C SPM1|
  • 15.
    Cumulative emissions ofCO2 and future non-CO2 radiative forcing determine the probability of limiting warming to 1.5°C SPM1| Faster immediate CO2 emission reductions limit cumulative CO2 emissions
  • 16.
    Cumulative emissions ofCO2 and future non-CO2 radiative forcing determine the probability of limiting warming to 1.5°C SPM1|
  • 17.
    Cumulative emissions ofCO2 and future non-CO2 radiative forcing determine the probability of limiting warming to 1.5°C SPM1| Maximum temperature rise is determined by cumulative net CO2 emissions and net non-CO2 radiative forcing due to methane, nitrous oxide, aerosols and other anthropogenic forcing agents.
  • 19.
    Projected Climate Change, PotentialImpacts and Associated Risks
  • 20.
    Spatial patterns ofchanges in mean temperature 26 CMIP5 models; hatching : 66% model agreement Global warming of 1.5°C 2°C
  • 21.
    26 CMIP5 models;hatching : 66% model agreement Spatial patterns of changes in mean temperature and precipitation Global warming of 1.5°C 2°C
  • 22.
    Global warming of1.5°C 2°C Difference Global warming of 1.5°C 2°C Differences 26 CMIP5 models; hatching : 66% model agreement Spatial patterns of changes in mean temperature and precipitation
  • 23.
    Numberof hotdays (days) Temperatureof hottest days(°C) Temperatureof coldestnights(°C) Globalwarming of 1.5°C 2°C Spatial patterns of changes in extreme temperature
  • 24.
    Spatial patterns ofchanges in extreme temperature and precipitation Numberof hotdays (days) Temperatureof hottest days(°C) Temperatureof coldestnights(°C) Extreme precipitation(%) Global warming of 1.5°C 2°C
  • 25.
    Spatial patterns ofchanges in extreme temperature and precipitation Numberof hotdays (days) Temperatureof hottest days(°C) Temperatureof coldestnights(°C) Extreme precipitation(%) Global warming of 1.5°C 2°C Difference
  • 26.
    Arctic summer sea-ice L maintained;50% or higher risk to be ice free;VL to be ice free  Habitat (polar bear, whales, seals, sea birds) : losses; losses; critical losses  Arctic fisheries : benefits; benefits; benefits L, likely VL, very likely LC, low confidence MC, medium confidence HC, high confidence Emergence and intensity of regional climate change hot spots Warming of 1.5°Cor less Warming of 1.5ºC-2°C Warming > 2°C
  • 27.
    L, likely VL, verylikely LC, low confidence MC, medium confidence HC, high confidence Arctic land regions  Cold extreme: warm up to 4.5°C (HC); warm up to 8°C (HC); VL drastic warming  Tundra : L biome shifts; L more shifts; drastic biome shift possible (LC)  Permafrost : L 17-44% reduction;L larger (28-53%); potential for collapse (LC)  Boreal forest : increased mortality at S. boundary (MC); further (MC); potential dieback (LC) Emergence and intensity of regional climate change hot spots Warming of 1.5°Cor less Warming of 1.5ºC-2°C Warming > 2°C
  • 28.
    L, likely VL, verylikely LC, low confidence MC, medium confidence HC, high confidence Alpine regions  Biomes : L severe shift; L even more severe; L critical Emergence and intensity of regional climate change hot spots Warming of 1.5°Cor less Warming of 1.5ºC-2°C Warming > 2°C
  • 29.
    L, likely VL, verylikely LC, low confidence MC, medium confidence HC, high confidence Mediterranean  Extreme drought: increase probability(MC); robust increase(MC); robust and large increase(MC)  Runoffdecrease: about 9% (MC); about 17% (MC); substantial reductions (MC)  Water deficit: risk (MC); higher risks (MC); very high risks (MC) Emergence and intensity of regional climate change hot spots Warming of 1.5°Cor less Warming of 1.5ºC-2°C Warming > 2°C
  • 30.
    L, likely VL, verylikely LC, low confidence MC, medium confidence HC, high confidence Tropics  # hot days and nights, heatwaves: increases (HC); largest increase; oppressive, VL health impact  Livestock heat stress : increased; onset of persistent (MC); L persistent  Crop yields: risks; extensive risks (W. Africa, SEAsia, S.America); VL substantial reductions  Rainforests : reduced biomass;larger reductions;reduced extent, potential forest dieback (MC) Emergence and intensity of regional climate change hot spots Warming of 1.5°Cor less Warming of 1.5ºC-2°C Warming > 2°C
  • 31.
    L, likely VL, verylikely LC, low confidence MC, medium confidence HC, high confidence Southeast Asia   flooding related to sea-level rise: risks; higher risks (MC); substantial increases in risk  Asian monsoon : LC; LC; L increase in precipitation intensity  Heavy precipitation:increase; stronger increase (MC); substantial increase  Crop yield reductions: -; one third decline in per capita (MC); substantial reduction Emergence and intensity of regional climate change hot spots Warming of 1.5°Cor less Warming of 1.5ºC-2°C Warming > 2°C
  • 32.
    L, likely VL, verylikely LC, low confidence MC, medium confidence HC, high confidence West African and the Sahel  Monsoon : uncertain ; uncertain ; strengthening (LC)  Hot nights, longer, more frequent heat waves: L ; L further ; VL substantial    in maize and sorghumproduction: L, about 40%  suitable area; L larger ; major regional food insecurities (MC)  Undernutrition risks : increased; higher; high Emergence and intensity of regional climate change hot spots Warming of 1.5°Cor less Warming of 1.5ºC-2°C Warming > 2°C
  • 33.
    Warming of 1.5°Corless Warming of 1.5ºC-2°C Warming > 2°C L, likely VL, very likely LC, low confidence MC, medium confidence HC, high confidence Southern Africa  Water availability: reductions (MC); larger reductions(MC); large reductions (MC)  # of hot nights and  heat waves : increases (HC); further increase (HC); drastic increase (HC)  Increased mortality from heat-waves: high risks;higher risks (HC); substantial impact on health and mortality (HC)  Undernutrition / dryland agriculture and livestock:high risk; higher risk (HC); very high risks Emergence and intensity of regional climate change hot spots
  • 34.
    Small islands:  Inundationrisk : land exposed;tens of thousands displaced ; substantial, widespread impacts  Coastal flooding: risks; high risks ; substantial and widespread impacts  Fresh water stress : increased; projected aridity; substantial and widespread impacts  # of warm days : increase; further increase (70 warm days/year), persistent heat stress in cattle ; persistent heat stress  Loss of coral reefs: 70-90%; most coral reefs ; loss of most coral reefs (VL) L, likely VL, very likely LC, low confidence MC, medium confidence HC, high confidence Emergence and intensity of regional climate change hot spots Warming of 1.5°Cor less Warming of 1.5ºC-2°C Warming > 2°C