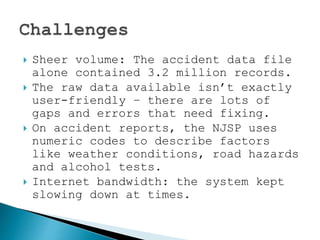
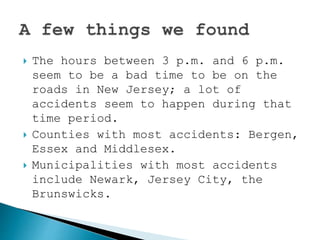
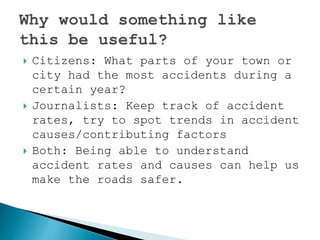
(Also known as Team Blue Smiley
Faces, the Blue Meanies, etc.)
 Matthew MacVay
 Patrick Murray
 Colleen O’Dea
 Igor Putilov
 Erin Roll
 Alex Schechter
 A searchable database, and
a map, of motor vehicle
accidents around New
Jersey, assembled using raw
data from the state
Department of
Transportation website.
 Where can journalists and average
citizens go to find motor vehicle
accident data about their town or
their county, as well as the state?
 On the NJDOT website, there is lots
of raw accident data.
 However, all of that data is spread
out among five sets of massive, eye-
straining Notepad text files.
 Emphasis on eye-straining.
 We decided to merge as much data as
we could into one database.
 We attempted to pull the most
pertinent data – accident
dates/times, locations,
deaths/injuries, driver’s conditions,
vehicle types.
 With it, we decided to create a map
showing where the most accident-prone
roads and highways were.
 Asked, what are people going to want
to search for first?
 Some of the tools we used, or tried
to use: Mongo, Mapbox, Google Maps,
GitHub, JSON, Kibana, Elastic Search
 Downloaded all of the Notepad text,
and converted it into CSV files in
Excel and used it to help assemble
the database.
 Sheer volume: The accident data file
alone contained 3.2 million records.
 The raw data available isn’t exactly
user-friendly – there are lots of
gaps and errors that need fixing.
 On accident reports, the NJSP uses
numeric codes to describe factors
like weather conditions, road hazards
and alcohol tests.
 Internet bandwidth: the system kept
slowing down at times.
 The hours between 3 p.m. and 6 p.m.
seem to be a bad time to be on the
roads in New Jersey; a lot of
accidents seem to happen during that
time period.
 Counties with most accidents: Bergen,
Essex and Middlesex.
 Municipalities with most accidents
include Newark, Jersey City, the
Brunswicks.
 Citizens: What parts of your town or
city had the most accidents during a
certain year?
 Journalists: Keep track of accident
rates, try to spot trends in accident
causes/contributing factors
 Both: Being able to understand
accident rates and causes can help us
make the roads safer.

Hack jersey 2 final

  • 1.
    (Also known asTeam Blue Smiley Faces, the Blue Meanies, etc.)
  • 2.
     Matthew MacVay Patrick Murray  Colleen O’Dea  Igor Putilov  Erin Roll  Alex Schechter
  • 3.
     A searchabledatabase, and a map, of motor vehicle accidents around New Jersey, assembled using raw data from the state Department of Transportation website.
  • 4.
     Where canjournalists and average citizens go to find motor vehicle accident data about their town or their county, as well as the state?  On the NJDOT website, there is lots of raw accident data.  However, all of that data is spread out among five sets of massive, eye- straining Notepad text files.  Emphasis on eye-straining.
  • 5.
     We decidedto merge as much data as we could into one database.  We attempted to pull the most pertinent data – accident dates/times, locations, deaths/injuries, driver’s conditions, vehicle types.  With it, we decided to create a map showing where the most accident-prone roads and highways were.
  • 6.
     Asked, whatare people going to want to search for first?  Some of the tools we used, or tried to use: Mongo, Mapbox, Google Maps, GitHub, JSON, Kibana, Elastic Search  Downloaded all of the Notepad text, and converted it into CSV files in Excel and used it to help assemble the database.
  • 7.
     Sheer volume:The accident data file alone contained 3.2 million records.  The raw data available isn’t exactly user-friendly – there are lots of gaps and errors that need fixing.  On accident reports, the NJSP uses numeric codes to describe factors like weather conditions, road hazards and alcohol tests.  Internet bandwidth: the system kept slowing down at times.
  • 8.
     The hoursbetween 3 p.m. and 6 p.m. seem to be a bad time to be on the roads in New Jersey; a lot of accidents seem to happen during that time period.  Counties with most accidents: Bergen, Essex and Middlesex.  Municipalities with most accidents include Newark, Jersey City, the Brunswicks.
  • 9.
     Citizens: Whatparts of your town or city had the most accidents during a certain year?  Journalists: Keep track of accident rates, try to spot trends in accident causes/contributing factors  Both: Being able to understand accident rates and causes can help us make the roads safer.