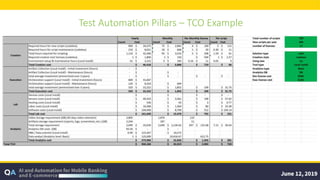
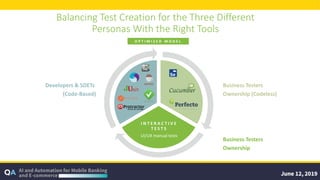
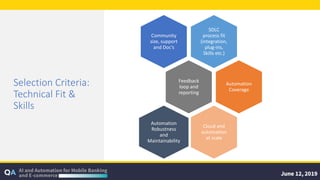
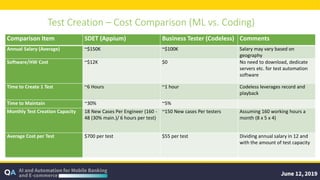
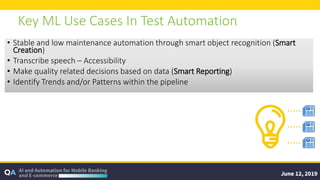
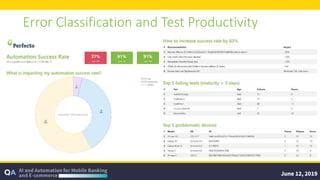
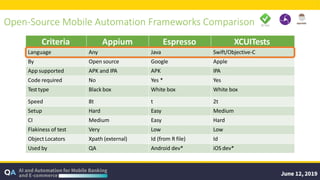
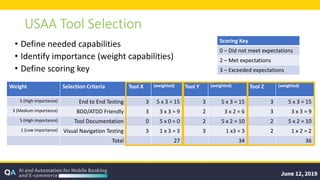
Guidelines to Measuring Test Automation ROI
2 | Quest 2019 perfecto.io
About Me
Eran Kinsbruner
• Chief Evangelist at Perfecto (A Perforce Company)
• Blogger and Speaker
• http://continuoustesting.blog
• https://enterprisersproject.com/user/eran-kinsbruner
• https://www.testcraft.io/author/eran/
• https://www.infoworld.com/author/Eran-Kinsbruner/
• 19+ Years in Development & Testing
• Author of:
• The Digital Quality Handbook
• Continuous Testing for DevOps Professionals
• Twitter: @ek121268
3 | Quest 2019 perfecto.io
Agenda
1
2
3
4
5
How to build a compelling business case for automation.
The criteria needed for a successful transformation from manual to automated testing.
Tips for Test Automation.
Q&A
AI and ML capabilities for test creation and analysis.
Building a Business Case for Test Automation
Shift Left: Manual vs. Automated Testing Impact
Test AUTOMATION – What to Automate?
1. What’s the test engineer’s gut
feeling 😊
2. Risk calculated as probability to
occur and impact to customers
3. Value – does the test provide new
information and, if failed, how much
time to fix?
4. Cost efficiency to develop – how
long does it take to develop and how
easy is it to script?
5. History of test – volume of historical
failures in related areas and
frequency of breaks
Source: Angie Jones
Test Automation Pillars – TCO Example
Successful Transformation from Manual to Automation
I N T E R A C T I V E
T E S T S
UI/UX manual tests
Balancing Test Creation for the Three Different
Personas With the Right Tools
O P T I M I Z E D M O D E L
Developers & SDETs
(Code-Based)
Business Testers
Ownership (Codeless)
Business Testers
Ownership
10 | Quest 2019 perfecto.io
Selection Criteria:
Technical Fit &
Skills
SDLC
process fit
(integration,
plug-ins,
Skills etc.)
Community
size, support
and Doc’s
Feedback
loop and
reporting
Automation
Coverage
Cloud and
automation
at scale
Automation
Robustness
and
Maintainability
Test Coverage Fundamentals
Web Traffic AnalyticsMost Used Mobile Platforms
Selecting the Right Test Cases
Step 1: Acknowledge Your Pipeline Testing Requirements
P L AT F O R M C O V E R A G E T H R O U G H O U T T H E D E V O P S P I P E L I N E
Step 2: Gather Testing Productivity Metrics
• Measurable Metrics:
• Test suite size — Number of unique test cases (Unit, Regression, Non-Functional, etc.).
• Average time per test — Time in minutes (2-3 minutes is a best practice).
• Test execution — Number of hours a cycle should run (Nightly, per build).
• Soft Metrics:
• Platforms specific — Defects history, unique features support, etc.
• Analytics data
• Tests specific — Test flakiness and inconsistency.
Step 3: Size Your Digital Lab
Coverage
Bucket
Number of
Unique Tests
(Regression
Suite)
Average Time
Per Test
Execution
Window
(Hours)
Test Execution
Time
(Serial)
Parallel Test
Execution
Requirement
Cost Avoidance
(Business Tester
Annual Salary
Input)
Essential
(Top 10)
150 3 Minutes 8 Hours 4500 Minutes
(75 Hours)
9 67 Hours Saved
($3,500 per
cycle)
Enhanced
(Top 25)
150 3 Minutes 8 Hours 11,250 Minutes
(187.5 Hours)
23 180 Hours Saved
($8640 per cycle)
Extended
(Top 32)
150 3 Minutes 8 Hours 14,400 Minutes
(240 Hours)
30 232 Hours Saved
($11,136 per
cycle)
AI & ML in Test Creation and Reporting
Test Creation – Cost Comparison (ML vs. Coding)
Comparison Item SDET (Appium) Business Tester (Codeless) Comments
Annual Salary (Average) ~$150K ~$100K Salary may vary based on
geography
Software/HW Cost ~$12K $0 No need to download, dedicate
servers etc. for test automation
software
Time to Create 1 Test ~6 Hours ~1 hour Codeless leverages record and
playback
Time to Maintain ~30% ~5%
Monthly Test Creation Capacity 18 New Cases Per Engineer (160 -
48 (30% main.)/ 6 hours per test)
~150 New cases Per testers Assuming 160 working hours a
month (8 x 5 x 4)
Average Cost per Test $700 per test $55 per test Dividing annual salary in 12 and
with the amount of test capacity
Defining Machine Learning (ML)
An algorithm which gives a statistic answer to well-
defined question based on previous results
Key ML Use Cases In Test Automation
• Stable and low maintenance automation through smart object recognition (Smart
Creation)
• Transcribe speech – Accessibility
• Make quality related decisions based on data (Smart Reporting)
• Identify Trends and/or Patterns within the pipeline
Error Classification and Test Productivity
Object Identification Weights Based on History
Closing Tips for Test Automation
There Are Patterns for “Unstable” Test Automation
80% of issues have a pattern52% success rate
10% of devices,
causing 80% of lab
issues
Lab
25%
Orchestr
ation
25%
Scripts &
FW
50%
FAILURE REASON
Objects Codding Time Other
Scripts & FW issues
Device in use
No Device
Orchestration issues
Networking Stability Lock
Other
Lab issues
What’s
wrong
With my
Scripts
What’s wrong
With my Lab
What’s wrong
With my
Executions
Are you Measuring your DRE?
DRE (Defect Removal Efficiency) =
Defects removed during the development phase
Defects detected later in the cycle (UAT, Production)
x 100%
Coverage, Lack and late automation testing, designed for testability, unit testing, outdated environments/platforms
Criteria Appium Espresso XCUITests
Language Any Java Swift/Objective-C
By Open source Google Apple
App supported APK and IPA APK IPA
Code required No Yes * Yes
Testtype Black box White box White box
Speed 8t t 2t
Setup Hard Easy Medium
CI Medium Easy Hard
Flakiness of test Very Low Low
Object Locators Xpath (external) Id (from R file) Id
Used by QA Android dev* iOS dev*
Open-Source Mobile Automation Frameworks Comparison
USAA Tool Selection
• Define needed capabilities
• Identify importance (weight capabilities)
• Define scoring key
Weight Selection Criteria Tool X (weighted) Tool Y (weighted) Tool Z (weighted)
5 (High importance) End to End Testing 3 5 x 3 = 15 3 5 x 3 = 15 3 5 x 3 = 15
3 (Medium importance) BDD/ATDD Friendly 3 3 x 3 = 9 2 3 x 2 = 6 3 3 x 3 = 9
5 (High importance) Tool Documentation 0 5 x 0 = 0 2 5 x 2 = 10 2 5 x 2 = 10
1 (Low importance) Visual Navigation Testing 3 1 x 3 = 3 3 1 x3 = 3 2 1 x 2 = 2
Total 27 34 36
Scoring Key
0 – Did not meet expectations
2 – Met expectations
3 – Exceeded expectations
 Guidelines to Measuring Test Automation ROI
 Guidelines to Measuring Test Automation ROI

Guidelines to Measuring Test Automation ROI

  • 1.
    Guidelines to MeasuringTest Automation ROI
  • 2.
    2 | Quest2019 perfecto.io About Me Eran Kinsbruner • Chief Evangelist at Perfecto (A Perforce Company) • Blogger and Speaker • http://continuoustesting.blog • https://enterprisersproject.com/user/eran-kinsbruner • https://www.testcraft.io/author/eran/ • https://www.infoworld.com/author/Eran-Kinsbruner/ • 19+ Years in Development & Testing • Author of: • The Digital Quality Handbook • Continuous Testing for DevOps Professionals • Twitter: @ek121268
  • 3.
    3 | Quest2019 perfecto.io Agenda 1 2 3 4 5 How to build a compelling business case for automation. The criteria needed for a successful transformation from manual to automated testing. Tips for Test Automation. Q&A AI and ML capabilities for test creation and analysis.
  • 4.
    Building a BusinessCase for Test Automation
  • 5.
    Shift Left: Manualvs. Automated Testing Impact
  • 6.
    Test AUTOMATION –What to Automate? 1. What’s the test engineer’s gut feeling 😊 2. Risk calculated as probability to occur and impact to customers 3. Value – does the test provide new information and, if failed, how much time to fix? 4. Cost efficiency to develop – how long does it take to develop and how easy is it to script? 5. History of test – volume of historical failures in related areas and frequency of breaks Source: Angie Jones
  • 7.
    Test Automation Pillars– TCO Example
  • 8.
    Successful Transformation fromManual to Automation
  • 9.
    I N TE R A C T I V E T E S T S UI/UX manual tests Balancing Test Creation for the Three Different Personas With the Right Tools O P T I M I Z E D M O D E L Developers & SDETs (Code-Based) Business Testers Ownership (Codeless) Business Testers Ownership
  • 10.
    10 | Quest2019 perfecto.io Selection Criteria: Technical Fit & Skills SDLC process fit (integration, plug-ins, Skills etc.) Community size, support and Doc’s Feedback loop and reporting Automation Coverage Cloud and automation at scale Automation Robustness and Maintainability
  • 11.
    Test Coverage Fundamentals WebTraffic AnalyticsMost Used Mobile Platforms Selecting the Right Test Cases
  • 12.
    Step 1: AcknowledgeYour Pipeline Testing Requirements P L AT F O R M C O V E R A G E T H R O U G H O U T T H E D E V O P S P I P E L I N E
  • 13.
    Step 2: GatherTesting Productivity Metrics • Measurable Metrics: • Test suite size — Number of unique test cases (Unit, Regression, Non-Functional, etc.). • Average time per test — Time in minutes (2-3 minutes is a best practice). • Test execution — Number of hours a cycle should run (Nightly, per build). • Soft Metrics: • Platforms specific — Defects history, unique features support, etc. • Analytics data • Tests specific — Test flakiness and inconsistency.
  • 14.
    Step 3: SizeYour Digital Lab Coverage Bucket Number of Unique Tests (Regression Suite) Average Time Per Test Execution Window (Hours) Test Execution Time (Serial) Parallel Test Execution Requirement Cost Avoidance (Business Tester Annual Salary Input) Essential (Top 10) 150 3 Minutes 8 Hours 4500 Minutes (75 Hours) 9 67 Hours Saved ($3,500 per cycle) Enhanced (Top 25) 150 3 Minutes 8 Hours 11,250 Minutes (187.5 Hours) 23 180 Hours Saved ($8640 per cycle) Extended (Top 32) 150 3 Minutes 8 Hours 14,400 Minutes (240 Hours) 30 232 Hours Saved ($11,136 per cycle)
  • 15.
    AI & MLin Test Creation and Reporting
  • 16.
    Test Creation –Cost Comparison (ML vs. Coding) Comparison Item SDET (Appium) Business Tester (Codeless) Comments Annual Salary (Average) ~$150K ~$100K Salary may vary based on geography Software/HW Cost ~$12K $0 No need to download, dedicate servers etc. for test automation software Time to Create 1 Test ~6 Hours ~1 hour Codeless leverages record and playback Time to Maintain ~30% ~5% Monthly Test Creation Capacity 18 New Cases Per Engineer (160 - 48 (30% main.)/ 6 hours per test) ~150 New cases Per testers Assuming 160 working hours a month (8 x 5 x 4) Average Cost per Test $700 per test $55 per test Dividing annual salary in 12 and with the amount of test capacity
  • 17.
    Defining Machine Learning(ML) An algorithm which gives a statistic answer to well- defined question based on previous results
  • 18.
    Key ML UseCases In Test Automation • Stable and low maintenance automation through smart object recognition (Smart Creation) • Transcribe speech – Accessibility • Make quality related decisions based on data (Smart Reporting) • Identify Trends and/or Patterns within the pipeline
  • 19.
    Error Classification andTest Productivity
  • 20.
  • 21.
    Closing Tips forTest Automation
  • 22.
    There Are Patternsfor “Unstable” Test Automation 80% of issues have a pattern52% success rate 10% of devices, causing 80% of lab issues Lab 25% Orchestr ation 25% Scripts & FW 50% FAILURE REASON Objects Codding Time Other Scripts & FW issues Device in use No Device Orchestration issues Networking Stability Lock Other Lab issues What’s wrong With my Scripts What’s wrong With my Lab What’s wrong With my Executions
  • 23.
    Are you Measuringyour DRE? DRE (Defect Removal Efficiency) = Defects removed during the development phase Defects detected later in the cycle (UAT, Production) x 100% Coverage, Lack and late automation testing, designed for testability, unit testing, outdated environments/platforms
  • 24.
    Criteria Appium EspressoXCUITests Language Any Java Swift/Objective-C By Open source Google Apple App supported APK and IPA APK IPA Code required No Yes * Yes Testtype Black box White box White box Speed 8t t 2t Setup Hard Easy Medium CI Medium Easy Hard Flakiness of test Very Low Low Object Locators Xpath (external) Id (from R file) Id Used by QA Android dev* iOS dev* Open-Source Mobile Automation Frameworks Comparison
  • 25.
    USAA Tool Selection •Define needed capabilities • Identify importance (weight capabilities) • Define scoring key Weight Selection Criteria Tool X (weighted) Tool Y (weighted) Tool Z (weighted) 5 (High importance) End to End Testing 3 5 x 3 = 15 3 5 x 3 = 15 3 5 x 3 = 15 3 (Medium importance) BDD/ATDD Friendly 3 3 x 3 = 9 2 3 x 2 = 6 3 3 x 3 = 9 5 (High importance) Tool Documentation 0 5 x 0 = 0 2 5 x 2 = 10 2 5 x 2 = 10 1 (Low importance) Visual Navigation Testing 3 1 x 3 = 3 3 1 x3 = 3 2 1 x 2 = 2 Total 27 34 36 Scoring Key 0 – Did not meet expectations 2 – Met expectations 3 – Exceeded expectations

Editor's Notes

  • #4 How to build a compelling business case for automation. The criteria needed for a successful transformation from manual to automated testing. Key metrics that need to be baked into the ROI calculator. Cost-saving examples for implementing test automation while considering AI and ML capabilities for test creation and analysis.