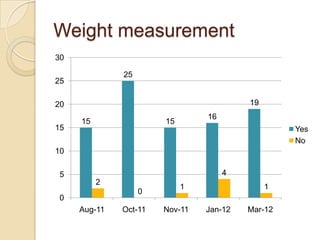
Growth Chart Audit
Benedictus Widaja FY1
21/3/2012
Introduction
 Growth chart is a basic assessment
  tool of child health and development
 RCPCH recommendation
    ◦ Measurement of OFC, height and weight
      when there is concern about child’s
      weight gain, growth or general health
Methods
 Sample size: 20 random patients from
  ward A, B and C
 Audit performed on two random days
    ◦ 30 January 2012 and 12 March 2012
 Documentation of OFC (if applicable),
  weight and height in current notes and
  their respective centiles
 Plotting of data on a growth chart
 Results are compared with previous
  audit results
Growth chart in current notes
20                                  19
18            17
                                              16
16   15
14
12
10                          9                      Yes
                   8
 8                      7                          No
 6
                                          4
 4
          2
 2                              1
 0
     Aug-11   Oct-11   Nov-11   Jan-12   Mar-12
Weight measurement
30

              25
25

20                                       19
                                16
     15                15
15                                                Yes
                                                  No
10

 5                                   4
          2
                            1                 1
                   0
 0
     Aug-11   Oct-11   Nov-11   Jan-12   Mar-12
Weight Centiles
25
     22

20


15
                              12                      Yes
                                             11
                                                      No
10                9
                                         8            weight not recorded
                      6
 5                                 4 4
          3
                          1                       1
              0
 0
     Oct-11       Nov-11      Jan-12     Mar-12
Weight - percentage
120

100        100
                 94        95
      88   88
80                    80

60                    60
                 56             Weight
40                         40
                                Centiles
20

  0
Height measurement
18
              16
16
14                                             13
                            12   12
12
10        9        9
      8                               8             Yes
 8                                         7        No
 6
                        4
 4
 2
 0
     Aug-11   Oct-11   Nov-11    Jan-12   Mar-12
Height Centiles
16
     14
14                                                  13
                          12
12
                               10
10            9
                                        8                Yes
 8
                                                         No
 6                                                       Height not recorded
                  4                             4
 4                                          3
          2                         2
 2
                      0
 0
     Oct-11       Nov-11       Jan-12       Mar-12
Height – percentage
70
          64
60                  60
          56
50                  50
     47
40
                         35   Height
30
               25
20                            Centiles
                         15
10

 0
Head Circumference (<2 years
old)
12
              11

10

                                          8
 8

      6                             6
 6                                                Yes
                        5                     5
                                                  No
                            4   4
 4

          2        2
 2

 0
     Aug-11   Oct-11   Nov-11   Jan-12   Mar-12
Head Circumference Centiles
12
     11

10

 8
                                          7
                                      6               Yes
 6
                  5                               5   No
                          4   4                       OFC not recorded
 4

              2
 2
                                              1
          0           0           0
 0
     Oct-11       Nov-11      Jan-12      Mar-12
Head Circumference -
percentage
90
          85
80
     75
70
60                       62
               56        54
50
                              OFC
40                  40
30
                              Centiles
20
10
 0
Summary – percentage
(documented centiles)
100
90        88
80
70
60                              60
          56      56                                Weight
50                              50
                                                    Height
40                                             40
                                                    OFC
30
                  25
20
                                               15
10
  0
      Oct-11   Nov-11 Dec-11 Jan-12 Feb-12 Mar-12
Discussion
   Growth charts
    ◦ Not present in most current notes
   Weight
    ◦ Weight measurement was done on most patients (80-
      95%)
    ◦ Centiles was done on approximately half of the
      patients
   Height
    ◦ Needs improvement
    ◦ Done mostly by COAU staff
    ◦ Lack of equipment to measure length on the ward
   Head Circumference
    ◦ Measurements done on approximately half of the
      patients (<2 years old)
    ◦ Good centiles documentation
   Others
Action plan
 Ideally done on admission
 Ward job book
 Availability of appropriate equipment
  on the ward

Growth chart audit

  • 1.
    Growth Chart Audit BenedictusWidaja FY1 21/3/2012
  • 2.
    Introduction  Growth chartis a basic assessment tool of child health and development  RCPCH recommendation ◦ Measurement of OFC, height and weight when there is concern about child’s weight gain, growth or general health
  • 3.
    Methods  Sample size:20 random patients from ward A, B and C  Audit performed on two random days ◦ 30 January 2012 and 12 March 2012  Documentation of OFC (if applicable), weight and height in current notes and their respective centiles  Plotting of data on a growth chart  Results are compared with previous audit results
  • 4.
    Growth chart incurrent notes 20 19 18 17 16 16 15 14 12 10 9 Yes 8 8 7 No 6 4 4 2 2 1 0 Aug-11 Oct-11 Nov-11 Jan-12 Mar-12
  • 5.
    Weight measurement 30 25 25 20 19 16 15 15 15 Yes No 10 5 4 2 1 1 0 0 Aug-11 Oct-11 Nov-11 Jan-12 Mar-12
  • 6.
    Weight Centiles 25 22 20 15 12 Yes 11 No 10 9 8 weight not recorded 6 5 4 4 3 1 1 0 0 Oct-11 Nov-11 Jan-12 Mar-12
  • 7.
    Weight - percentage 120 100 100 94 95 88 88 80 80 60 60 56 Weight 40 40 Centiles 20 0
  • 8.
    Height measurement 18 16 16 14 13 12 12 12 10 9 9 8 8 Yes 8 7 No 6 4 4 2 0 Aug-11 Oct-11 Nov-11 Jan-12 Mar-12
  • 9.
    Height Centiles 16 14 14 13 12 12 10 10 9 8 Yes 8 No 6 Height not recorded 4 4 4 3 2 2 2 0 0 Oct-11 Nov-11 Jan-12 Mar-12
  • 10.
    Height – percentage 70 64 60 60 56 50 50 47 40 35 Height 30 25 20 Centiles 15 10 0
  • 11.
    Head Circumference (<2years old) 12 11 10 8 8 6 6 6 Yes 5 5 No 4 4 4 2 2 2 0 Aug-11 Oct-11 Nov-11 Jan-12 Mar-12
  • 12.
    Head Circumference Centiles 12 11 10 8 7 6 Yes 6 5 5 No 4 4 OFC not recorded 4 2 2 1 0 0 0 0 Oct-11 Nov-11 Jan-12 Mar-12
  • 13.
    Head Circumference - percentage 90 85 80 75 70 60 62 56 54 50 OFC 40 40 30 Centiles 20 10 0
  • 14.
    Summary – percentage (documentedcentiles) 100 90 88 80 70 60 60 56 56 Weight 50 50 Height 40 40 OFC 30 25 20 15 10 0 Oct-11 Nov-11 Dec-11 Jan-12 Feb-12 Mar-12
  • 15.
    Discussion  Growth charts ◦ Not present in most current notes  Weight ◦ Weight measurement was done on most patients (80- 95%) ◦ Centiles was done on approximately half of the patients  Height ◦ Needs improvement ◦ Done mostly by COAU staff ◦ Lack of equipment to measure length on the ward  Head Circumference ◦ Measurements done on approximately half of the patients (<2 years old) ◦ Good centiles documentation  Others
  • 16.
    Action plan  Ideallydone on admission  Ward job book  Availability of appropriate equipment on the ward