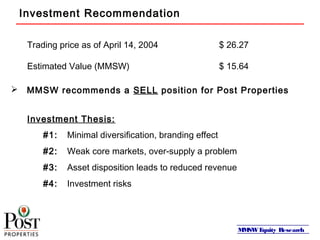
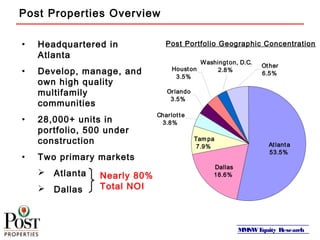
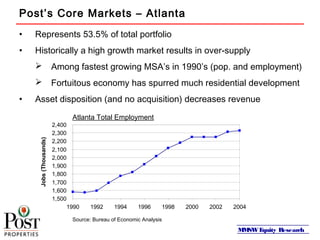
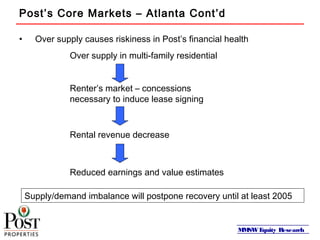
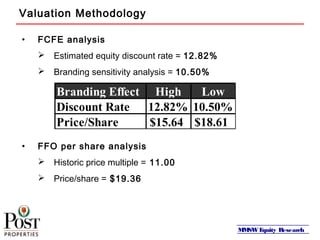
MMSWEquity Research
Post Properties, Inc.
An Investment Strategy Analysis
Scott Kwiecinski
Michael Morey
Mark Frey
Wintford Thornton
April 28, 2004
MMSWEquity Research
Analysis Agenda
1. Investment Recommendation
2. Multi-Family Sector Update
3. Post Properties Overview
4. Post’s Core Markets
5. Growth Strategy
6. Peer Comparison
7. Investment Risks
8. Management
9. Conclusion
10. Questions
MMSWEquity Research
Investment Recommendation
Minimal diversification, branding effect
Weak core markets, over-supply a problem
Asset disposition leads to reduced revenue
Investment risks
Trading price as of April 14, 2004 $ 26.27
 MMSW recommends a SELL position for Post Properties
Estimated Value (MMSW) $ 15.64
#1:
#2:
#3:
#4:
Investment Thesis:
MMSWEquity Research
Post Properties Overview
• Headquartered in
Atlanta
• Develop, manage, and
own high quality
multifamily
communities
• 28,000+ units in
portfolio, 500 under
construction
• Two primary markets
 Atlanta
 Dallas
Other
6.5%
Tampa
7.9%
Dallas
18.6%
Atlanta
53.5%
Houston
3.5%
Washington, D.C.
2.8%
Orlando
3.5%
Charlotte
3.8%
Nearly 80%
Total NOI
Post Portfolio Geographic Concentration
MMSWEquity Research
Post’s Core Markets – Atlanta
1,500
1,600
1,700
1,800
1,900
2,000
2,100
2,200
2,300
2,400
1990 1992 1994 1996 1998 2000 2002 2004
Jobs(Thousands)
• Represents 53.5% of total portfolio
• Historically a high growth market results in over-supply
 Among fastest growing MSA’s in 1990’s (pop. and employment)
 Fortuitous economy has spurred much residential development
• Asset disposition (and no acquisition) decreases revenue
Atlanta Total Employment
Source: Bureau of Economic Analysis
MMSWEquity Research
Post’s Core Markets – Atlanta Cont’d
• Over supply causes riskiness in Post’s financial health
Over supply in multi-family residential
Renter’s market – concessions
necessary to induce lease signing
Rental revenue decrease
Reduced earnings and value estimates
Supply/demand imbalance will postpone recovery until at least 2005
MMSWEquity Research
Post’s Core Markets – Dallas
• Represents 18.6% of total portfolio
• Many similarities between Dallas and Atlanta
• Dallas market specifics:
 Over-building fueled by Telecom boom in 1990’s
 Slightly lower occupancy rates compared with Atlanta
 Absorption rates still suppressed
 Lingering concessions keep effective rents low
 Dallas market not on pace to improve as quickly as
Atlanta
MMSWEquity Research
Post’s Core Markets – Tampa
• Represents 7.9% of total portfolio
• Better short-term outlook than Dallas or Atlanta
• Tampa market specifics:
 Over-supply generally not an issue
 2004 Estimate: New Supply = 4,700 units
New Demand = 4,800 units
 Scarcity of developable land
 Disciplined construction industry
 Highest core market occupancy rates in 2003
 Good market but relatively small portfolio allocation
MMSWEquity Research
Post’s Core Markets – Summary
Post Properties Occupancy Trends in Core Markets
Source: Post Properties Reports
88%
90%
92%
94%
96%
98%
2Q
02
3Q
02
4Q
02
1Q
03
2Q
03
3Q
03
4Q
03
1Q
04
2Q
04
3Q
04
4Q
04
1Q
05
2Q
05
Occupancy
Atlanta
Dallas
Tampa
MMSWEquity Research
Growth Strategy
• Post continues to divest underperforming assets
• Expected sale of approximately $270 million of properties
• Proceeds from asset sale serve 3 functions:
1. Pay down variable rate debt, reducing interest rate risk
2. Repurchase shares of preferred stock
3. Acquire properties in markets with high barriers to entry
• Company Goals
- Reduce exposure to Dallas and Atlanta markets
Geographic diversification of core assets
- Restructure and improve balance sheet
MMSWEquity Research
Growth Strategy – Impact in the Short
Run
• Analysis and subsequent recommendation is based upon a 12
month investment horizon.
• We do not expect Post to feel substantial effects from disposition
strategy for an extended period of time - Why Not??
 Limited opportunities for further acquisitions
 Ramping up of development pipeline likely will not deliver
benefit until 2005/2006
 Effectiveness of growth strategy unknown and
management’s effectiveness remains a liability
MMSWEquity Research
Peer Comparison
• Consensus estimates of FFO growth in 2004 for Post Properties
falls well below that of industry peers
- Post Properties: - 4.5%
- Industry Estimate: 3.8%
• Debt to asset ratio remains high relative to multifamily competition
• Poorly positioned to take advantage of any possible recovery or
improvement in national multifamily market fundamentals.
MMSWEquity Research
Investment Risks
• NOI growth expected to remain negative in core markets through ‘04
• Geographic concentration -
 Where will Post focus its acquisition/development efforts
• Leverage / Capital market risk
• Sustainability of dividend -
 Company maintains 115% AFFO payout ratio
 Given asset sales and subsequently low earnings estimates,
the threat of an dividend reduction remains likely
MMSWEquity Research
Key Revenue Assumptions in FCFE Valuation
• Unit decline in core
markets (Georgia,
Texas)
• Unit growth in three
markets (Florida, D.C.,
Tennessee)
• Rent increase = 2.5%
• Vacancy rate remains
same as recent history
• Asset growth negative in
2004, regains
momentum by 2005
250
260
270
280
290
300
310
320
330
340
2001 2002 2003 2004 2005 2006
Revenue($Millions)
Post Total Revenue
MMSWEquity Research
Valuation Methodology
• FCFE analysis
 Estimated equity discount rate = 12.82%
 Branding sensitivity analysis = 10.50%
Branding Effect High Low
Discount Rate 12.82% 10.50%
Price/Share $15.64 $18.61
• FFO per share analysis
 Historic price multiple = 11.00
 Price/share = $19.36
MMSWEquity Research
Conclusion
MMSWEquity Research
Questions?
Scott Kwiecinski
(608) 271-6980
sjkwieci@wisc.edu
Michael Morey
(734) 417-7724
mcmorey@wisc.edu
Mark Frey
(608) 663-4849
mmfrey@wisc.edu
Wintford Thornton
Wintfordt@yahoo.com
MMSWEquity Research
Multi-Family Sector Update
• General Economy
 Interest rates
 Employment
• Apartment Specifics
 Low urban multi-family cap rates (8.23% average)
 Higher vacancy rates (6% in 2004, 3.6% in 2002)
 Decreasing apartment construction
 Demographics suggest positive outlook for long-term
 Strong growth in sector not likely until at least 2005

Group Project

  • 1.
    MMSWEquity Research Post Properties,Inc. An Investment Strategy Analysis Scott Kwiecinski Michael Morey Mark Frey Wintford Thornton April 28, 2004
  • 2.
    MMSWEquity Research Analysis Agenda 1.Investment Recommendation 2. Multi-Family Sector Update 3. Post Properties Overview 4. Post’s Core Markets 5. Growth Strategy 6. Peer Comparison 7. Investment Risks 8. Management 9. Conclusion 10. Questions
  • 3.
    MMSWEquity Research Investment Recommendation Minimaldiversification, branding effect Weak core markets, over-supply a problem Asset disposition leads to reduced revenue Investment risks Trading price as of April 14, 2004 $ 26.27  MMSW recommends a SELL position for Post Properties Estimated Value (MMSW) $ 15.64 #1: #2: #3: #4: Investment Thesis:
  • 4.
    MMSWEquity Research Post PropertiesOverview • Headquartered in Atlanta • Develop, manage, and own high quality multifamily communities • 28,000+ units in portfolio, 500 under construction • Two primary markets  Atlanta  Dallas Other 6.5% Tampa 7.9% Dallas 18.6% Atlanta 53.5% Houston 3.5% Washington, D.C. 2.8% Orlando 3.5% Charlotte 3.8% Nearly 80% Total NOI Post Portfolio Geographic Concentration
  • 5.
    MMSWEquity Research Post’s CoreMarkets – Atlanta 1,500 1,600 1,700 1,800 1,900 2,000 2,100 2,200 2,300 2,400 1990 1992 1994 1996 1998 2000 2002 2004 Jobs(Thousands) • Represents 53.5% of total portfolio • Historically a high growth market results in over-supply  Among fastest growing MSA’s in 1990’s (pop. and employment)  Fortuitous economy has spurred much residential development • Asset disposition (and no acquisition) decreases revenue Atlanta Total Employment Source: Bureau of Economic Analysis
  • 6.
    MMSWEquity Research Post’s CoreMarkets – Atlanta Cont’d • Over supply causes riskiness in Post’s financial health Over supply in multi-family residential Renter’s market – concessions necessary to induce lease signing Rental revenue decrease Reduced earnings and value estimates Supply/demand imbalance will postpone recovery until at least 2005
  • 7.
    MMSWEquity Research Post’s CoreMarkets – Dallas • Represents 18.6% of total portfolio • Many similarities between Dallas and Atlanta • Dallas market specifics:  Over-building fueled by Telecom boom in 1990’s  Slightly lower occupancy rates compared with Atlanta  Absorption rates still suppressed  Lingering concessions keep effective rents low  Dallas market not on pace to improve as quickly as Atlanta
  • 8.
    MMSWEquity Research Post’s CoreMarkets – Tampa • Represents 7.9% of total portfolio • Better short-term outlook than Dallas or Atlanta • Tampa market specifics:  Over-supply generally not an issue  2004 Estimate: New Supply = 4,700 units New Demand = 4,800 units  Scarcity of developable land  Disciplined construction industry  Highest core market occupancy rates in 2003  Good market but relatively small portfolio allocation
  • 9.
    MMSWEquity Research Post’s CoreMarkets – Summary Post Properties Occupancy Trends in Core Markets Source: Post Properties Reports 88% 90% 92% 94% 96% 98% 2Q 02 3Q 02 4Q 02 1Q 03 2Q 03 3Q 03 4Q 03 1Q 04 2Q 04 3Q 04 4Q 04 1Q 05 2Q 05 Occupancy Atlanta Dallas Tampa
  • 10.
    MMSWEquity Research Growth Strategy •Post continues to divest underperforming assets • Expected sale of approximately $270 million of properties • Proceeds from asset sale serve 3 functions: 1. Pay down variable rate debt, reducing interest rate risk 2. Repurchase shares of preferred stock 3. Acquire properties in markets with high barriers to entry • Company Goals - Reduce exposure to Dallas and Atlanta markets Geographic diversification of core assets - Restructure and improve balance sheet
  • 11.
    MMSWEquity Research Growth Strategy– Impact in the Short Run • Analysis and subsequent recommendation is based upon a 12 month investment horizon. • We do not expect Post to feel substantial effects from disposition strategy for an extended period of time - Why Not??  Limited opportunities for further acquisitions  Ramping up of development pipeline likely will not deliver benefit until 2005/2006  Effectiveness of growth strategy unknown and management’s effectiveness remains a liability
  • 12.
    MMSWEquity Research Peer Comparison •Consensus estimates of FFO growth in 2004 for Post Properties falls well below that of industry peers - Post Properties: - 4.5% - Industry Estimate: 3.8% • Debt to asset ratio remains high relative to multifamily competition • Poorly positioned to take advantage of any possible recovery or improvement in national multifamily market fundamentals.
  • 13.
    MMSWEquity Research Investment Risks •NOI growth expected to remain negative in core markets through ‘04 • Geographic concentration -  Where will Post focus its acquisition/development efforts • Leverage / Capital market risk • Sustainability of dividend -  Company maintains 115% AFFO payout ratio  Given asset sales and subsequently low earnings estimates, the threat of an dividend reduction remains likely
  • 14.
    MMSWEquity Research Key RevenueAssumptions in FCFE Valuation • Unit decline in core markets (Georgia, Texas) • Unit growth in three markets (Florida, D.C., Tennessee) • Rent increase = 2.5% • Vacancy rate remains same as recent history • Asset growth negative in 2004, regains momentum by 2005 250 260 270 280 290 300 310 320 330 340 2001 2002 2003 2004 2005 2006 Revenue($Millions) Post Total Revenue
  • 15.
    MMSWEquity Research Valuation Methodology •FCFE analysis  Estimated equity discount rate = 12.82%  Branding sensitivity analysis = 10.50% Branding Effect High Low Discount Rate 12.82% 10.50% Price/Share $15.64 $18.61 • FFO per share analysis  Historic price multiple = 11.00  Price/share = $19.36
  • 16.
  • 17.
    MMSWEquity Research Questions? Scott Kwiecinski (608)271-6980 sjkwieci@wisc.edu Michael Morey (734) 417-7724 mcmorey@wisc.edu Mark Frey (608) 663-4849 mmfrey@wisc.edu Wintford Thornton Wintfordt@yahoo.com
  • 18.
    MMSWEquity Research Multi-Family SectorUpdate • General Economy  Interest rates  Employment • Apartment Specifics  Low urban multi-family cap rates (8.23% average)  Higher vacancy rates (6% in 2004, 3.6% in 2002)  Decreasing apartment construction  Demographics suggest positive outlook for long-term  Strong growth in sector not likely until at least 2005