Gráficos Docentes
•Download as DOCX, PDF•
0 likes•159 views

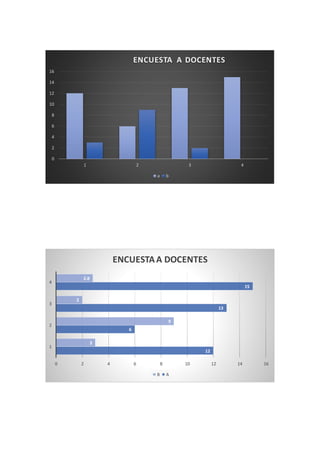
The document appears to be a survey of teachers that includes two charts. The first chart shows a range of numbers from 0 to 16 on the y-axis and labels 1, 2, 3, and 4 on the x-axis with corresponding values. The second chart shows labels A and B on the x-axis with values ranging from 0 to 16 on the y-axis, with higher numbers for A than B.

More Related Content
More from Nitta Kastt
More from Nitta Kastt (17)
Recently uploaded
Recently uploaded (20)
Gráficos Docentes
- 1. 16 14 12 10 8 6 4 2 0 ENCUESTA A DOCENTES 1 2 3 4 a b 12 6 13 15 3 9 2 2.8 0 2 4 6 8 10 12 14 16 4 3 2 1 ENCUESTA A DOCENTES B A