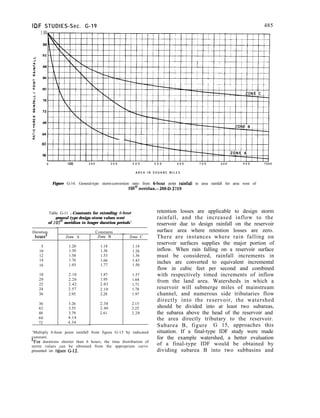
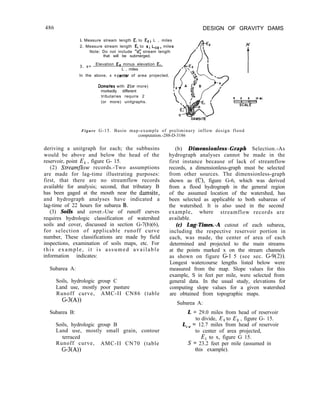
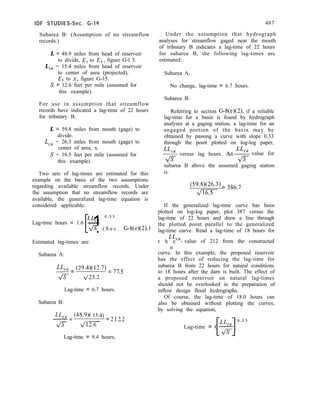
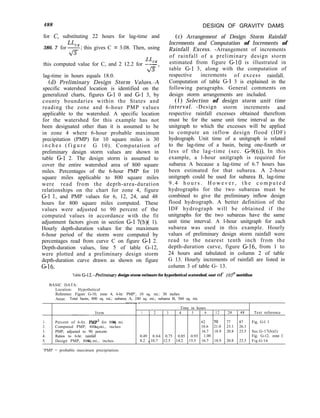
The document provides instructions and standards for designing concrete gravity dams. It serves as a guide for engineers and provides specialized technical information to assist in dam design. The manual covers all aspects of gravity dam design, from initial site investigations and layout, to stress analysis methods like the gravity and trial-load methods, to considerations for dynamic loading, construction, and the environment. It aims to support safe and adequate dam design while not relieving users of their design responsibilities.


![<<Chapter I
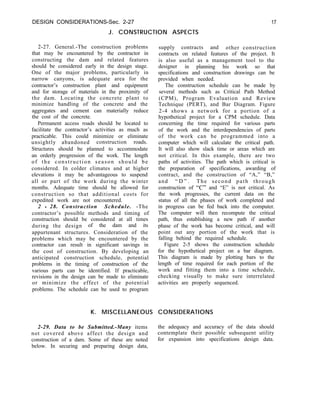
Introduction
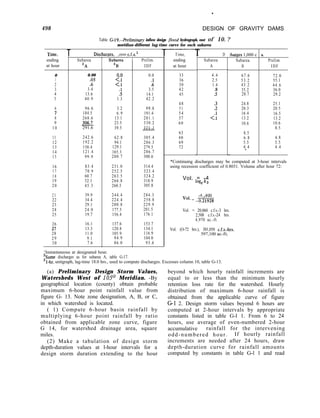
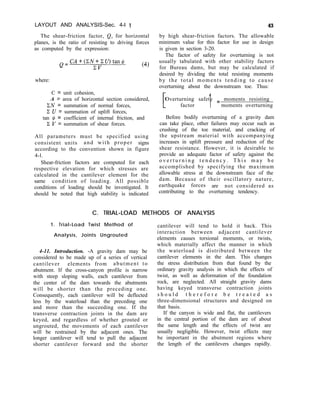
l-l. Scope.-A concrete gravity dam, as
discussed in this manual, is a solid concrete
structure so designed and shaped that its
weight is sufficient to ensure stability against
the effects of all imposed forces. Other types
of dams exist which also maintain their
stability through the principle of gravity, such
as buttress and hollow gravity dams, but these
are outside the scope of this book. Further,
discussions in this manual are limited to dams
on rock foundations and do not include smaller
dams generally less than 50 feet high which are
discussed in the Bureau of Reclamation
publication “Design of Small Dams”] 11 ’ .
The complete design of a concrete gravity
dam includes not only the determination of the
most efficient and economical proportions for
the water impounding structure, but also the
determination of the most suitable appurtenant
structures for the control and release of the
impounded water consistent with the purpose
or function of the project. This manual
presents the basic assumptions, design
considerations, methods of analysis, and
procedures used by designers within the
Engineering and Research Center, Bureau of
Reclamation, for the design of a gravity dam
and its appurtenances.
1-2. Classifications. -Gravity dams may be
classified by plan as straight gravity dams and
curved gravity dams, depending upon the axis
alinement. The principal difference in these
two classes is in the method of analysis.
Whereas a straight gravity dam would be
analyzed by one of the gravity methods
discussed in this manual (ch. IV), a curved
‘Numbers in brackets refer to items in the bibliography, sec.
l-5.
gravity dam would be analyzed as an arch dam
structure, as discussed in the Bureau’s manual
“Design of Arch Dams”[ 21 . For statistical
purposes, gravity dams are classified with
reference to their structural height. Dams up to
100 feet high are generally considered as low
dams, dams from 100 to 300 feet high as
medium-height dams, and dams over 300 feet
high as high dams.
l-3. General Dimensions. -For uniformity
within the Bureau of Reclamation, certain
general dimensions have been established and
are defined as follows:
The structural height of a concrete gravity
dam is defined as the difference in elevation
between the top of the dam and the lowest
point in the excavated foundation area,
exclusive of such features as narrow fault
zones. The top of the dam is the crown of the
roadway if a roadway crosses the dam, or the
level of the walkway if there is no roadway.
Although curb and sidewalk may extend higher
than the roadway, the level of the crown of the
roadway is considered to be the top of the
dam.
The hydraulic height, or height to which the
water rises behind the structure, is the
difference in elevation between the lowest
point of the original streambed at the axis of
the dam and the maximum controllable water
surface.
The length of the dam is defined as the
distance measured along the axis of the dam at
the level of the top of the main body of the
dam or of the roadway surf:iLs, on the crest,
from abutment contact to sbutment contact,
exclusive of abutment spillway; provided that,
if the spillway lies wholly within the dam and
1](https://image.slidesharecdn.com/gravitydams-230723194435-350300a0/85/GravityDams-pdf-33-320.jpg)
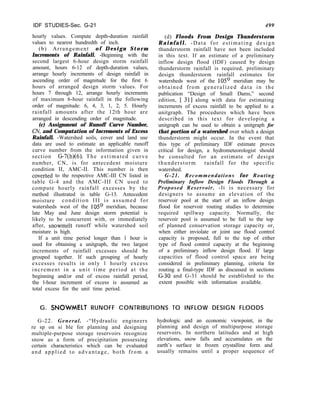
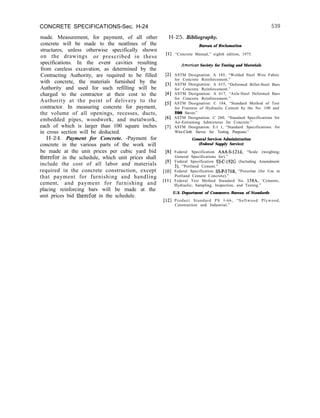
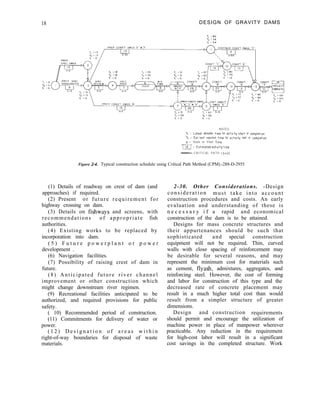
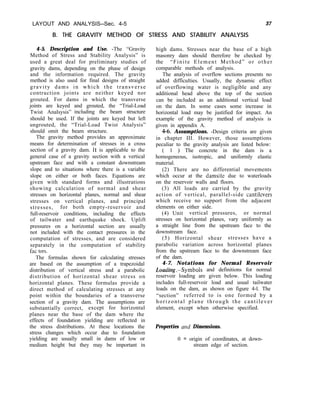
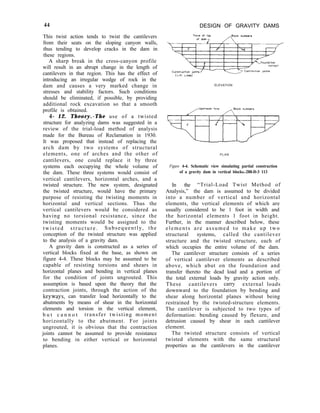
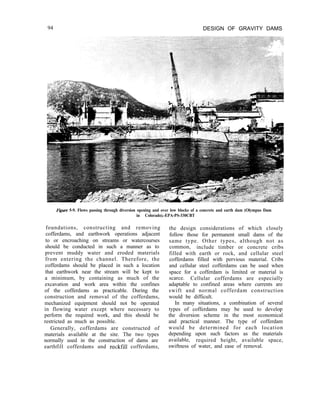
![2 DESIGN OF GRAVITY DAMS
would appear if cut by a plane. A beam section
is taken horizontally through the dam. A
cantilever section is a vertical section taken
normal to the axis and usually oriented with
the reservoir to the left.
A beum element, or beam, is a portion of a
gravity dam bounded by two horizontal planes
1 foot apart. For purposes of analysis the edges
of the elements are assumed to be vertical.
A cantilever element, or cantilever, is a
portion of a gravity dam bounded by two
vertical planes normal to the axis and 1 foot
apart,
A twisted structure consists of vertical
elements with the same structural properties as
the cantilevers, and of horizontal elements with
the same properties as the beams. The twisted
structure resists torsion in both the vertical and
horizontal planes.
The height of a cantilever is the vertical
distance between the base elevation of the
cantilever section and the top of the dam.
The thickness of a dam at any point is the
distance between upstream and downstream
faces along a line normal to the axis through
the point.
The abutment of a beam element is the
surface, at either end of the beam, which
contacts the rock of the canyon wall.
The crest of a dam is the top of the dam.
l-5. Bibliography.
[I] “Design of Small Dams,” second edition, Bureau of
Reclamation, 1973.
[2] “ D e s i g n o f A r c h D a m s , ” f i r s t e d i t i o n , B u r e a u o f
Reclamation, 1976.
not in any area especially excavated for the
spillway, the length is measured along the axis
extended through the spillway to the abutment
contacts.
The volume of a concrete dam should
include the main body of the dam and all mass
concrete appurtenances not separated from the
dam by construction or contraction joints.
Where a powerplant is constructed on the
downstream toe of the dam, the limit of
concrete in the dam should be taken as the
downstream face projected to the general
excavated foundation surface.
l-4. Gravity Dam Definitions. -Terminology
relating to the design and analysis of gravity
dams and definitions of the parts of gravity
dams as used in this manual are as follows:
A plan is an orthographic projection on a
horizontal plane, showing the main features of
a dam and its appurtenant works with respect
to the topography and available geological
data. A plan should be oriented so that the
direction of streamflow is toward the top or
toward the right of the drawing.
A profile is a developed elevation of the
intersection of a dam with the original ground
surface, rock surface, or excavation surface
along the axis of the dam, the upstream face,
the downstream face, or other designated
location.
The axis of the dam is a vertical reference
plane usually defined by the upstream edge of
the top of the dam.
A section is a representation of a dam as it](https://image.slidesharecdn.com/gravitydams-230723194435-350300a0/85/GravityDams-pdf-34-320.jpg)

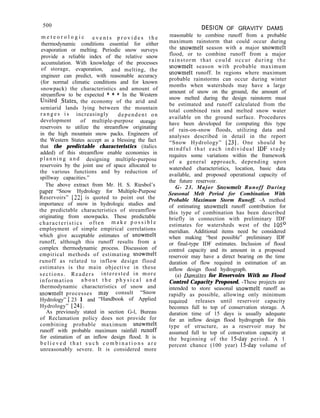
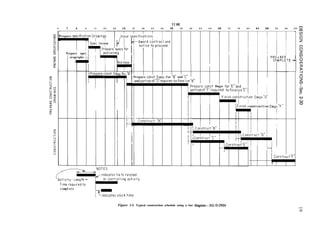
![DESIGN CONSIDERATIONS-Sec. 2-22 15
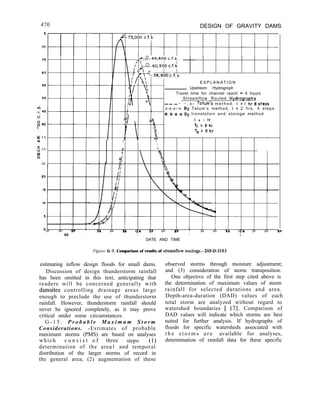
of obtaining the additional data required for
the feasibility stage. The program takes
advantage of any knowledge of special
conditions revealed during the appraisal
investigation. The drill holes become more
specifically oriented and increased in number
to better define the foundation conditions and
determine the amount of foundation treatment
required.
The rock specimens for laboratory testing
during the feasibility investigations are usually
nominal, as the actual decision for construction
of the dam has not yet been made. Test
specimens should be obtained to determine
more accurately physical properties of the
foundation rock and for petrographic
examination. Physical properties of joint or
fault samples may be estimated by using
conservative values from past testing of similar
materials. The similarity of materials can be
judged from the cores retrieved from the
drilling.
(c) Final Design Da&.-Final design data
are required prior to the preparation of the
specifications. A detailed foundation
investigation is conducted to obtain the final
design data. This investigation involves as many
drill holes as are necessary to accurately define
the following items:
(1) Strike, dip, thickness, continuity,
and composition of all faults and shears in
the foundation.
(2) Depth of overburden.
(3) Depth of weathering throughout
the foundation.
(4) Joint orientation and continuity.
(5) Lithologic variability.
( 6 ) P h y s i c a l p r o p e r t i e s o f t h e
foundation rock, including material in the
faults and shears.
The foundation investigation may involve,
besides diamond core drilling, detailed mapping
of surface geology and exploration of dozer
trenches and exploratory openings such as
tunnels, drifts, and shafts. The exploratory
openings can be excavated by contract prior to
issuing final specifications. These openings
provide the best possible means of examining
the foundation. In addition, they provide
excellent in situ testing locations and areas for
test specimen collection.
I n a d d i t i o n t o t e s t s p e c i m e n s f o r
determining the physical properties, specimens
may be required for final design for use in
determining the shear strength of the rock
types, healed joints, and open joints. This
information may be necessary to determine the
stability of the foundation and is discussed as
the shear-friction factor in subchapter F of
chapter III.
Permeability tests should be performed as a
routine matter during the drilling program. The
information obtained can be utilized in
establishing flow nets which will aid in
studying uplift conditions and establishing
drainage systems. The permeability testing
methods presently used by the Bureau of
Reclamation are described in designation E-18
of the Earth Manual [4] and the report
entitled “Drill Hole Water Tests-Technical
Instructions,” published by the Bureau of
Reclamation in July 1972.
2-22. Construction Geology. -The geology
as encountered in the excavation should be
defined and compared with the preexcavation
geology. Geologists and engineers should
consider carefully any geologic change and
check its relationship to the design of the
structure.
As-built geology drawings should be
developed even though revisions in design may
n o t b e r e q u i r e d by changed geologic
conditions, since operation and maintenance
problems may develop requiring de tailed
foundation information.
2-23. Foundation Analysis Methods. -In
most instances, a gravity dam is keyed into the
foundation so that the foundation will
normally be adequate if it has enough bearing
capacity to resist the loads from the dam.
However, a foundation may have faults, shears,
seams, joints, or zones of inferior rock that
could develop unstable rock masses when acted
on by the loads of the dam and reservoir. The
safety of the dam against sliding along a joint,
fault, or seam in the foundation can bc
determined by computing the shear-friction
factor of safety. This method of analysis is](https://image.slidesharecdn.com/gravitydams-230723194435-350300a0/85/GravityDams-pdf-47-320.jpg)
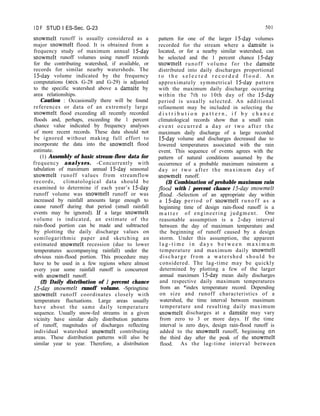
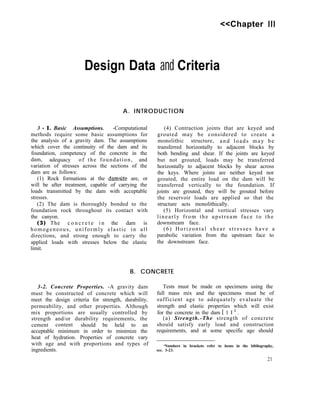
![16 DESIGN OF GRAVITY DAMS
Manual [4] and the report entitled “Drill Hole
Water Tests-Technical Instructions,”
published by the Bureau of Reclamation in
July 1972.
2-25. Laboratory Testing. -The following
laboratory tests are standard and the methods
and test interpretations should not vary
substantially from one laboratory to another.
A major problem involved with laboratory
testing is obtaining representative samples.
Sample size is often dictated by the laboratory
equipment and is a primary consideration.
Following is a list of laboratory tests:
explained in subchapter F of chapter III. If
there are several joints, faults, or seams along
which failure can occur, the potentially
unstable rock mass can be analyzed by a
method called rigid block analysis. This
method is explained in detail in subchapter F
of chapter IV. These methods of analysis may
also be applied to slope stability problems.
The data required for these two methods of
analysis are :
(1) Physical properties.
(2) Shearing and sliding strengths of
the discontinuities and the rock.
(3) Dip and strike of the faults, shears,
seams, and joints.
(4) Limits of the potentially unstable
rock mass.
(5) Uplift pressures on the failure
surfaces.
(6) Loads to be applied to the rock
mass.
When a foundation is interspersed by many
faults, shears, joints, seams, and zones of
inferior rock, the finite element method of
analysis can be used to determine the bearing
capacity and the amount of foundation
treatment required to reduce or eliminate areas
of tension in the foundation. The description
of this method can be found in subchapter E of
chapter IV. In addition to the data required for
the rigid block analysis, the finite element
analysis requires the deformation moduli of the
various parts of the foundation.
2-24. In Situ Testing.-In situ shear tests
[ 51 are more expensive than similar laboratory
tests; consequently, comparatively few can be
run. The advantage of a larger test surface may
require that a few in situ tests be supplemented
by a greater number of laboratory tests. The
shearing strength relative to both horizontal
and vertical movement should be obtained by
either one or a combination of both methods.
Foundation permeability tests may be run in
conjunction with the drilling program or as a
special program. The tests should be performed
according to designation E-18 of the Earth
Physical Properties Tests
(1) Compressive strength
(2) Elastic modulus
(3) Poisson’s ratio
(4) Bulk specific gravity
(5) Porosity
(6) Absorption
Shear Tests
(1) Direct shear 1 Perform on intact
specimens and
(2) Triaxial shear I those with healed
joints
(3) Sliding friction Perform on open
joints
Other Tests
(1) Solubility
(2) Petrographic analysis
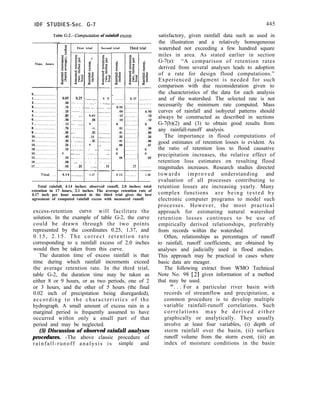
2 - 2 6. Consistency of Presentation of
Data. It is important that the design engineers,
laboratory personnel, and geologists be able to
d r a w t h e s a m e conclusions from the
information presented in the investigations.
T h e s t a n d a r d i z a t i o n o f t h e g e o l o g i c
information and laboratory test results is
therefore essential and is becoming increasingly
so with the newer methods of analysis.](https://image.slidesharecdn.com/gravitydams-230723194435-350300a0/85/GravityDams-pdf-48-320.jpg)

![22
have the specified compressive strength as
determined by the designer. This specific age is
often 365 days but may vary from one
structure to another.
Tensile strength of the concrete mix should
be determined as a companion test series using
the direct tensile test method.
Shear strength is a combination of internal
friction, which varies with the normal
compressive stress, and cohesive strength.
Companion series of shear strength tests should
be conducted at several different normal stress
values covering the range of normal stresses to
be expected in the dam. These values should be
used to obtain a curve of shear strength versus
normal stress.
(b) Elastic Properties.-Concrete is not a
truly elastic material. When concrete is
subjected to a sustained load such as may be
expected in a dam, the deformation produced
by that load may be divided into two
parts-the elastic deformation, which occurs
immediately due to the instantaneous modulus
of elasticity; and the inelastic deformation, or
creep, which develops gradually and continues
for an indefinite time. To account for the
effects of creep, the sustained modulus of
elasticity is used in the design and analysis of a
concrete dam.
The stress-strain curve is, for all practical
purposes, a straight line within the range of
usual working stresses. Although the modulus
of elasticity is not directly proportional to the
strength, the high strength concretes usually
have higher moduli. The usual range of the
instantaneous modulus of elasticity for
concrete at 28-day age is between 2.0 x 10”
and 6.0 x lo6 pounds per square inch.
(c) Thermal Properties.-The effects of
temperature change on a gravity dam are
dependent on the thermal properties of the
concrete. Thermal properties necessary for the
evaluation of temperature effects are the
coefficient of thermal expansion, thermal
conductivity, and specific heat [7]. The
coefficient of thermal expansion is the length
change per unit length per degree temperature
change. Thermal conductivity is the rate of
heat conduction through a unit thickness over
a unit area of the material subjected to a unit
DESIGN OF GRAVITY DAMS
temperature difference between faces. The
specific heat is defined as the amount of heat
required to raise the temperature of a unit mass
of the material 1 degree. Diffusivity of
concrete is an index of the facility with which
concrete will undergo temperature change.
Diffusivity is a function of the values of
specific heat, thermal conductivity, and
density.
(d) Dynamic Properties.-Concrete, when
subjected to dynamic loadings, may exhibit
characteristics unlike those occurring during
static loadings. Testing is presently underway
in the Bureau’s laboratory to determine the
properties of concrete when subjected to
dynamic loading. Until sufficient test data are
available, static strengths and the instantaneous
modulus of elasticity should be used.
(e) Other Properties.-In addition to the
strength, elastic modulus, and thermal
properties, several other properties of concrete
should be evaluated during the laboratory
testing program. These properties, which must
b e d e t e r m i n e d f o r c o m p u t a t i o n s o f
deformations and stresses in the concrete
sfrucfures, are Poisson’s ratio, unit weight, and
any autogenous growth or drying shrinkage.
(f) Average Concrete Properties.-For
preliminary studies until laboratory test data
are available, the necessary values may be
estimated from published data [2] for similar
tests. Until long-term load tests are made to
determine the effects of creep, the sustained
modulus of elasticity should be taken as 60 to
70 percent of the laboratory value of the
instantaneous modulus of elasticity.
If no tests or published data are available,
the following may be assumed for preliminary
studies:
Specified compressive strength = 3,000 to
5,000 p.s.i.
Tensile strength = 4 to 6 percent of the
compressive strength
Shear strength:
Cohesion = 10 percent of the compressive
strength
Coefficient of internal friction = 1 .O
Sustained modulus of elasticity = 3.0 x lo6
p.s.i. (static load including effects of
creep)](https://image.slidesharecdn.com/gravitydams-230723194435-350300a0/85/GravityDams-pdf-54-320.jpg)
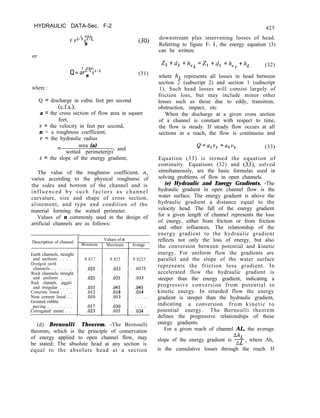
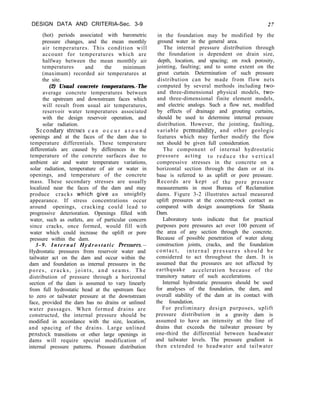
![DESIGN DATA AND CRITERIA-Sec. 3-3
Instantaneous modulus of elasticity = 5.0 x
lo6 p.s.i. (dynamic or short time load)
Coefficient of thermal expansion = 5.0 x
1 Om6 per degree F.
23
Poisson’s ratio = 0.20
Unit weight of concrete = 150 pounds per
cubic foot.
C. FOUNDATION
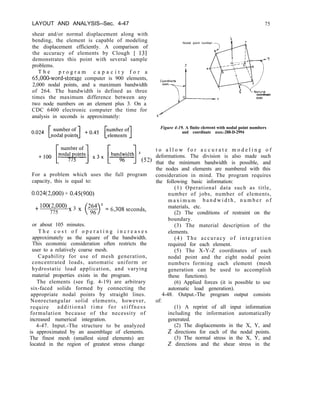
3-3. Introduction.-Certain information
concerning the foundation is required for
design of the gravity dam section. The design
of the dam and any treatment to the
foundation (see sec. 6-3) to improve its
properties are considered separate problems. If
treatments are applied to the foundation, the
data used for the design of the dam should be
based on the properties of the foundation after
treatment. A geologic investigation is required
to determine the general suitability of the site
and to identify the types and structures of the
materials to be encountered. After these
identifications have been made the following
three parameters should be determined:
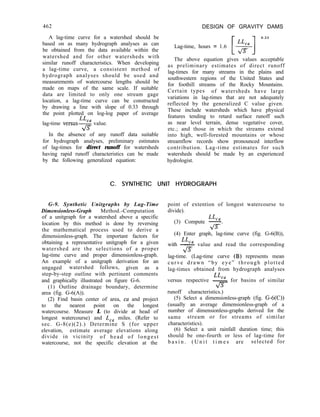
(1) For each material the shear strengths of
intact portions, the sliding friction strengths of
discontinuities, and the shear strength at each
interface with a different material (including
the strength at the interface of concrete and
the material exposed on the completed
excavated surface).
(2) The permeability of each material.
(3) The deformation modulus of the
foundation.
The discussion of foundation investigation in
chapter II (sets. 2-20 through 2-26) lists the
physical properties normally required and the
samples desired for various foundation
materials.
3 -4. Foundation Deformation. -Accurate
knowledge of the modulus of deformation of
the foundation of a gravity dam is required to:
( 1) Determine the extent of relative
deformation between locations where physical
properties vary along the foundation in the
vertical or horizontal directions.
(2) Determine the stress concentrations in
the dam or foundation due to local low
modulus regions adjacent to or below the dam.
(3) Determine the stress distribution to be
used in detailed stability studies.
The foundation investigation should provide
information related to or giving deformation
moduli and elastic moduli. (Deformation
modulus is the ratio of stress to elastic plus
inelastic strain. Elastic modulus is the ratio of
stress to elastic strain.) The information
includes elastic modulus of drill core
specimens, elastic modulus and deformation
modulus from in situ jacking tests, deformation
modulus of fault or shear zone material, and
logs of the jointing occurring in recovered drill
cores. Knowledge of the variation in materials
and their relative prevalence at various
locations along the foundation is provided by
the logs of drill holes and by any tunnels in the
foundation.
When the composition of the foundation is
nearly uniform over the extent of the dam
contact, has a regular jointing pattern, and is
free of low modulus seams, the three
conditions listed above do not exist and thus
an accurate deformation modulus is not
required. An estimate based on reduction of
the elastic modulus of drill core specimens will
suffice. However, when a variation of materials,
an irregular jointing pattern, and fault and
shear zones exist, the deformation moduli of
each type of material in the foundation will be
required for design. The analysis of the
interaction of the dam and foundation may be
accomplished by using finite element analysis.
The moduli values are determined by
laboratory or in situ testing, and if necessary
are modified to account for factors not
included in the initial testing. The modification
to the modulus value of rock may be
determined according to the rock quality index
[3] or joint shear index [4]. Modification of
the moduli values for shear or fault zone
material may be required if the geometry of](https://image.slidesharecdn.com/gravitydams-230723194435-350300a0/85/GravityDams-pdf-55-320.jpg)
![26
This is about 70 percent of the maximum shear
strength computed above without considering
deformation.
In some situations, the potential sliding
surface comprised of several different materials
may exhibit greater total shear resistance after
any intact materials are sheared. For example,
if the cohesive strength of intact rock is low
but the normal load acting on the total surface
is large, the sliding friction strength of the
combined materials can exceed the shear
resistance determined before the rock is
sheared. For this reason, a second analysis
should be performed which considers only the
sliding friction strength of the surfaces.
3-6. Foundation Permeability. -The design
of a gravity dam and its foundation requires a
knowledge of the hydrostatic pressure
distribution throughout the foundation. The
exit gradient for shear zone materials that
DESIGN OF GRAVITY DAMS
surface near the downstream toe of the dam
should also be determined to check against the
possibility of piping (see sec. 6-4).
The laboratory values for permeability of
sample specimens are applicable only to that
portion or portions of the foundation which
they represent. The permeability is controlled
by a network of geological features such as
joints, faults, and shear zones. The
permeability of the geologic features can be
determined best by in situ testing. Pressure
distributions for design should include the
appropriate influences of the permeability and
extent of all the foundation materials and
geologic features. Such a determination may be
made by several methods including two- and
three-dimensional physical models, two- and
three-dimensional finite element models, and
electric analogs.
D. LOADS
3-7. Reservoir and Tailwater. -Reservoir and
tailwater loads to be applied to the structure
are obtained from reservoir operation studies
and tailwater curves. These studies are based on
operating and hydrologic data such as reservoir
capacity, storage allocations, streamflow
records, flood hydrographs, and reservoir
releases for all purposes. A design reservoir can
be derived from these operation studies which
will reflect a normal high water surface.
The hydrostatic pressure at any point on the
dam is equal to the hydraulic head at that
point times the unit weight of water (62.4 lb.
per cu. ft.).
The normal design reservoir elevation is the
highest elevation that water is normally stored.
It is the Top of Joint Use Capacity, if joint use
capacity is included. If not, it is the Top of
Active Conservation Capacity. For definitions
of reservoir capacities, see section 2-9.
Maximum design reservoir elevation is the
highest anticipated water surface elevation and
usually occurs in conjunction with the routing
of the inflow design flood through the
reservoir.
The tailwater elevation used with a
particular reservoir elevation should be the
minimum that can be expected to occur with
that reservoir elevation.
3-8. Temperature. -Volumetric changes due
to temperature change [7] will transfer load
across transverse contraction joints if the joints
are grouted. These horizontal thrusts will then
result in twist effects and in additional loading
of the abutments. These effects may or may
not be beneficial from a stress and stability
standpoint and should be investigated using the
“Trial-Load Twist Method of Analysis”
discussed in chapter IV (sets. 4-25 through
4-29).
When making studies to determine concrete
temperature loads, varying weather conditions
can be applied. Similarly, a widely fluctuating
reservoir water surface will affect the concrete
temperatures. In determining temperature
loads, t h e f o l l o w i n g conditions and
temperatures are used:
( 1) Usual weather conditions.-The
combination of daily air temperatures, a
l-week cycle representative of the cold](https://image.slidesharecdn.com/gravitydams-230723194435-350300a0/85/GravityDams-pdf-58-320.jpg)
![DESIGN DATA AND CRITERIA-Sec. 3-12
approximate. Good analytical procedures exist
for computing ice pressures, but the accuracy
of results is dependent upon certain physical
data which must come from field and
laboratory tests [8].
Ice pressure is created by thermal expansion
of the ice and by wind drag. Pressures caused
by thermal expansion are dependent on the
temperature rise of the ice, the thickness of the
ice sheet, the coefficient of expansion, the
elastic modulus, and the strength of the ice.
Wind drag is dependent on the size and shape
of the exposed area, the roughness of the
surface, and the direction and velocity of the
wind. Ice loads are usually transitory. Not all
dams will be subjected to ice pressure, and the
designer should decide after consideration of
the above factors whether an allowance for ice
pressure is appropriate. The method of
Monfore and Taylor [9] may be used to
determine the anticipated ice pressure. An
acceptable estimate of ice load to be expected
on the face of a structure may be taken as
10,000 pounds per linear foot of contact
between the ice and the dam, for an assumed
ice depth of 2 feet or more when basic data are
not available to compute pressures.
3-12. Sift.-Not all dams will be subjected to
silt pressure, and the designer should consider
all available hydrologic data before deciding
whether an allowance for silt pressure is
necessary. Horizontal silt pressure is assumed
to be equivalent to that of a fluid weighing 85
pounds per cubic foot. Vertical silt pressure is
determined as if silt were a soil having a wet
density of 120 pounds per cubic foot, the
magnitude of pressure varying directly with
depth. These values include the effects of water
within the silt.
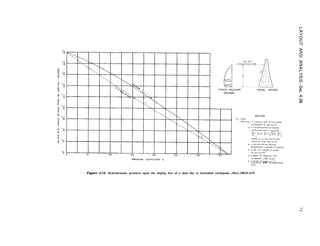
3- 13. Earthquake. -Concrete dams are
elastic structures which may be excited to
resonance w h e n subjected to seismic
disturbances. Two steps are necessary to obtain
loading on a concrete dam due to such a
disturbance. First, an estimate of magnitude
and location must be made of the earthquake
to which the dam will be subjected and the
resulting rock motions at the site determined.
The second step is the analysis of the response
of the dam to the earthquake by either the
29
response spectrum or time-history method.
Most earthquakes are caused by crustal
movements of the earth along faults. Geologic
examinations of the area should be made to
locate any faults, determine how recently they
have been active, and estimate the probable
length of fault. Seismological records should
also be studied to determine the magnitude and
location of any earthquakes recorded in the
area. Based on these geological and historical
data, hypothetical earthquakes usually of
magnitudes greater than the historical events
are estimated for any active faults in the area.
These earthquakes are considered to be the
most severe earthquakes associated with the
faults and are assumed to occur at the point on
the fault closest to the site. This defines the
Maximum Credible Earthquake and its location
in terms of Richter Magnitude M and distance
d to the causative fault.
Methods of determining a design earthquake
that represents an operating-basis event are
under development . These methods should
consider historical records to obtain frequency
of occurrence versus magnitude, useful life of
the structure, and a statistical approach to
determine probable occurrence of various
magnitude earthquakes during the life of the
structure. When future developments produce
such methods, suitable safety factors will be
included in the criteria.
The necessary parameters to be determined
at the site using attenuation methods [ 101 are
acceleration, predominant period, duration of
shaking, and frequency content.
Attenuation from the fault to the site is
generally included directly in the formulas used
to compute the basic data for response spectra.
A response spectrum graphically represents the
maximum response of a structure with one
degree of freedom having a specific damping
and subjected to a particular excitation. A
response spectrum should be determined for
each magnitude-distance relationship by each
of three methods as described in appendix D of
reference [ 101. The design response spectrum
of a structure at a site is the composite of the
above spectra.
Time-history analyses of a dam are sometimes
desirable. The required accelerograms may be](https://image.slidesharecdn.com/gravitydams-230723194435-350300a0/85/GravityDams-pdf-61-320.jpg)
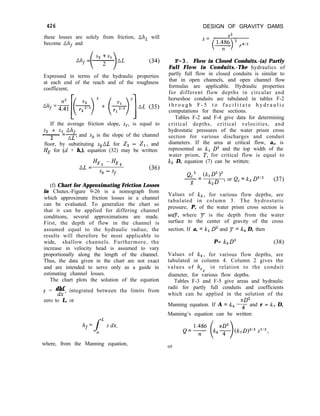
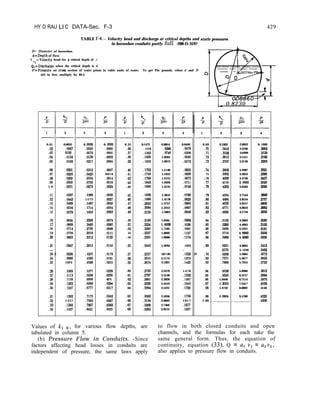
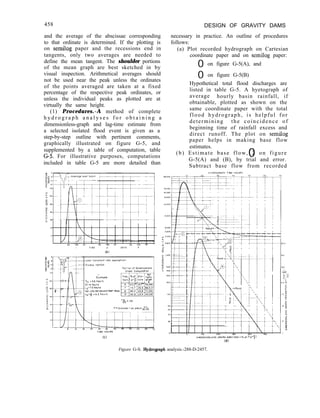
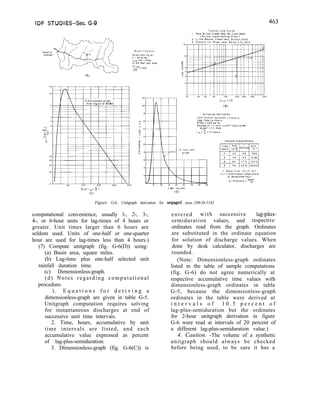
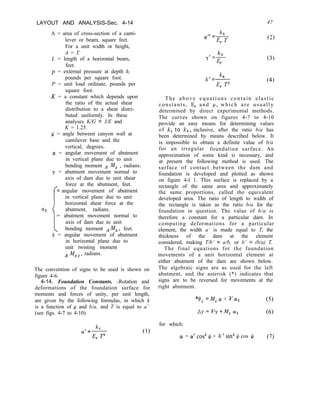
![D E S I G N D A T A AND CRITERIA--Sec. 3-22 33
Reservoir w a t e r s u r f a c e - :
“l-l
c e n t e r o f grovlty o f
8
(A) VERTICAL CROSS-SECTION
Al
“-----1,
(B) PRESSURE DIAGRAM WITHOUT UPLIFT
:t.-ril--
8
4
(C) UPLIFT PRESSURE DIAGRAM
T
<-
3
(D) COMBINED PRESSURE DIAGRAM
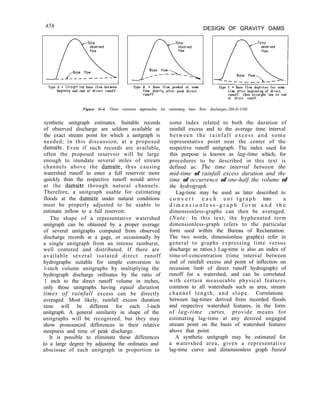
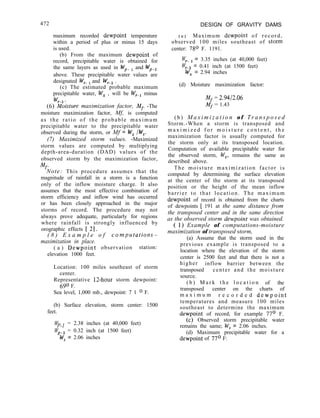
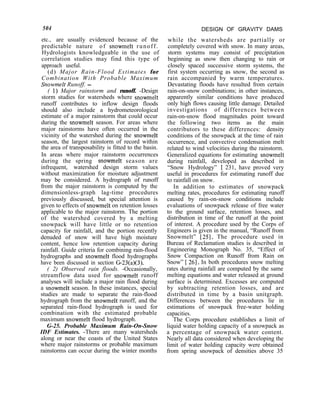
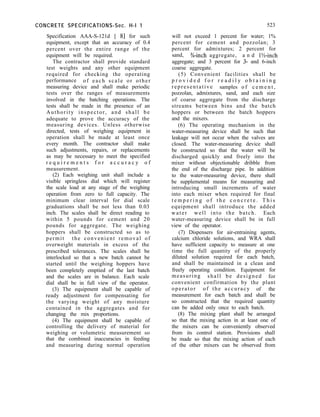
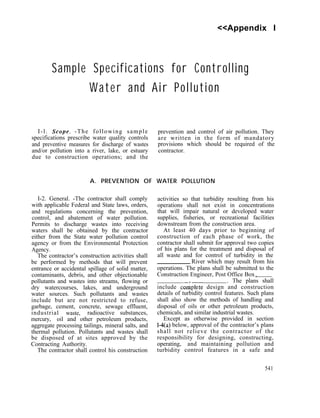
D I A G R A M S O F B A S E P R E S S U R E S
A C T I N G O N A G R A V I T Y D A M
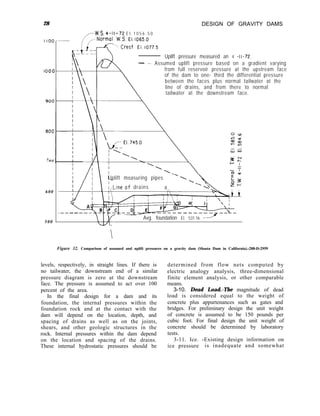
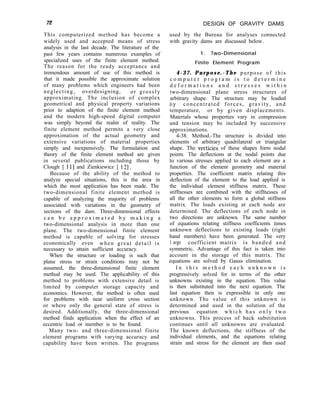
Figure 3-3. Foundation base pressures for a gravity
dam.-288-D-25 10
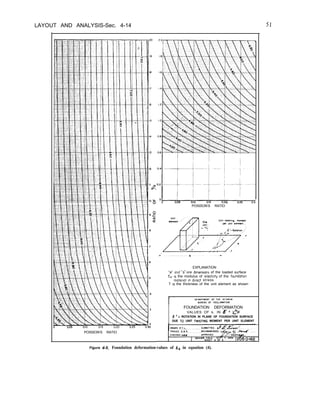
using equations (5) and (6) may be required to
obtain adequate agreement between the value
used for T in equation (5) and the value
computed for T1 in equation (6).
The untracked area of the base is substituted
for A in equation (4). The section is considered
satisfactory for any of these loading conditions
if the stress at the downstream face, from
equation (7), does not exceed the allowable
stress, and the shear-friction factor of safety is
sufficient to ensure stability. A shear-friction
factor of safety greater than 2.0 would be
con sidered satisfactory for the Unusual
Loading Combination and greater than 1.0 for
the Extreme Loading Combination.
A gravity dam should be considered safe
against overturning if B5, the ordinate in figure
3-3(D), is less than the allowable stresses in the
concrete and the foundation rock for the
appropriate loading combinations.
3-22. Foundation Stability. Joints, shears,
and faults which form identifiable blocks of
rock are often present in the foundation.
Effects of such planes of weakness on the
stability of the foundation should be carefully
evaluated. Methods of analysis for foundation
stab ilitv under these circumstances are
discussed in section 4-50. The determination of
effective shear resistance for such foundation
conditions is given in detail in section 3-5.
The factor of safety against sliding failure of
these foundation blocks, as determined by the
shear-friction factor, Q, using equation (4),
should be greater than 4.0 for the Usual
Loading Combination, 2.7 for the Unusual
Loading Combination, and 1.3 for the Extreme
Loading Combination. If the computed safety
factor is less than required, foundation
treatment can be included to increase the
safety factor to the required value.
Treatment to accomplish specific stability
objectives such as prevention of differential
displacements (see sec. 4-51) or stress
concentrations due to bridging (see sec. 4-52)
should be designed to produce the safety factor
required for the loading combination being
analyzed.
G. BIBLIOGRAPHY
3-23. Bibliography. -
[ 1] “Concrete Manual,” Bureau of Reclamation, eighth
edition, 1975.
[2] “Properties of Mass Concrete in Bureau of Reclamation
Dams,” Concrete Laboratory Report No. C-1009,
Bureau of Reclamation, 1961.](https://image.slidesharecdn.com/gravitydams-230723194435-350300a0/85/GravityDams-pdf-65-320.jpg)
![34 DESIGN OF GRAVITY DAMS
[3] Stagg, K. G., and Zienkiewicz, 0. C., “Rock Mechanics
in Engineering Practice,” John Wiley & Sons, London,
England, 1968.
[4] Von Thun, J. L., and Tarbox, G. S., “Deformation
Moduli Determined by Joint Shear Index and Shear
Catalog,” Proceedings, International Symposium on
Rock Mechanics, Nancy, France, 197 1.
[S] “Physical Properties of Some Typical Foundation
Rocks,” Concrete Laboratory Report No. SP-39, Bureau
of Reclamation, 1953.
[6] Link, Harald, “The Sliding Stability of Dams,” Water
Power-Part I, March 1969; Part II, April 1969; Part III,
May 1969, London, England.
[7] Townsend, C. L., “Control of Cracking in Mass Concrete
Structures,” Engineering Monograph No. 34, Bureau of
Reclamation, 1965.
[8] Monfore, G. E., “Experimental Investigations by the
Bureau of Reclamation,” Trans. ASCE, vol. 119, 1954,
p. 26.
[9] Monfore, G. E., and Taylor, F. W., “The Problem of an
E x p a n d i n g I c e Sheet,” B u r e a u o f Reclamation
Memorandum, March 18, 1948.
[lo] Boggs, H. L., Campbell, R. B., Klein, I. E., Kramer, R.
W., McCafferty, R. M., and Roehm, L. H., “Methods for
Estimating Design Earthquake Rock Motions,” Bureau
of Reclamation, April 1972.
[ 111 “Design of Small Dams,” Bureau of Reclamation, second
edition, 1973.](https://image.slidesharecdn.com/gravitydams-230723194435-350300a0/85/GravityDams-pdf-66-320.jpg)
![36
used in stress analysis methods to determine
loadings for computing stresses due to
earthquake.
A discussion of foundation analyses is given
in sections 4-49 through 4-52. A dam is no
better than its foundation, and therefore an
evaluation of the foundation behavior is
necessary to ensure a competent load-bearing
system consisting of the dam and the
foundation. Analytical methods are presented
to evaluate foundation stability and local
overstressing due to foundation deficiencies.
Certain special, rigorous methods of analysis,
such as the “Slab Analogy Method” [ I] ’ and
DESIGN OF GRAVITY DAMS
“Lattice Analogy Method” [2], which may be
used for the determination of nonlinear stress
distributions are included in lesser detail in
appendix D along with photoelastic model
studies.
(a) Level of Design, -The level of design for
a gravity dam, whether appraisal, feasibility, or
final, differs only by the level of investigation
used to determine design data. Details of these
levels of investigation in the field are discussed
in section 2-21. The levels of investigations in
the laboratory are usually dependent on the
levels of field investigations.
A. LAYOUT
4-2. Nonoverflow Section. -The shape of
the maximum nonoverflow section is
determined by the prescribed loading
conditions, the shear resistance of the rock,
and the height of the maximum section. The
upstream face of a gravity dam is usually made
vertical to concentrate the concrete weight at
the upstream face where it acts to overcome
the effects of the reservoir waterload. Except
where additional thickness is required at the
crest, as discussed below, the downstream face
will usually have a uniform slope which is
determined by both stress and stability
requirements at the base. This slope will be
adequate to meet the stress and stability
requirements at the higher elevations unless a
large opening is included in the dam. The crest
thickness may be dictated by roadway or other
access requirements, but in any case it should
be adequate to withstand possible ice pressures
and the impact of floating objects. When
additional crest thickness is used, the
downstream face should be vertical from the
downstream edge of the crest to an intersection
with the sloping downstream face.
A batter may be used on the lower part of
the upstream face to increase the thickness at
the base to improve the sliding safety of the
base. However, unacceptable stresses may
develop at the heel of the dam because of the
‘Numbers in brackets refer to items in the bibliography, sec.
4-55.
change in moment arm for the concrete weight
about the center of gravity of the base. If a
batter is used, stresses and stability should be
checked where the batter intersects the vertical
upstream face. The dam should be analyzed at
any other changes in slope on either face.
4-3. Spillway Section. -The overflow or
spillway section should be designed in a similar
manner to the nonoverflow section. The curves
describing the spillway crest and the junction
of the slope with the energy dissipator are
designed to meet hydraulic requirements
discussed in chapter IX. The slope joining these
curves should be tangent to each curve and, if
practicable, parallel to the downstream slope
on the nonoverflow section. The spillway
section should be checked for compliance with
stress and stability requirements. An upstream
batter may be used on the spillway section
under the same conditions as for the
nonoverflow section. Figure B-l in appendix B
is a typical layout drawing of a gravity dam
showing a nonoverflow section, a typical
spillway section, a plan, and a profile.
4-4. Freeboard.-Current Bureau practice is
to allow the maximum water surface elevation
to be coincident with the top of the
nonoverflow section of the dam, and to
consider that the standard 3.5-foot-high solid
parapet acts as a freeboard. Exceptional cases
may point to a need for more freeboard,
depending on the anticipated wave height.](https://image.slidesharecdn.com/gravitydams-230723194435-350300a0/85/GravityDams-pdf-68-320.jpg)
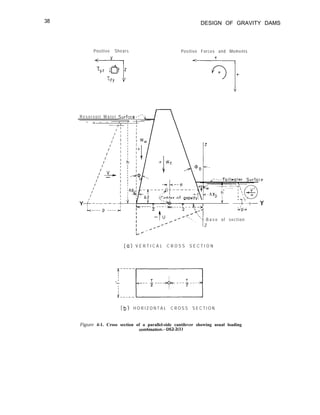
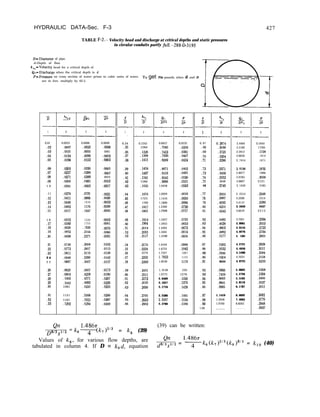
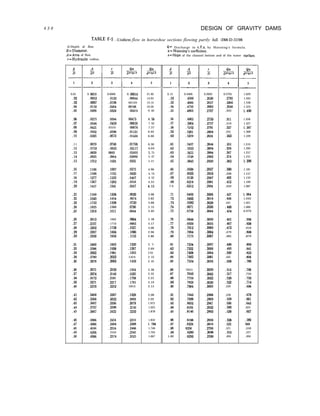
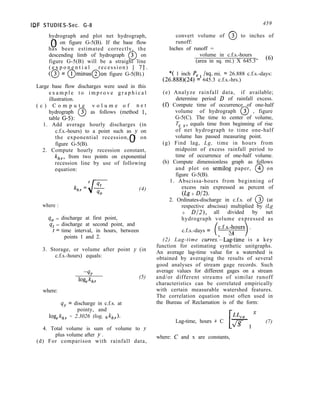
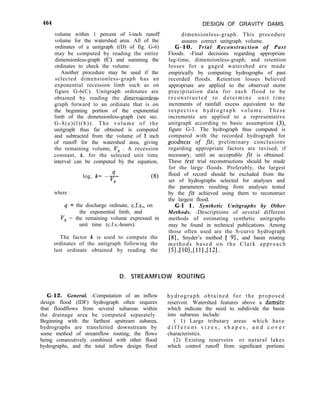
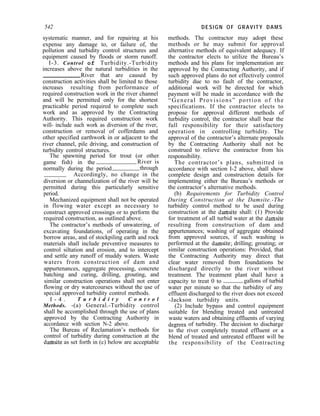
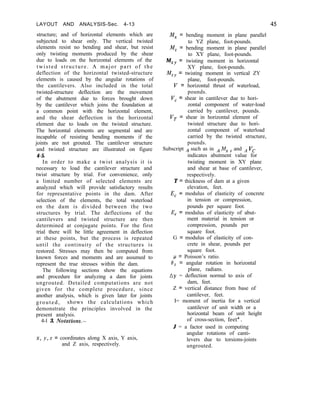
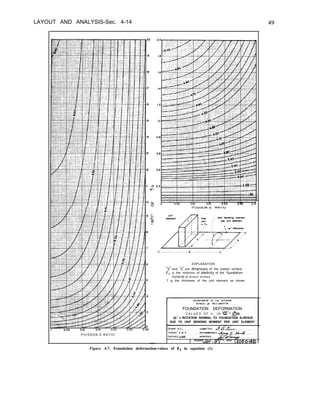
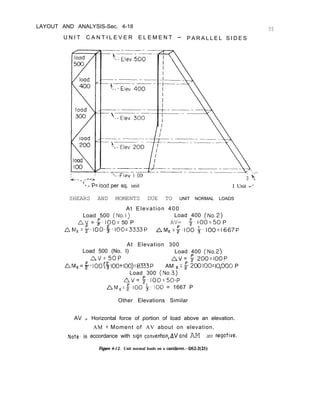
![LAYOUT AND ANALYSIS-Sec. 4-10
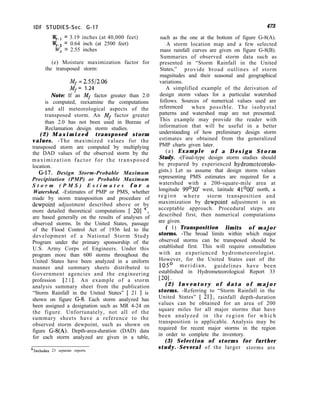
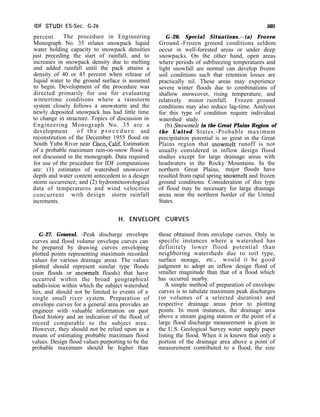
DERIVATION OF STRESS FORMULAE
(HORIZONTAL E A R T H Q U A K E U P S T R E A M )
From Figure o
To molntoin rotational equilibrium about A.
(1
ZYU
dy)k = (r
2 yzudz) +
Tzyu = 1 yzu
To mointoin vertical equilibrium,
(P+P)E)dy-ozudy -fyzudz = 0
2 = ton+”
lyzu = 1 zyu = - [uzU - p - PE] tonhJ
F r o m F i g u r e b
To mointain rototionol equilibrium about B,
(-Tzyody)+ =(-ryzodz)+-
I[- ZYD = TyzD
To mointoin vertical equilibrium,
(P’-p;)dy - 4ody -( -Tyzo)dz = 0
TyzDdZ = OZD dy - ( P ’ - P ; ) dy
TyzD = bZD- (P’- P;)] d y
d z
--ryZO=~~y0=[~~0- p’+ PIE] ton@D
(a)- FORCES ACTING ON
DIFFERENTIAL ELEMENT AT
UPSTREAM FACE
F r o m F i g u r e C
To molntoin rototionol equilibrium obout C,
(rIudr)!$ =O
-rI”=o
To maintain vertical equilibrium,
qudy-[(pfpE)ds]sln@u - (OIudr)cos~,f(Zrudr)sin~u=O
%u =
uzudy -[(P + p,)ds]sin@u
d r cos+u
d s = d y sin&
d r = d y cos@u
01, =
Uzudy - ( P + PE )dY sin’%
d y cos*@u
Then :
uIll
= Uzu secz Qu- ( p + p,)ton* 0~
In 0 similor manner:
DID= ozD Set’ QD- (PI- &)ton*@D
(b)- FORCES ACTING ON
DIFFERENTIAL ELEMENT AT
DOWNSTREAM FACE
(c) - D I F F E R E N T I A L E L E M E N T
AT UPSTREAM FACE
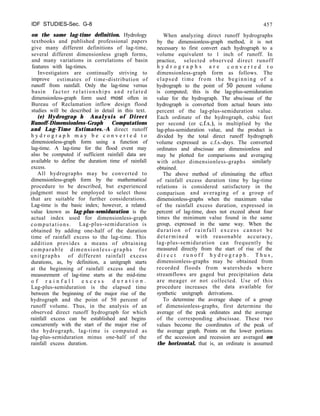
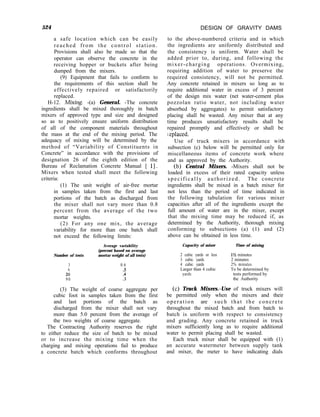
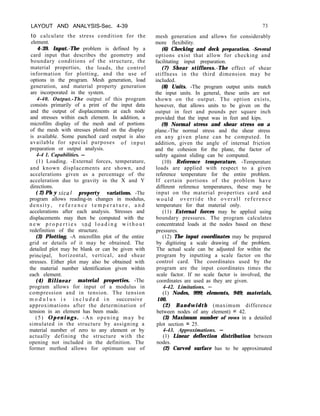
41
Figure 4-2. Derivation of stress formulae for a concrete gravity dam.-DS2-2(4)](https://image.slidesharecdn.com/gravitydams-230723194435-350300a0/85/GravityDams-pdf-73-320.jpg)
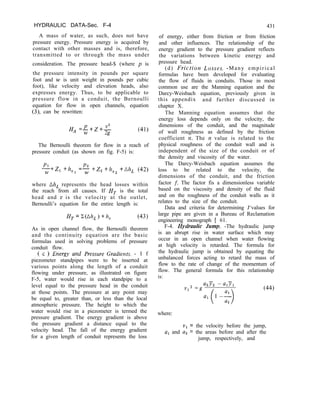
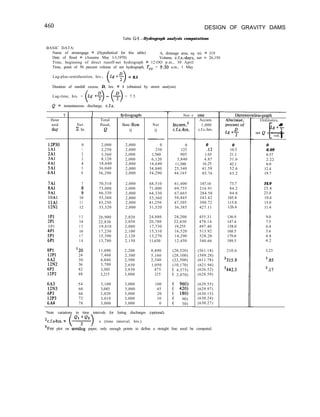
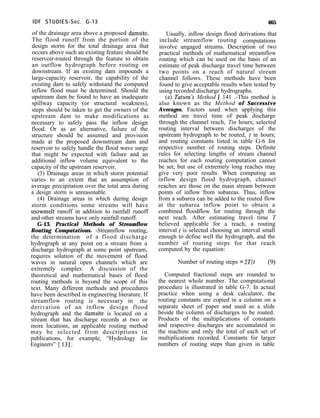
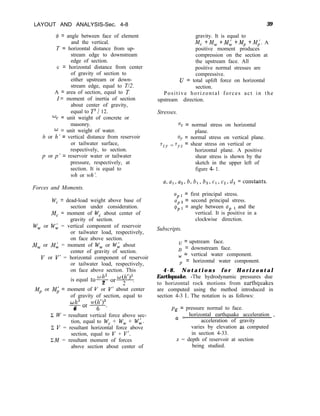
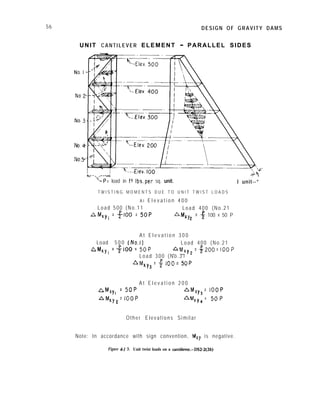
![42
N O R M A L S T R E S S
O N H O R I Z O N T A L P L A N E
O N “ERTlCAL P L A N E
N O R M A L S T R E S S
O N YERTICAL P L A N E
DESIGN OF GRAVITY DAMS
STRESSES IN STRAIGHT GRAVITY DAMS, INCLUDING EFFECTS OF
TAILWATER AND HORIZONTAL EARTHQUAKE
IU*=a+by
NORMAL STRESS ON HORIZONTAL PLANE, bz
al~az==w-fzE
T TZ
b= 12rM
TJ
SHEAR STRESS ON HORIZONTALOR VERTICAL PLANE,& = TSru
II Tzy = “tyz - (I, + b,y + c,y*
a,=TCZ D = (a,, - PI?* P:) t a n 00
b,=-$(+ 2~Zyu+4~zyo)
Ct=~(y+3Tzy" + 3fzyD i
Check at face for y = T, Zzy”=-(u~“-P~fPE)tonQ”
Note.(‘“se I+1 slg” If horlzontol acceleration of foundation IS “Pstreom )
(t “se (-I stgn f hori~ontoi acceleratmn of foundaimn is upstream.)
NORMAL STRESS ON VERTICAL PLANE, Uy
III.~y==o,+blytc~y’+d~y’
o,=cJyy,=a,ton~,+P’~f PIE ; bt = b,+an@o + 2 t’ ,.WG
(0 W to be omltted If tall&voter is absent1
t a n $J” - ian6l;
az= A Z
j$= ~~(~)-~(~+6~YU+6T~Y~)l+~[3(~)+3(~)]
Check at face f o r y = T, uyu = ( P ’ PE -Tryu+anm”)
MAGNITUDE OF PRINCIPAL STRESSES, Up,,(Tp2
Alternate s,gn gives Up* which
Check ot upstream face either Up, Or OP = 5 sec2@‘“-(P’*Pr)+~nz@u
Check at downstream foCe either UP, or d 8&sec24%-( p’?‘pdton%
pe =
DIRECTION OF FIRST PRINCIPAL STRESS, 6p,
p *Pt”i OTC tan (-&I {
,f +a" zap, = (+), 0.~ "p,< C t45") Measured from Vertical
If +onz@p, = (-j (-45=v@p,c 0
, } ClockwIse positive.
I.
2.
3 .
4 .
5 .
6 .
7
8 .
9 .
/ I
Check at ups+ream:nd downstream face, 0p, =@, or(90’=0)
METHOD OF CONSTRUCTING LINES OF PRINCIPAL STRESS
From the ,n+ersec+,on of o chose” ver+,cal plow and thebase of thecontllever cross-Section,
mecsure $0, ot thoi Point and draw ianqent I-2 half way to the horizontal section d-8 next above.
At tne two bolnts on section A-B between which +he line must pass, iay off the angles wh~chgive
the d#rec+lon of the pr~ncipol s1ress being considered and prolong thel~nestothelrpointof mtel-sectlo”
Setween th,s pot”, of ,n+ersec+ion a.>d point 2 of the tangent /- 2, draw tongent 2-3 half way to
the horizontal section C-D nexi above A-D.
Con+,n”e the,nterpolo+,o” unth thesuccess~on of tongenis has reached either Of the fOC’2sor the
top of the cantilever cross-section (I+ may be necessary to Interpolate betweenanqles ot the
,n+ersect,one of successive horizontol sections and 0 vertito, plone)
Through the po,n+s of ,“+erse‘:,on of these tangents and the hOrIzo”+oi seCtIons(or YertlCOI planes),
draw the curves or lines of princlpai stress. Draw sufficient hnes to Include the whole section.
From +he Intersectfonofo horlzontol sectton and the uostreom facetor from the ~ntersectionofo
vertical plow and the base), measure the angle of the stress complementary to the oneju~r drown
and draw tinoent 5-6 from the wstreom face half way to the first hne of principal stress alreadydrawn
From 6, drowtorgent 6-7 perpendlculor to the first lone of pr~nc~pol stress andextending halfway
to the next line of principal sfress.
Continue the construction of the tangents perpendicular to the lines of principal stress already
drown until the too. bose.ordownstreom face of the cont~lever cross-section ~sreached.
Connect the pofnts of int§!on of these tangents and the lines of principal s+ress first drown
with curves or lines of complementary principal stress. Draw sufflclent curves to include the whole
SectIon.
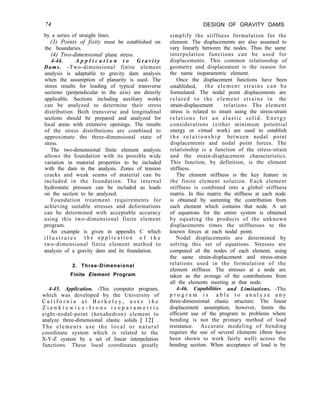
NOTE
The f,gures on +h,s sheetore for illustrative ~“rposes only. They donot represent results
for any speuflc condltlon of loodlng.
:. The value of the quont,ty IS to be de;ernined ot o hor,zon+ul plane n Z distance abcve the
horlzontol sect>on under cons,dera+,on
Figure 4-3. Stresses in straight gravity dams.-288-D-3152](https://image.slidesharecdn.com/gravitydams-230723194435-350300a0/85/GravityDams-pdf-74-320.jpg)
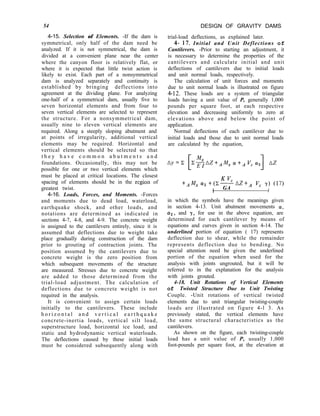
![LAYOUT AND ANALYSIS-Sec. 4-19 57
which the load is applied, which decreases
uniformly to zero at elevations of horizontal
elements above and below the point of
application. The value of the twisting moment
at any elevation due to a given unit load is
equal to the volume of the portion of the
wedge representing that load, above the given
elevation, as may be seen by the calculations
given on figure 4-l 3. Unit rotations of a
vertical element on the left side of the dam are
calculated by substitution of the above twisting
moments in the equation which follows, where
the symbols have the meanings given in section
4-13.
elevation at which J’is to be computed, the
value of P is determined from the curve. This
value of P, together with the values of b and c,
is then substituted in equation (19) and J
computed for that elevation. This procedure is
repeated for each elevation analyzed. The
values of J thus computed are for a block
having a width equal to the distance between
the ungrouted contraction joints. To determine
J for an element 1 foot wide, the computed
values are divided by the distance between the
contraction joints.
The values of J determined by the above
method will hold for any unit element within
this block or similar blocks having the same
distance between the contraction joints and the
same thickness at each elevation. However, if
there are other blocks in the dam that have
different distances between the contraction
joints, thus changing the ratio of b/c at
different beam elevations, values of J for these
blocks must also be determined. Care should be
taken to assign the proper values to b and c in
each computation, b being the longer side of
the rectangular cross section of the block at the
elevation under consideration and c the shorter
side.
(18)
In the above, J is a factor for determining
twist in a shaft of uniform cross section. The
values of J are computed [3] from the
equation,
J=/3bc3 (19)
where:
b = longer side of horizontal cross section
of element. (In this case the element
is the block between two ungrouted
contraction joints.)
c = shorter side of horizontal cross
section of element.
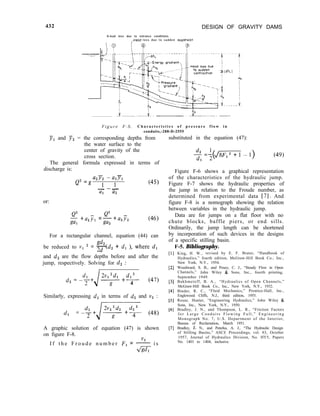
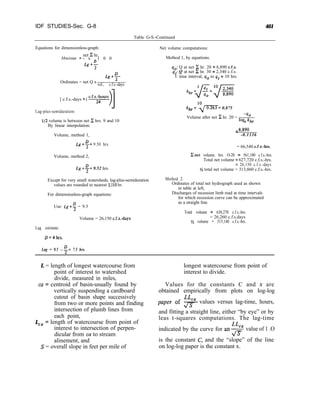
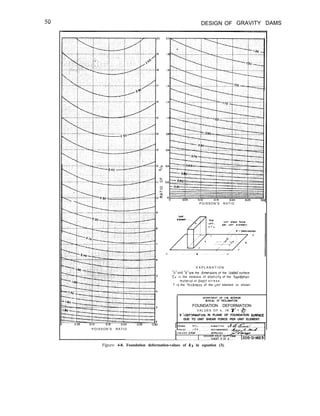
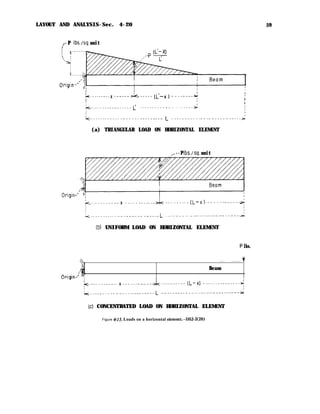
The following tabulation gives values of 0 for
various ratios of b/c:
To facilitate determining the proper values
of J for the different elevations of each vertical
element, the data in the above tabulation have
been plotted and a curve drawn as shown on
figure 4-14. The ordinates of the curve are the
values of /3 and the abscissas are the
corresponding ratios of b/c from the above
table. Using the computed ratio of b/c for the
Equation (19) was developed for shafts or
beams of uniform cross section, and the values
of J computed from this equation for the
vertical elements in the dam are therefore only
approximately correct since the cross sections
are not uniform.
4- 19. Unit Deflections of Horizontal
Elements of Twisted Structure.-Unit
deflections of horizontal elements due to shear
are used in calculating deflections for each
adjustment. Unit loads are applied to the
horizontal elements by means of triangular
loads which have a value of P pounds per
square foot at the abutment and vary as a
straight line to zero at the intersections of each
respective vertical element with the horizontal
element. The shear deflections due to a
uniform load and those due to a unit
concentrated load at the vertical dividing plane
are also computed (see fig. 4-15). The
concentrated load is used to provide deflection
agreement of the two portions of the dam. The
general equation used to compute the above
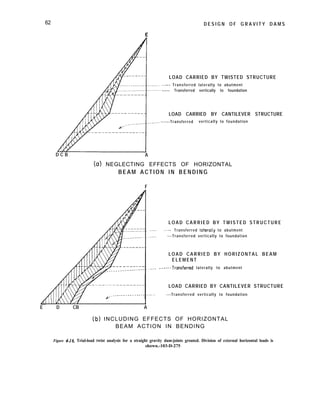
deflection is:](https://image.slidesharecdn.com/gravitydams-230723194435-350300a0/85/GravityDams-pdf-89-320.jpg)
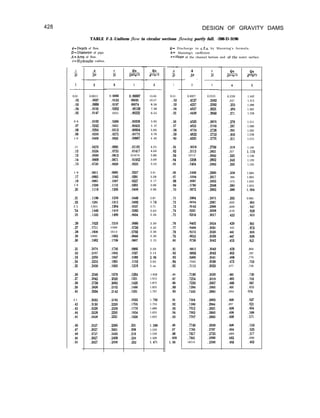
![58 DESIGN OF GRAVITY DAMS
Dota f o r d e t e r m i n i n g f a c t o r “J” d u e t o twist o f
o s h a f t o f r e c t o n g u l o r c r o s s sectjon.
“ S t r e n g t h o f Materiali;
O*
0 2 4 6 6
R A T I O S O F ft
Figure 4-14. Graph for determining J factor due to twist of a shaft of rectangular cross section.-288-D-3154
ay =
J
K ‘T
mdx +A VT Y cw
in which the symbols have the meanings given
in section 4-13.
Using K = 1.25 and G = E/2( 1 + P), the
general equation reduces to the following,
where L is the length of the half-element, L’ is
the length of the loaded portion, measured
from the abutment, and x is the distance from
the abutment to the point where deflection is
desired. For a unit triangular load,
P
ny=-2EAL’ [
3 (L’)2 x - 3 L’ x* +x3
1
+ v, Y (21)
For a uniform load,
AY=-~EA
-x- [2Lx-x’] + VA y ( 2 2 )
For a unit concentrated load,
3 P x
AY=- EA +f’--/j ‘Y (23)
Shear forces are equal to the area under the
unit-load diagram from the dividing plane of
the dam to the cantilever points under
consideration, and are negative in sign.
Values for unit deflections due to shear in
horizontal elements are tabulated for
convenient use in the adjustments.
4 - 2 0 . T r i a l L o a d s . - F o l l o w i n g t h e
computation of unit-load deflections and](https://image.slidesharecdn.com/gravitydams-230723194435-350300a0/85/GravityDams-pdf-90-320.jpg)
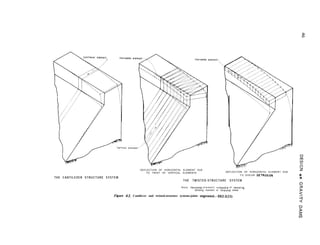
![LAYOUT AND ANALYSIS-Sec. 4-25
2. Trial-Load Twist Method of
Analysis, Joints Grouted
61
figure 4-16(b). It should be noted that one-half
of the twisted-structure load is carried to the
foundation by the vertical twisted elements
and one-half to the abutment by the horizontal
twisted elements. That such a distribution may
be assumed for the twisted-structure load was
shown by H. M. Westergaard in 1930 in his
review of the trial-load analysis of arch dams.
The principle will be explained by illustration.
Figure 4-17(a) shows a triangular dam, 5 units
high and 10 units along the crest from the
dividing plane of symmetry to the left
abutment. The vertical cross sections in planes
normal to the plane of the paper are assumed
to be of unit uniform thickness from the top to
the base. Rigid foundations are assumed, hence
abutment and foundation rotations are omitted
from the analysis. A twisted-structure load
applied at a point xs , zl,, produces angular
rotations in the beams and cantilevers of the
twisted structure. The calculations on figure
4-17 show that if these rotations are integrated
along their respective planes from beam
abutment and cantilever foundation to the
point of application of the load, the resulting
deflections at the latter point are equal [4],
from which it can be concluded that equal
amounts of load are transferred vertically and
horizontally by the twisted structure. It should
be noted that, while the assumption of an
equal load distribution is correct for a
uniform-thickness section, it is only
approximately true for a variable-thickness
section.
By hypothesis, the beam and cantilever
structures can resist only bending and shear,
while the twisted structure can resist only twist
and shear. Figure 4-l 7(b) illustrates an element
of the beam structure subjected to load. Any
portion of this element, AND, which may also
be considered as part of a cantilever element, is
seen to be in equilibrium due to moments and
shears set up by load P. The total clockwise
moment acting on the element is P multiplied
by the arm of 10 feet, plus a couple consisting
of the shear P multiplied by an arm of 1 foot,
which is balanced by a counterclockwise
resisting moment of P multiplied by 11 feet.
Therefore, the load on the beam does not
require a resisting twist in the cantilever
4-25. Description of Method. -The grouting
of contraction joints welds the vertical blocks
of the dam into a monolithic structure. In this
case the dam has a different action under load
than when joints are ungrouted. Grouting
reduces the deflections of the structure for a
given loading, since both horizontal and
vertical elements of the dam are subject to
bending and twisting in both horizontal and
vertical planes. For very small dams, say under
50 feet in height, the effect of bending in the
horizontal elements is very small and may be
neglected; for higher dams, however, it is
usually included. The general procedure is
similar to that used for joints ungrouted, but
an additional structure, designated the beam
structure, is introduced for resistance to
bending in horizontal elements. For this
analysis, then, we have the cantilever structure,
the twisted structure, and the beam structure,
or three structures instead of two, the twisted
structure being composed of both vertical and
horizontal elements as previously described.
If the dam acts as a monolith, as assumed,
the deflections of the cantilevers, horizontal
beams, and twisted structure-due to trial
divisions of waterload between the three
systems-must be brought into agreement in all
parts of the dam. Furthermore, for complete
continuity, the longitudinal slopes of the
cantilever must equal the transverse slopes of
horizontal elements, and the longitudinal
slopes of the horizontal elements must equal
the transverse slopes of the cantilevers. A
general slope adjustment is not necessary,
however, since the adjustment of deflections in
the horizontal elements of the twisted
structure produces agreement of the
longitudinal slopes of the horizontal elements
with the transverse slopes of the cantilevers.
The adjustment is more complicated than
for joints ungrouted, since three structures are
used instead of two. As an initial step in the
analysis, the waterload is divided by trial
between the three structures, as illustrated
diagrammatically for a cantilever element on](https://image.slidesharecdn.com/gravitydams-230723194435-350300a0/85/GravityDams-pdf-93-320.jpg)
![LAYOUT AND ANALYSIS-Sec. 4-25 63
p---------Horizontal Twisted Structure (HTSI------------w
*Axis
:
of Symmetry of Dam
‘-x F
kc---- _________________.___ 10 “ni+ spaces(l)------------------------~,
/-Y--Axis
(a) DISTRIBUTION OF TWISTED- STRUCTURE LtiD
BASIC ASSUMPTIONS
Dam is symmetrical in triangular site about axis L,,,. Vertical cross-sectms
in plones normal to plane of paper are of umt uniform thickness
from top to base of dam. ~GI : unity. Half length of dam,l,= twice height,
h. Abutment and foundation deformations not included,shear detrusions omitted.
Let a unit twisted-structure load of P intensity be applied at a pomt
xI, q. in the dam. Let the angular rotations in both the xy and yz
planes due to unit twisting moments - I per unit length. Assume one-half
the twisted- structure load is carried horizontally to abutments and
one-half carried vertically to foundation, by twist action.
In HTS Myz:g ,----- ByZ:f.x ,---- - AY=fB,, dz
I n V T S M,, =F, _____ 8xy=$z, _____ AY=/9,, dx
For HTS AY at point x5 zlo, Z = 5
’
. . AY= dXz i?if
c 1lo z 12,5p
a 0
For VTS AY at point x~z,~,X=~Z
:. AY&‘; -2z dz= [?]I = 12.5P
I
(c) TWISTED- STRUCTURE ELEMENT
Figure 4-I 7. Twisted-structure loads.-DS2-2(30)](https://image.slidesharecdn.com/gravitydams-230723194435-350300a0/85/GravityDams-pdf-95-320.jpg)
![LAYOUT AND ANALYSIS-Sec. 4-29 65
The general equations for rotation and deflection at any point in a horizontal beam element,
including effects of bending, shear, and abutment movement, are as follows:
(25)
-+MA crx+MAa,+V/, r+VA azx (26)
(a) Triangular Load.-Slopes and deflections due to a triangular normal load may be calculated
at any point along the centerline of a beam in the left half of the dam by means of the equations
given in this subsection. Equations for the right half of the dam are the same except for a reversal
in the sign of slopes. Equations for moment and shear are:
./M=-p(L’-x)3=-p
P
6L’ 6L’
-
3 (L’)2 x + 3 L’ x2
-
x3
1
v=-P(L’-x)2- p
2L’ --7j-p
- 2 L’x+x2 1
The equation for slope at any point is:
/
xP
e =
0
F=-6hL, FL’)3 Lx’ dx-3(L’)2 I ” x d x
+3Lrlxp x2dx- i”x3dx]
P
24EIL’ [
4 (L’)3 xp - 6 (L’)2 xp2 + 4 L’xp3 -xp4
I
+M/, a+ VA cx2
For
xp = L’ tax, = L,
e=-$-g+MA a+vA a2
(27)
(28)
(29)
(30)](https://image.slidesharecdn.com/gravitydams-230723194435-350300a0/85/GravityDams-pdf-97-320.jpg)
![LAYOUT AND ANALYSIS-Sec. 4-29 67
When
xP
=L,
PL3
e=-6EI
-+MA cw+ VA a2
The equation for deflection at any point is:
/
xP
Ay =
M(xp -x)dx
E I +3 -
0 /
xP
Vdx
E A
0
= -&- FLZxp? -4Lxp3 +x,4] --uf- FLX, -xpq
2EA
i
+V, y+MA a,+
I I 1 xp
When
xP
=L,
PL4 3PL2
Ay=-mEI-
2EA
+V, r+MA a2+ cv2 + V, 1y2 L
1 1
(38)
(39)
(40)
(c) Concentrated Moment at Free End of Beam.-The equations for moment, shear, slope, and
deflection for this condition are:
M = - P v = o
‘xp
e=-EI +MA” (41)
PxpZ
nY=-2EI +MA (~2 +MA cYxp (42)
For xp = L, the latter value is substituted in the above equations.
(d) Concentrated Normal Load at Free End of Beam.-The equations for moment, shear, and
slope for this condition are:
M = - P ( L - x ) v = - P
8 =-&$2r.X, -Xp2)+MA cY+ VA a2 (43)](https://image.slidesharecdn.com/gravitydams-230723194435-350300a0/85/GravityDams-pdf-99-320.jpg)
![68 DESIGN OF GRAVITY DAMS
WhenxP = L,
PL2
’ = - 2 E I
-+MA cy+ VA cc2 (44)
The equation for deflection is:
Ay=-& (3Lx,2 -xl,+$+
I , [
MA a + VA a2
1 x,+4, a2+I/A Y (45)
I I
WhenxP = L,
PL3
-~
‘Y=-3EI a+ vA a2
1
L+MA 012 +VA 7
t I
(46)
The underlined portions of the preceding equations are equivalent to expressions for unit
cantilever deflections obtained by equations (21) to (23), inclusive. Therefore, by keeping separate
the underlined portions of equations (33), (40), and (46), shear deflections due to unit shear loads
on horizontal elements are obtained at the same time as beam deflections due to unit normal
loads. An example of a twist analysis of a gravity dam with joints grouted is shown in appendix B.
3. Analysis of Curved Gravity Dams
4-30. Method of Analysis.-If a gravity dam is curved in plan only for convenience in locating
the structure on the existing topography and contraction joints are not grouted, the analyses
should be made as described for straight gravity dams. However, if the joints are grouted and the
dam is curved, arch action is an important factor in the reliability of the structure. Under these
circumstances, it is desirable to analyze such a structure by an arch dam analysis method rather
than by the gravity method described earlier. The arch dam analysis, including computerized
application, is described in the Bureau of Reclamation publication “Design of Arch Dams” [ 171 .
D. DYNAMIC ANALYSIS
4-31. Introduction. -The following method for dynamic analysis of concrete gravity dams can
be described as a lumped mass, generalized coordinate method using the principle of mode
superposition [5]. Application of the method is done by computer, and matrix methods of
structural analysis are used. The method is similar to that proposed by Chopra [6] .
4-32. Natural Frequencies and Mode Shapes.-The section analyzed is a two-dimensional cross
section of the dam. The section is represented by finite elements [7] with the concrete mass
lumped at the nodal points. The natural frequencies fr , f2, f3, etc., and the corresponding mode
shapes (Qi), , (Gi), , (Gi), (where i indicates the assigned number of the mass point) are found by
the simultaneous solution of equations of dynamic equilibrium for free vibration. There is one
equation for each lumped mass. This problem is known as an eigenvalue problem. There are
standard computer solutions available for the eigenvalue problem.
The input that will be required for the solution of the eigenvalue problem will be the stiffness
matrix [K] and the mass matrix [Ml. A typical element in the stiffness matrix, Kii, represents the
force at i due to a unit deflection of j with all other points remaining fixed. The mass matrix is a](https://image.slidesharecdn.com/gravitydams-230723194435-350300a0/85/GravityDams-pdf-100-320.jpg)
![LAYOUT AND ANALYSIS-Sec. 4-33
69
diagonal matrix of the lumped masses. Each lumped mass includes the mass of the concrete
associated with that point. To represent the effect of the water against the dam on the frequencies
and mode shapes, a mass of water is divided appropriately between the mass points. The volume of
water assumed to be vibrating with the dam is given by an equation developed by Westergaard [ 81.
The equation is:
b = 718 + (47)
where:
b = the dimension of the water measured horizontally from the upstream face,
z = the depth of water at the section being studied, and
h = the distance from the water surface to the point in question.
4-33. Response to an Earthquake.-Given the natural frequencies, mode shapes, and an
acceleration record of an earthquake, the following equation expresses the acceleration of point i
in mode ~1, ii,., , as a function of time:
. . ‘i Mi @in 2n
Xin = @in
2 I zn J
t
Z.M.@T Tn 0
ig(7)e sin-$ (t - T) dr
n
(48)
where:
T,=f,
h = viscous damping factor,
;;,(T) = the acceleration of the ground as a function of time, digitized for the numerical
evaluation of the integral,
# = nodal displacement,
M = mass,
7 = time, and
t = a particular time, T = t.
Little data are available on the damping in concrete gravity dams, expressed as h in equation
(48). Chopra [9] indicates that a reasonable assumption for h in a concrete gravity structure is
0.05.
Equation (48) is evaluated at chosen increments of time. An increment of 0.01 second has been
used. At the end of each of these time increments, the accelerations for all node points in all the
modes being considered are summed as in the following equation:
,. = ~ j;i,
‘ T O T A L n
(49)
The response history is scanned for the time of the maximum value of acceleration at the crest.
The .xiT0 TA L at this time is the acceleration for the dam. These values can be divided by the
acceleration of gravity to give Cyi.](https://image.slidesharecdn.com/gravitydams-230723194435-350300a0/85/GravityDams-pdf-101-320.jpg)
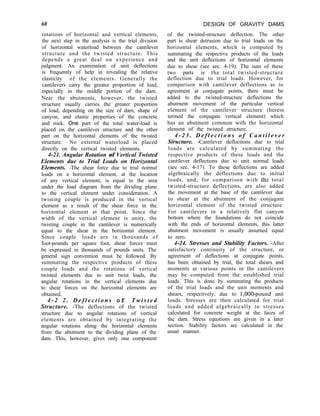
![DESIGN OF GRAVITY DAMS
distribution, and permits representation of
treatment necessary to obtain acceptable
displacements.
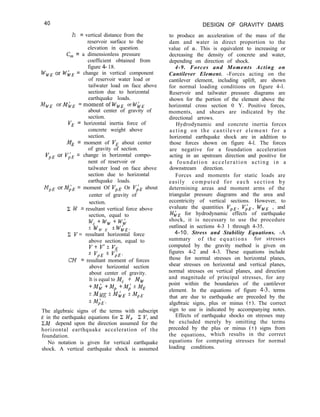
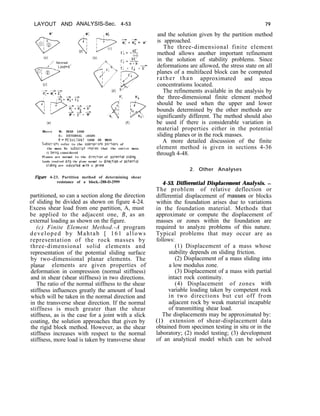
4-54. Analysis of Stress Concentrations Due
to Bridging.-A stress concentration may occur
in the dam due to the presence of a
low-modulus zone within the foundation as
shown on figure 4-25. To minimize the buildup
of stress in the dam, a portion of the weak
material in the low-modulus zone may be
replaced with concrete. The depth of
replacement required is determined as the
depth when stresses in the dam and
foundation are within allowable limits. The
two-dimensional finite element method,
discussed in sections 4-37 through 4-44, is an
excellent method for solving this problem.
,,-MultIfaced block
SECTION B-B
SECTION C-C
NOTE: Circled numbers refer tc foCeS
Circled letters refer to blocks
R,,= The porttan afthe resultant osslgned to a face
Thesub-subscript mdlcotes the face number
F&=The portion of the resultant normal to the
dlrectlon of patentlol movement of a black.
The sub-subscrlpt refers to the black.
Rn =Resultant external load acting on block A
Figure 4-24. Partition method extended to multifaced
blocks.-288-D-3000
manually; or (4) two- or three-dimensional
finite element methods.
Although the method used depends on the
particular problem, it should be noted that the
finite element method offers considerable
advantage over the other procedures. The finite
element method allows accurate material
property representation, gives stress
,,,.Applied l o a d
g h e r vertical s
region and possible
‘tress
ess
horizontal tension zone
Low-modulus zone
Figure 4-25. Stress distribution near a low-modulus
zone.-288-D-3001
G. BIBLIOGRAPHY
4-5 5. Bibliography
[l] Westergaard, H. M., “Computations of Stresses in Bridge
Slabs Due to Wheel Loads,” Public Roads, vol. II, March
1930, pp. 1-23.
[2] McHenry, Douglas, “A Lattice Analogy for the Solution
of Stress Problems,” Institution of Civil Engineers, Paper
5350, vol. 21, December 1943, pp. 59-82.
[3] Timoshenko, S., “Strength of Materials,” Part I, p. 270,
1956.
[4] Timoshenko, S., “Theory of Elastic Stability,” Chapter
6,196l.
[5] Clough, R. W., “Earthquake Response of Structures,”
Chapter 12 of Earthquake Engineering (R. L. Wiegel,
coordinating editor), Prentice-Hall, Englewood Cliffs,
N.J., 1970.
[6] Chopra, A. K., and Chakrabarti, P., “A Computer
Solution for Earthquake Analysis of Dams,” Report No.
EERC70-5, Earthquake Engineering Research Center,
University of California, Berkeley, Calif., 1970.
[7] Morgan, E. D., and Anderson, H. W., “Stress Analysis
Using Finite Elements,” Report No. SA-1, Bureau of
Reclamation, 1969.
[8] Westergaard, H. M., “Water Pressures on Dams During
Earthquakes,” Transactions, American Society of Civil
Engineers, vol. 98, 1933.](https://image.slidesharecdn.com/gravitydams-230723194435-350300a0/85/GravityDams-pdf-112-320.jpg)
![LAYOUT AND ANALYSIS-Sec. 4-55 81
[9] Chopra, A. K., and Chakrabarti, P., “The Koyna
Earthquake of December 11,1967, and the Performance
of Koyna Dam,” Report No. EERC-71-1, Earthquake
Engineering Research Center, University of California,
Berkeley, Calif., p. 28, 1971.
[lo] Zanger, C. N., “Hydrodynamic Pressures on Dams Due
t o H o r i z o n t a l E a r t h q u a k e E f f e c t s , ” B u r e a u o f
Reclamation, Special Assignments Section Report No.
21, October is,-1950. -
I1 11 Cloueh. Rav W.. “The Finite Element Method in Plane
. a
Stresi ‘Analysis;” ASCE Conference Papers (Second
Conference on Electronic Computation, September
1960).
[12] Zienkiewicz, 0. C., “The Finite Element in Structural
and Continuum Mechanics,” McGraw-Hill, London,
1967.
[ 131 Clough, R. W., “Comparison of Three-Dimensional
Finite Elements,” Proceedings of the Symposium on the
Application of Finite Element Methods in Civil
Eneineering, Vanderbilt University, Nashville, Tenn.,
November 13-14,1969.
[14] Londe, P., (1965), Une Methode d’Analyze o’trois
dimensions de la stabilite d’une rive rocheme, Annls
Ponts Chaus. No. 1 37-60.
[ 151 Guzina, Bosko, and Tucovic, Ignjat, “Determining the
Minimum Three-Dimensional Stability of a Rock
Wedge,” Water Power, London, October 1969.
[16] M a h t a b , M . A . , a n d G o o d m a n , R . E . , “Three-
Dimensional Finite Element Analysis of Jointed Rock
Slopes,” Final Report to Bureau of Reclamation,
contract No. 14-06-D-6639, December 31,1969.
[17] “Design of Arch Dams,” Bureau of Reclamation, 1976.](https://image.slidesharecdn.com/gravitydams-230723194435-350300a0/85/GravityDams-pdf-113-320.jpg)


![FOUNDATION TREATMENT-Sec. 6-5 101
outlined by Khosla in reference [ 11.’ These
two methods are particularly applicable for
Other adverse foundation conditions may be
medium to high dams. For low head dams, the
due to horizontally bedded clay and shale
seams, caverns, or springs. Procedures for
weighted creep method for determining cutoff
depths as shown in chapter VIII of “Design of
treating these conditions will vary and will
depend upon field studies of the characteristics
Small Dams” [2] may be used. of the particular condition to be remedied.
B. GROUTING
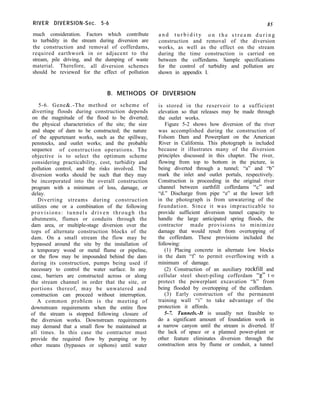
6-5. General. -The principal objectives of
grouting in a rock foundation are to establish
an effective barrier to seepage under the dam
and to consolidate the foundation. Spacing,
length, and orientation of grout holes and the
procedure to be followed in grouting a
foundation are dependent on the height of the
structure and the geologic characteristics of the
foundation. Since the characteristics of a
foundation will vary for each site, the grouting
plan must be adapted to suit field conditions.
Grouting operations may be performed
from the surface of the excavated foundation,
from the upstream fillet of the dam, from the
top of concrete placements for the dam, from
galleries within the dam, and from tunnels
driven into the abutments, or any combination
of these locations.
T h e g e n e r a l p l a n f o r g r o u t i n g t h e
foundation rock of a dam provides for
preliminary low-pressure, shallow consolidation
grouting to be followed by high-pressure, deep
curtain grouting. As used here, “high pressure”
and “low pressure” are relative terms. The
actual pressures used are usually the maximum
that will result in filling the cracks and voids as
completely as practicable without causing any
uplift or lateral displacement of foundation
rock.
6-6. Consolidation Grouting. -Low-pressure
grouting to fill voids, fracture zones, and cracks
at and below the surface of the excavated
foundation is accomplished by drilling and
grouting relatively shallow holes, called “B”
holes. The extent of the area grouted and the
depth of the holes will depend on local
conditions.
‘Numbers in brackets refer to items in the bibliography,
sec. 6-9.
Usually for structures 100 feet and more in
height, a preliminary program will call for lines
of holes parallel to the axis of the dam
extending from the heel to the toe of the dam
and spaced approximately 10 to 20 feet apart.
Holes are staggered on alternate lines to
provide better coverage of the area. The depths
of the holes vary from 20 to 50 feet depending
on local conditions and to some extent on the
height of the structure. For structures less than
100 feet in height and depending on local
conditions, “B” hole grouting has been applied
only in the area of the heel of the dam. In this
case the upstream line of holes should lie at or
near the heel of the dam to furnish a cutoff for
leakage of grout from the high-pressure holes
drilled later in the same general location. “B”
holes are drilled normal to the excavated surface
unless it is desired to intersect known faults,
shears, fractures, joints, and cracks. Drilling is
usually accomplished from the excavated
surface, although in some cases drilling and
grouting to consolidate steep abutments has
been accomplished from the tops of concrete
placements in the dam to prevent “slabbing” of
the rock. In rarer cases, consolidation grouting
has been performed from foundation galleries
within the dam after the concrete placement
has reached a certain elevation. This method of
consolidation grouting requires careful control
of grouting pressures and close inspection of
the foundation to assure that the structure is
not being disbonded from the foundation.
Figure 6-2 illustrates a typical spacing and
length pattern for “B” hole grouting.
In the execution of the consolidation
grouting program, holes with a minimum
diameter of 1% inches are drilled and grouted
40 to 80 feet apart before split-spaced](https://image.slidesharecdn.com/gravitydams-230723194435-350300a0/85/GravityDams-pdf-133-320.jpg)
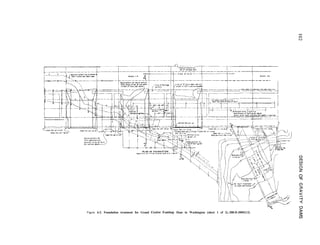
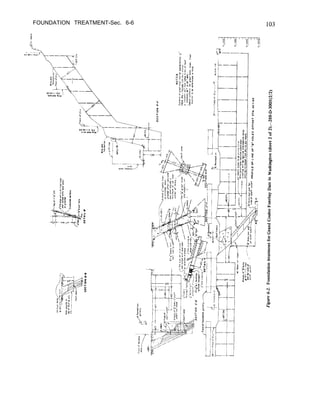
![106 DESIGN OF GRAVITY DAMS
and reservoir depths. As a general rule, hole
depths vary from 20 to 40 percent of the
reservoir depth and 35 to 75 percent of the
deep curtain grouting depth.
Drain holes should be drilled after all
foundation grouting has been completed in the
area. They can be drilled from foundation and
drainage galleries within the dam, or from the
downstream face of the dam if no gallery is
provided. Frequently drainage holes are drilled
from foundation grouting and drainage tunnels
excavated into the abutments.
In some instances where the stability of a
rock foundation may be beneficiated by
reducing the hydrostatic pressure along planes
of potentially unstable rock masses, drainage
holes have been introduced to alleviate this
condition. A collection system for such
drainages should be designed so that flows can
be gathered and removed from the area.
D. BIBLIOGRAPHY
6-9. Bibliography.
[l] K h o s l a , A . N . , “ D e s i g n o f D a m s o n P e r m e a b l e
Foundations,” Central Board of Irrigation, India,
September 1936.
[ 21 “Design of Small Dams,” Bureau of Reclamation, second
edition, 1973.](https://image.slidesharecdn.com/gravitydams-230723194435-350300a0/85/GravityDams-pdf-138-320.jpg)
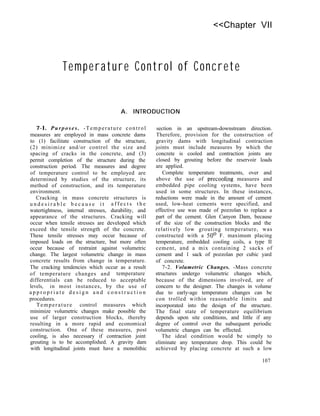
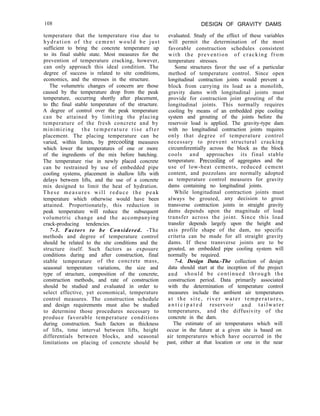

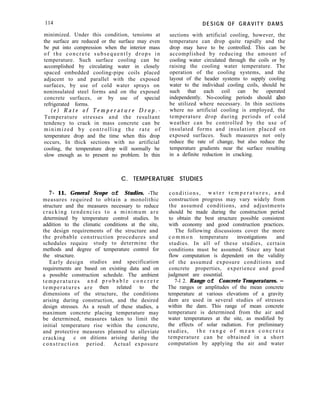
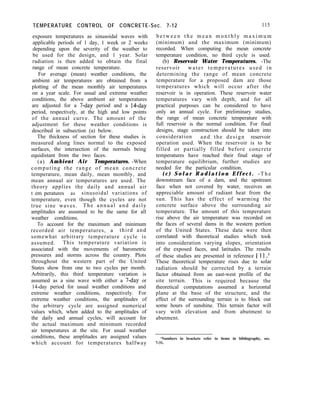
![116
DESIGN OF GRAVITY DAMS
7-13. Temperature Gradients. -Temperature
distributions in a mass where boundary
conditions vary with time are easily determined
by the Schmidt method. (See references [ 11,
[23, [3], [4] .) This method is generally used
for temperature studies of mass concrete
structures when the temperature gradient or
distribution across the section is desired. The
depth of freezing, and temperature distribution
after placement are typical of the solutions
which can be obtained by this step-by-step
method. Different exposure temperatures on
the two faces of the theoretical slab and the
autogenous heat of hydration are easily taken
into consideration.
An early objection to the Schmidt method
of temperature computation was the time
required to complete the step-by-step
computation. This has been overcome by the
use of electronic data processing machines
which save many man-hours of work. Programs
have been developed which will take into
consideration any thickness of section, varying
exposures on the two faces of the slab, variable
initial temperatures, a varying heat of
hydration with respect to time, and increasing
the thickness of slab at regular intervals as
would occur when lifts of concrete are placed
on previously placed lifts.
A s e c o n d m e t h o d o f t e m p e r a t u r e
computation in mass concrete which is
particularly adaptable to thick walls and
placement lifts near the rock foundation was
devised by R. W. Carlson. This method is
described in reference [ 51. It, like the Schmidt
method, is essentially a step-by-step integration
which can be simplified by selection of certain
variables. Conditions such as initial
temperature distributions, diffusivity, and
adiabatic temperature rise must be known or
assumed. Carlson’s method can also be
modified to take into account the flow of heat
between different materials. This would be the
case where insulated or partially insulated
forms are used, or where concrete lifts are
placed on rock foundations.
T h e v a r i a t i o n i n t e m p e r a t u r e i n a
semi-infinite solid at any particular point can
also be estimated from figure 7-4. This
illustration gives the ratio of the temperature
(d) Amplitudes of Concrete Temperatures.-
T h e r a n g e o r a m p l i t u d e o f c o n c r e t e
temperatures is determined by applying the
above-described external sinusoidal air and
water temperatures to the edges of a
theoretical flat slab, the width of the slab being
equal to the thickness of the dam at the
elevation under consideration. The problem is
idealized by assuming that no heat flows in a
direction normal to the slab. The law of
superposition is used in that the final
amplitude in the concrete slab is the sum of the
amplitudes obtained from the different
sinusoidal variations.
To apply the theoretical heat flow in a
practical manner, unit values are assumed for
the several variables and a curve is drawn to
show the ratio of the variation of the mean
temperature of the slab to the variation of the
external temperature. Figure 7-1 shows the
relationship thus derived for temperature
variations in flat slabs exposed to sinusoidal
variations for h* = 1.00 square foot per day, a
period of 1 day, and a thickness of slab of II . A
correlation equation is given to take into
account the actual thickness of dam, diffusivity
constant, a n d p e r i o d of time. The
computations are shown in figures 7-2 and
7-3.* For the actual thickness of dam, I,, a
value of I, is obtained from the correlation
equation for each of the air temperature cycles.
For each value of I, , a ratio of the variation of
mean concrete temperature to the variation of
external temperature is obtained. The sums of
the products of these ratios and their respective
amplitudes are algebraically added to and
subtracted from the mean annual air
temperature to obtain mean concrete
temperatures for the condition of air on both
faces. Mean concrete temperatures are then
obtained in the same manner for a fictitious
condition of water on both faces, and the two
conditions are simply averaged together to
obtain the condition of air on one face and
water on the other. Solar radiation values are
then added to obtain the final range of mean
concrete temperatures.
2
These and sev~al other figures and tables in this chapter
were reprinted from Bureau of Reclamation Engineering
Monograph No. 34, listed as reference ] 11 in the bibliography,
sec. 7-3 1.](https://image.slidesharecdn.com/gravitydams-230723194435-350300a0/85/GravityDams-pdf-148-320.jpg)
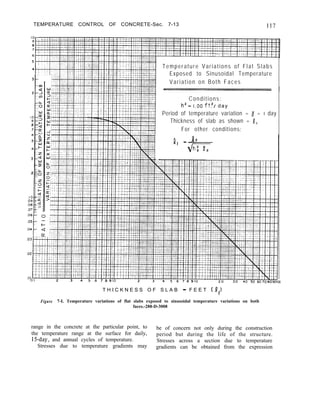
![118 DESIGN OF GRAVITY DAMS
RANGE OF MEANCONCRETE TEMPERATURES
Hunsrv How DAM
( E f f e c t o f s o l a r r o d i a t i o n n o t i n c l u d e d )
e,- e2
For yearly change PI=- -dm = ~ L
0.0464 fJ
e,
F o r 365-h,. change .!, = o.o53x M5 = &?LL&
For daily change L=, ez = 0.867 e,
0.053124
Remarks: Aor temperatures taken from 34 war record ar Columbia
Falls, Montana. h2 = 0.053 fro,,, laborator” data
Thick- Due to Due to Dus t o
~,a”- n666 Yearly Rangexs-hcRon Daily Rorqe EX
I4501 811 3 . 7 6 1 .215[18.39 ,043 7184 .Olll 6.1 1 6.8]49.3[36.4 1 5.71 5.6 146.9137.4 4 7 . 5 3 9 . 5 43.01 4.51 1 . 2 144.2/41.8 146.7139.1 46.6 39.6
34001 1111 5.151 .156125.X+ .0321 1 - 14.41 4.9147.6138.3 14.1 14.1 147.3139.1 146.aj39.0142.a~ 3.01 0.5 j42.5]41.5145.0]39.7 144.9 40.3
3350 1 ‘41 1 6.541 .122[32.011 .0251 1 1 1
3.4 3.9 146.6 139.3 1 3.2 1 3.2 146.4 140.0 143.0 j 141.0;
39.0 2.01 0.2 / 1 4 0 . 8 I43.9140.0
41.2 143.8 4 0 . 4
3300 ( ‘ 7 ’ 1 7.931 .‘wl38.82/ .0211 1 1 2.8 1 3.2 146.0 140.0 j 2.6 1 2.7 145.6 140.5 143.0 139.0 j j
4 1 . 0 2.01 0.2 141.2 140.8 143.6140.4 143.5 140.6
37501 20’1 9.331 .065]45.631 .a’81 1 1 241 2.7 145.6 140.5 1 2.2 1 2.3 145.4 140.9 143.0139.0141.01 2.01 0.2 141.2 140.8 143.4140.6 143.3 140.8
NOT ES: e, = Thickness of dam, ft.
Curve referred to is ‘Temperature
Variations of Flat Slabs Exposed
to Sinusoidal Temperature Variations
o n B o t h Faces:
Figure 7-2. Computation form, sheet 1 of 2-range of mean concrete temperatures.-288-D-3009
eE
a’ = b3(1+)
+ 3(2x-b) b (2x-b)T(x)dx-b3 T(x)
1
where:
e = thermal coefficient of expansion,
E = modulus of elasticity,
p = Poisson’s ratio, and
b = thickness of section with a tempera-
ture distribution T(x).
Where the temperature variation, T(x), cannot
be expressed analytically, the indicated
integrations can be performed numerically by
the use of Simpson’s rule. For example, using b
= 30 feet, e = 6.0 x 10e6, E = 2,500,OOO
pounds per square inch, p = 0.20, and an
assumed T(x), the stresses would be computed
as shown in table 7-2.
The above expression for stress is not valid
in all essentials for those temperature gradients
which occur during the first few days after
placement, because the extreme creep
characteristics of the concrete during this age
result in a highly indeterminate condition of
stress. The expression is also not valid where
external restraints occur such as near the
foundation of a block or structure.
7 - I 4. Temperature Rise. -Newly placed
concrete undergoes a rise in temperature due to
the exothermic reaction of the cementing
materials in the concrete. Early temperature
rise studies may be based on past experience
records with the type of cement to be used.](https://image.slidesharecdn.com/gravitydams-230723194435-350300a0/85/GravityDams-pdf-150-320.jpg)
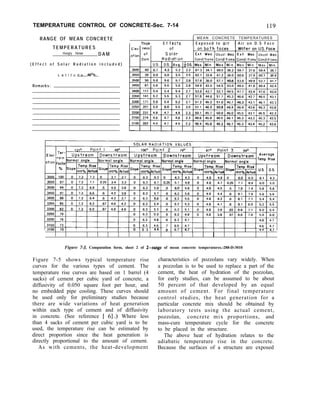
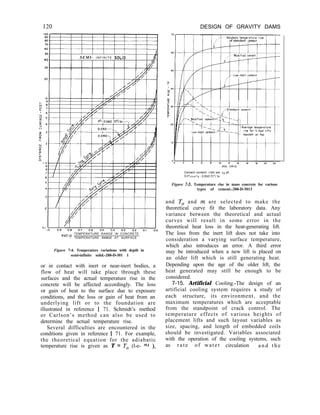
![TEMPERATURE CONTROL OF CONCRETE-Sec. 7-15 121
fi.
0
3
6
9
12
15
18
2 1
2 4
27
30
b
-
--
_-
-
0. 0
8. 3
15. 8
22. 7
29. 1
35. 1
40. 7
46. 0
50. 9
55. 6
60. 0
1003. 8
-
--
--
-
Table I-2.-Computation of temperature stress.
0
- 199
- 284
- 272
- 1 7 5
0
244
552
916
1334
1800
8862
-
-
For the given conditions:
eE
br(l=OJ
~,=0.1[(900)(1003.8)
+ 3(22- 30) (8862)
-(30)3T(41
Simplifying:
a,=5317z-2700T(z)
+ 10,584
temperature differential between the cooling
water and the concrete being cooled, are
studied concurrently. All of these factors
should be considered in arriving at an
economical cooling system which can achieve
the desired temperature control.
The theory for the removal of heat from
concrete by embedded cooling pipes was first
developed for use in Hoover Dam. (See
reference [7] .) From these studies, a number
of curves and nomographs were prepared for a
vertical spacing (height of placement lift) of 5
feet. The concrete properties and a single rate
of flow of water were also used as constants.
Subsequent to the earlier studies, the theory
was developed using dimensionless parameters.
Nomographs were then prepared on the basis
of a ratio of b/a of 100, where b is the radius
of the cooled cylinder and a is the radius of the
cooling pipe. Actual cooling pipe spacings are
nominal spacings and will seldom result in a b/a
ratio of 100. In order to take the actual
horizontal and vertical spacings into
consideration, a fictitious diffusivity constant
can be used which is based on tests of concrete
made with similar aggregates. Table 7-3 gives
the values of D, 02, and hzf for various
spacings of cooling pipe. The b/a ratios of the
spacings shown vary from about 34 to 135.
Within these limits, the values of h2f may be
used with sufficient accuracy.
Figures 7-6 and 7-7 are used for pipe cooling
computations. In these illustrations,
-
--
-
IbP/it.’
10,584
4, 125
- 1 7 4
- 2 , 8 5 3
-4, 182
- 4 , 4 3 1
- 3,600
- 1,959
762
4,023
8.094
-
_-
-
lb.%.2
7 4
29
- 1
- 2 0
- 2 9
- 3 1
- 2 5
- 1 4
5
2 8
5 6
Difference between mean temper-
1
ature of the concrete and temner-
ature of the cooling water- I
itial temperature difference
between the concrete and the 1
L cooling water J
r 1
y=
Initial temperature difference
K = conductivity of the concrete,
L = length of cooling coil,
CW = specific heat of water,
Pw = density of water,
4w = volume of water flowing through
the coil,
t = time from start of cooling,
0, = diameter of the cooling cylinder,
and
h2 = diffusivity of the concrete.
Consistent units of time and distance must be
used throughout.
The curves in figures 7-6 and 7-7 are used in
a straight-forward manner as long as no
appreciable heat of hydration is occurring in
the concrete during the period of time under
consideration. When the effect of artificial
cooling is desired during the early age of the](https://image.slidesharecdn.com/gravitydams-230723194435-350300a0/85/GravityDams-pdf-153-320.jpg)
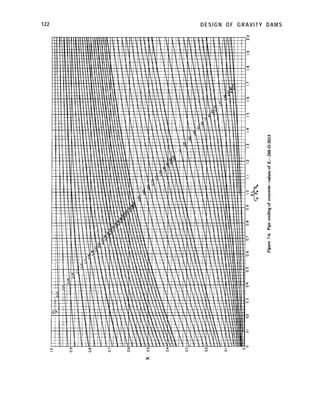
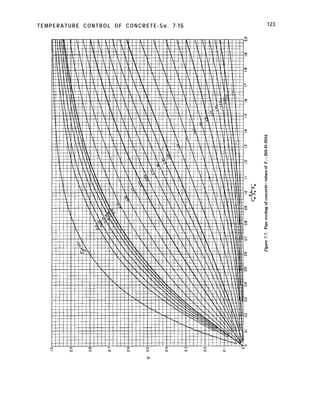
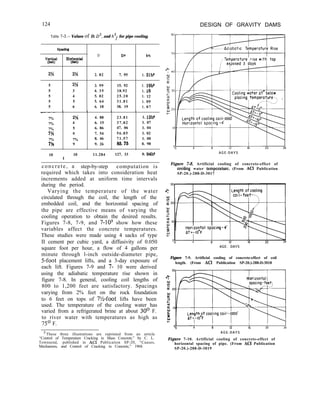

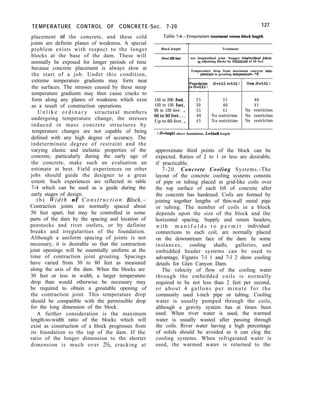
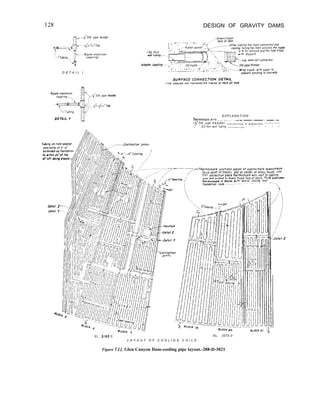
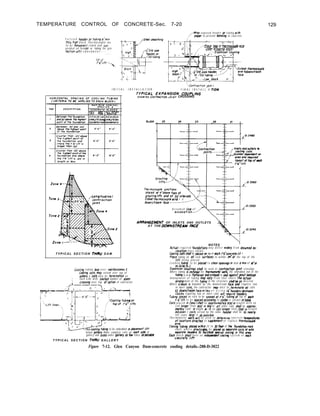
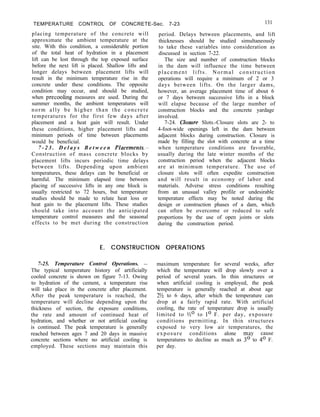
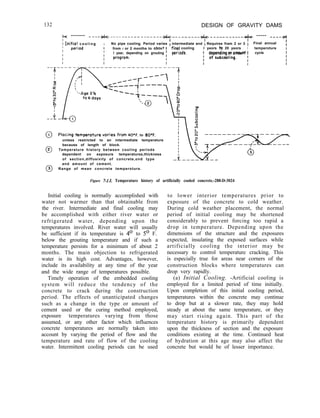
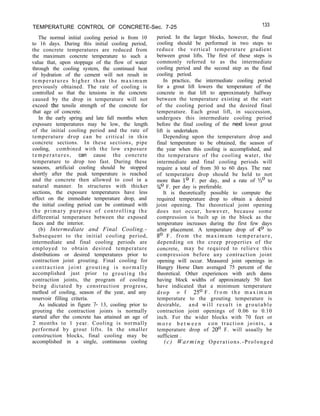
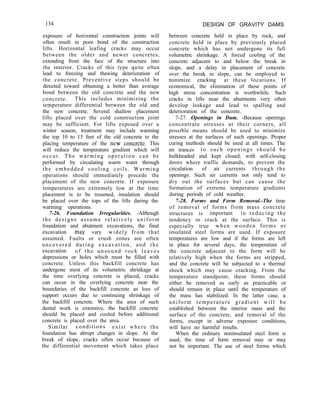
![TEMPERATURE CONTROL OF CONCRETE-Sec. 7-29 135
are kept cool by continuous water sprays will
tend to cause the near-surface concrete to set
at a lower temperature than the interior of the
mass. Form removal can then be accomplished
with no detrimental effects. If, however, water
sprays are not used to modify the temperature
of the steel forms, the early-age temperature
variation of the fact concrete may be even
greater than the daily cycle of air temperature
because of absorbed heat from solar radiation
and reradiation.
7-29. Curing.-Drying shrinkage can cause,
as a skin effect, hairline cracks on the surface
of a mass concrete structure. The primary
objection to these random hairline cracks of
limited depth is that they are usually the
beginning of further and more extensive
cracking and spalling under adverse exposure
conditions. Following the removal of forms,
proper curing is important if drying shrinkage
and resulting surface cracking are to be
avoided. Curing compounds which prevent the
loss of moisture to the air are effective in this
respect, but lack the cooling benefit which can
be obtained by water curing. In effect, water
curing obtains a surface exposure condition
more beneficial than the fluctuating daily air
temperature. With water curing, the daily
exposure cycle is dampened because the daily
variation of the water temperature is less than
that of the air temperature.
A benefit also occurs from the evaporative
cooling effect of the water on the surface. The
evaporative cooling effect is maximized by
intermittent sprays which maintain the surface
of the concrete in a wet to damp condition
with some free water always available.
In general, water curing should be used
instead of membrane curing on mass concrete
structures. Where appearance is of prime
importance, other methods of curing may be
considered because water curing will often
result in stains on the faces. Water curing
during periods of cold weather also can be a
safety problem because of icing hazards.
7-30. Insulation.-During the fall of the year
when placing temperatures are still relatively
high, and during periods of cold weather, the
temperature of the surface concrete tends to
drop rapidly to the exposure temperature. This
may occur while the interior concrete is still
rising in temperature. Such conditions will
cause high tensile stresses to form at the
surface. Surface treatments previously
de scribed can reduce these temperature
gradients, particularly when used in
conjunction with artificial cooling, but the use
of insulation will give greater protection. Such
insulation may be obtained by measures
varying from simply leaving wooden or
insulated forms in place, to the use of
commercial-type insulation applied to the
forms or to the surfaces of the exposed
concrete. Tops of blocks can be protected with
sand or sawdust when an extended exposure
period is anticipated.
Unless required immediately after placement
to prevent surface freezing, the insulation
should be placed after the maximum
temperature is reached in the lift. This permits
loss of heat to the surface and will cause the
near-surface concrete to set at a relatively low
temperature. Normally, during periods of cold
weather, the insulation is removed at such time
as required for placement of the next lift.
Otherwise, it may be removed when the cold
w e a t h e r h a s a b a t e d o r w h e n i n t e r i o r
temperatures have been reduced substantially
below the peak temperatures.
Whatever the type of insulation, measures
should be taken to exclude as much moisture
from the insulation as practicable. The
insulation should also be as airtight as possible.
For a short period of exposure, small space
heaters may be used, either by themselves or in
conjunction with work enclosures. Care should
be taken when using space heaters in enclosed
areas to avoid drying out the concrete surfaces.
F. BIBLIOGRAPHY
7-3 1. Bibliography. Engineering Monograph No. 34, Water Resources
[l] “Control of Cracking in Mass Concrete Structures,” Technical Publication, Bureau of Reclamation, 1965.](https://image.slidesharecdn.com/gravitydams-230723194435-350300a0/85/GravityDams-pdf-167-320.jpg)
![136
[2] Schack, Alfred, “Industrial Heat Transfer,” John Wiley &
Sons, New York, N.Y., 1933.
[3] Jakob, Max, “Heat Transfer,” vol. I, pp. 373-375, John
Wiley & Sons, New York, N.Y., 1949.
[4] Grinter, L . E . , “Numerical Methods of Analysis in
E’ngineering.” p. 86, Macmillan Co., New York, N.Y.,
1949.
[5] “A Simple Method for the Computation of Temperatures
in Concrete Structures,” AC1 Proceedings, vol. 34
(November-December 1937 AC1 Journal).
DESIGN OF GRAVITY DAMS
[6] “Thermal Properties of Concrete,” Part VII, Bulletin No.
1, Boulder Canyon Project Final Reports, Bureau of
Reclamation, 1940.
[7] “Cooling of Concrete Dams,” Part VII, Bulletin No. 3,
Boulder Canyon Project Final Reports, Bureau of
Reclamation, 1949.
[8] “Insulation Facilitates Winter Concreting,” Engineering
Monograph No. 22, Bureau of Reclamation, 1955.
[9] Kinley, F. B., “Refrigeration for Cooling Concrete Mix,”
Air Conditioning, Heating and Ventilating, March 1955.](https://image.slidesharecdn.com/gravitydams-230723194435-350300a0/85/GravityDams-pdf-168-320.jpg)
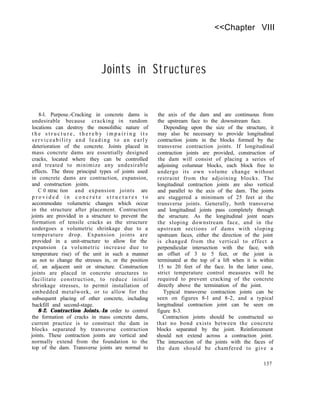

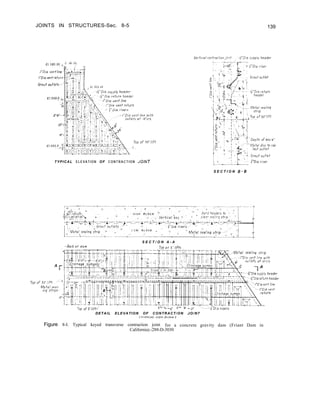
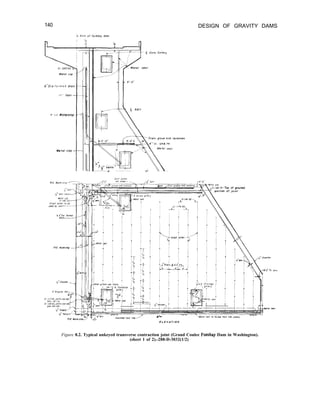
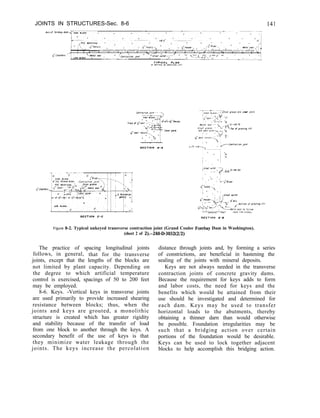
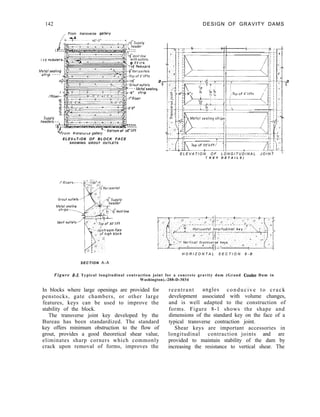
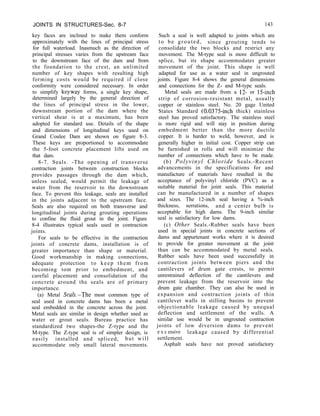
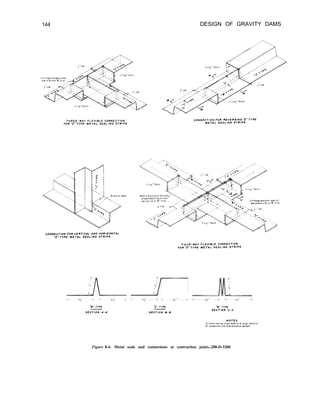
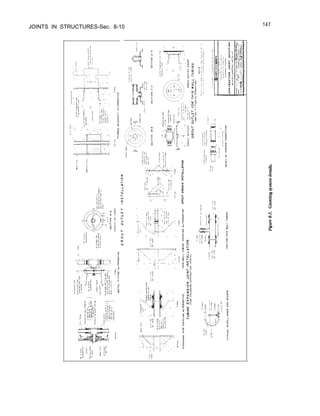
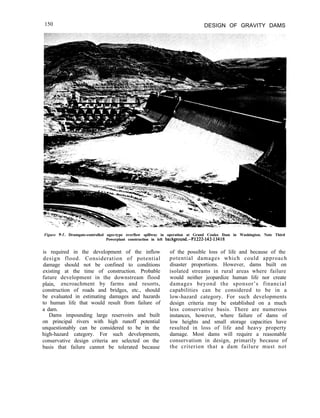
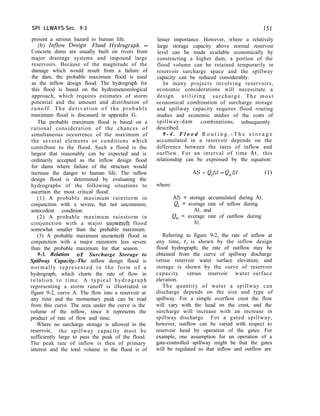
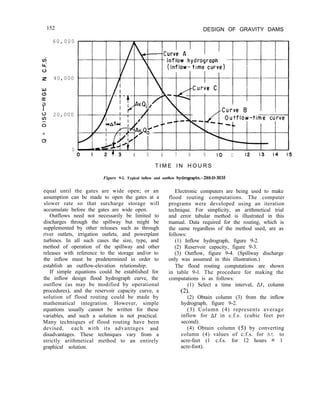
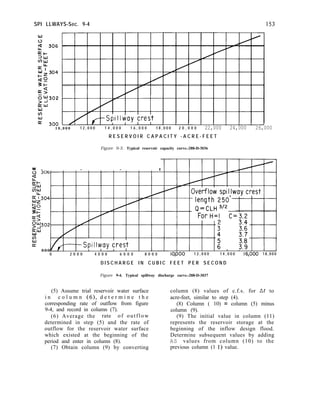
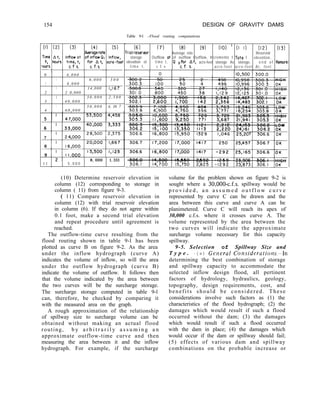
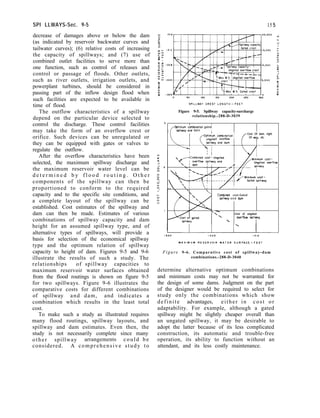
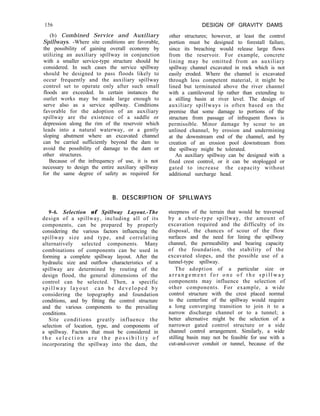
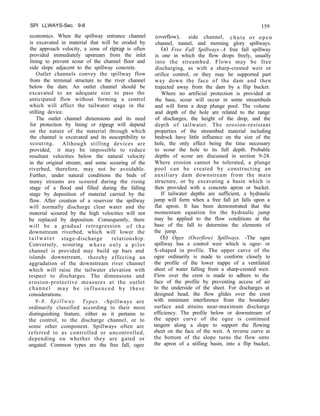
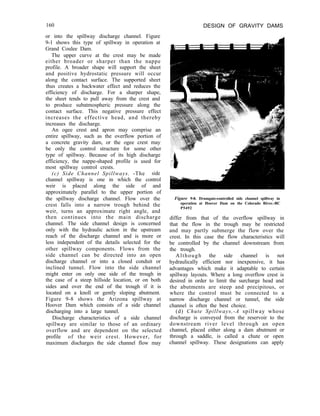
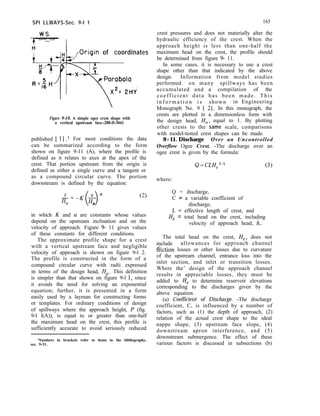
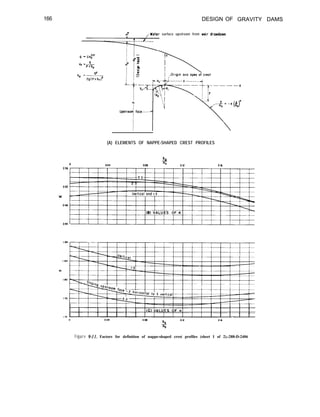
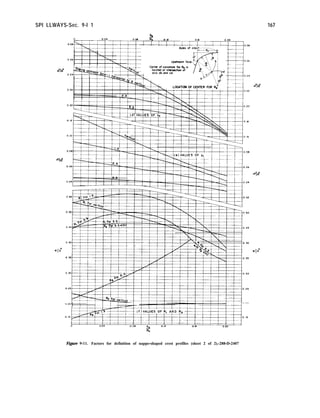
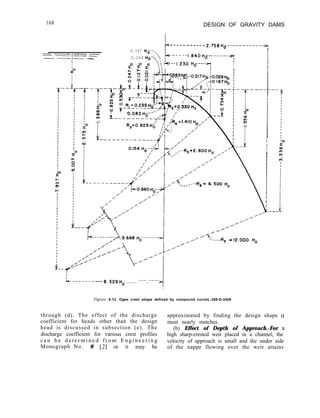
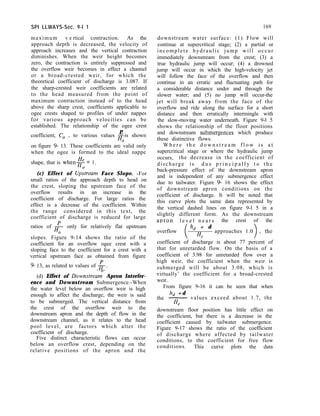
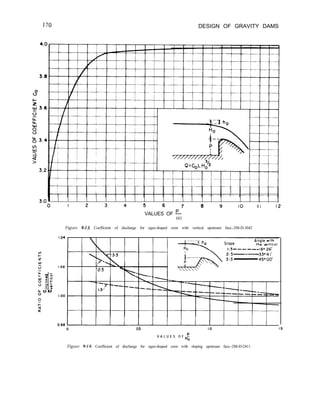
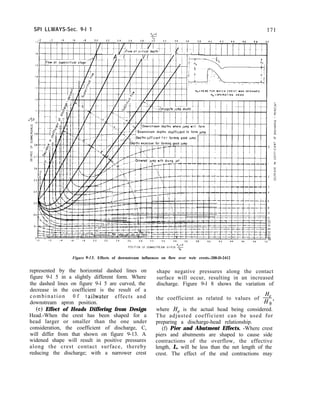
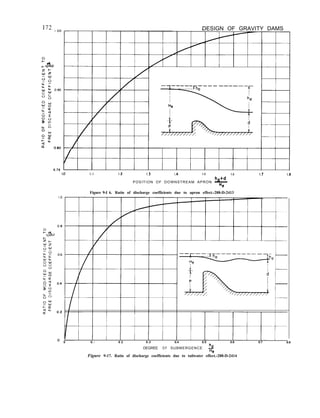
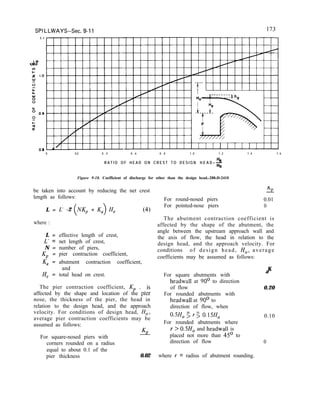
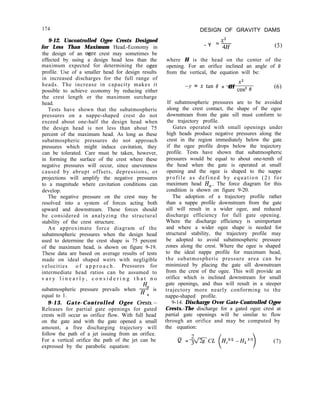
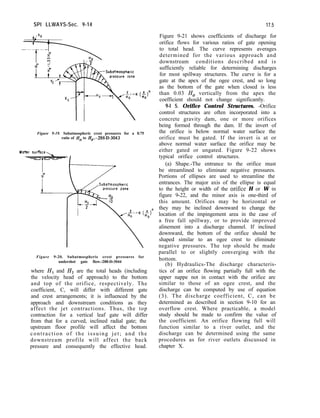
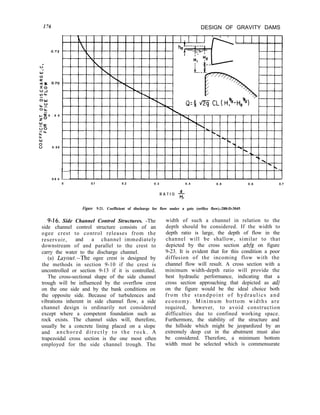
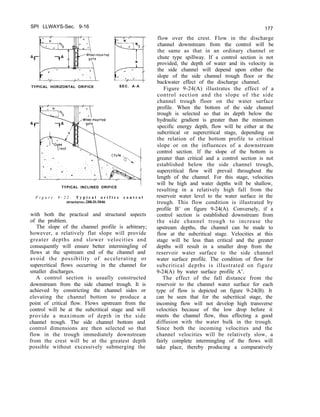
![178 DESIGN OF GRAVITY DAMS
Figure 9-23. Comparison of side channel cross sections.-288-D-2419
smooth flow in the side channel. Where the
channel flow is at the supercritical stage, the
channel velocities will be high, and the
intermixing of the high-energy transverse flow
with the channel stream will be rough and
turbulent. The transverse flows will tend to
sweep the channel flow to the far side of the
channel, producing violent wave action with
attendant vibrations. It is thus evident that
flows should be maintained at subcritical stage
for good hydraulic performance. This can be
achieved by establishing a control section
downstream from the side channel trough.
Variations in the design can be made by
assuming different bottom widths, different
channel slopes, and varying control sections. A
proper and economical design can usually be
achieved after comparing several alternatives.
(b) Hydraulics.-The theory of flow in a
side channel [3] is based principally on the law
of conservation of linear momentum, assuming
that the only forces producing motion in the
channel result from the fall in the water surface
in the direction of the axis. This premise
assumes that the entire energy of the flow over
the crest is dissipated through its intermingling
with the channel flow and is therefore of no
assistance in moving the water along the
channel. Axial velocity is produced only after
the incoming water particles join the channel
stream.
For any short reach of channel Ax, the
change in water surface, Ay, can be determined
by either of the following equations:
@ =$;;‘y; )) Iv2 -vl ) + lJz (Q2iQl)] C8)
1 2 1
ay = e, (Vl +vz 1 VI (Q,-Q,)
g (Q,+Q,> (v2-v1) + Q, 1 (9)
where Q, and v1 are values at the beginning of
the reach and Q, and v2 are the values at the
end of the reach. The derivation of these
formulas can be found in reference [ 31.
By use of equation (8) or (9), the water
surface profile can be determined for any
particular side channel by assuming successive
short reaches of channel once a starting point is
found. The solution of equation (8) or (9) is
obtained by a trial-and-error procedure. For a
reach of length Ax in a specific location, Q,
and Q, will be known.](https://image.slidesharecdn.com/gravitydams-230723194435-350300a0/85/GravityDams-pdf-210-320.jpg)
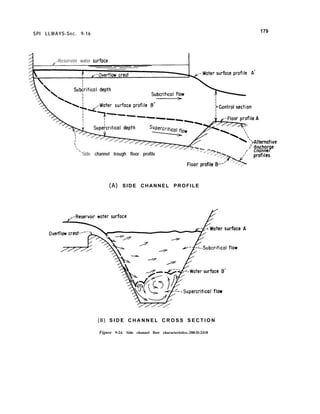
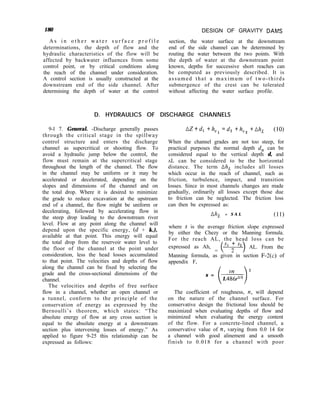
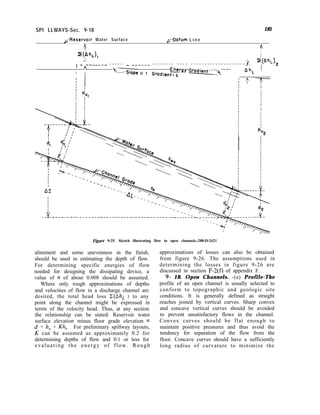
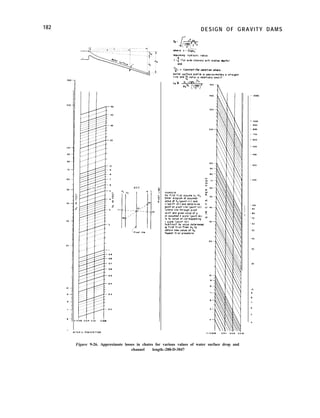
![SPI LLWAYS-Sec. 9-18
dynamic forces on the floor brought about by
the centrifugal force which results from a
change in the direction of flow.
To avoid the tendency for the water to
spring away from the floor and thereby reduce
the surface contact pressure, the floor shape
for convex curvature should be made
substantially flatter than the trajectory of a
free-discharging jet issuing under a head equal
to the specific energy of flow as it enters the
curve. The curvature should approximate a
shape defined by the equation:
183
radii of not less than 5d have been found
acceptable.
(b) Convergence and Divergence. -The best
hydraulic performance in a discharge channel is
obtained when the confining sidewalls are
parallel and the distribution of flow across the
channel is maintained uniform. However,
economy may dictate a channel section
narrower or wider than either the crest or the
terminal structure, thus requiring converging or
diverging transitions to fit the various
components together. Sidewall convergence
must be made gradual to avoid cross waves,
“ r i d e u p s ” o n the walls, and uneven
distribution of flow across the channel.
Similarly, the rate of divergence of the
sidewalls must be limited or else the flow will
not spread to occupy the entire width of the
channel uniformly, which may result in
undesirable flow conditions at the terminal
structure.
The inertial and gravitational forces of
streamlined kinetic flow in a channel can be
expressed by the Froude number parameter,
2. Variations from streamlined flow due to
da
outside interferences which cause an expansion
or a contraction of the flow also can be related
to this parameter. Experiments have shown
that an angular variation of the flow
boundaries not exceeding that produced by the
equation,
X2
-’ = x tane +K[4(d+h,)cos2 e] (12)
where 0 is the slope angle of the floor upstream
from the curve. Except for the factor K, the
equation is that of a free-discharging trajectory
issuing from an inclined orifice. To assure
positive pressure along the entire contact
surface of the curve, K should be equal to or
greater than 1 S.
For the concave curvature, the pressure
exerted upon the floor surface by the
centrifugal force of the flow will vary directly
with the energy of the flow and inversely with
the radius of curvature. An approximate
relationship of these criteria can be expressed
in the equations:
R = % or R - 2dv2
P P
where :
R = the minimum radius of curvature
measured in feet,
4 = the discharge in c.f.s. per foot of
width,
v = the velocity in feet per second,
d = the depth of flow in feet, and
p = the normal dynamic pressure exerted
on the floor, in pounds per square
foot.
An assumed value of p = 100 will normally
produce an acceptable radius; however, a
minimum radius of 1 Od is usually used. For the
reverse curve at the lower end of the ogee crest,
will provide an acceptable transition for either
a contracting or an expanding channel. In this
equation, F = -
&
and (Y is the angular
variation of the sidewall with respect to the
channel centerline; v and d are the averages of
the velocities and depths at the beginning and
at the end of the transition. Figure 9-27 is a
nomograph from which the tangent of the flare
angle or the flare angle in degrees may be
obtained for known values of depth and
velocity of flow.
(c) Channel Freeboard.-In addition to
using a conservative value for y1 in determining](https://image.slidesharecdn.com/gravitydams-230723194435-350300a0/85/GravityDams-pdf-215-320.jpg)
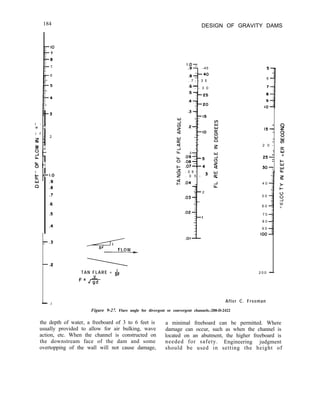
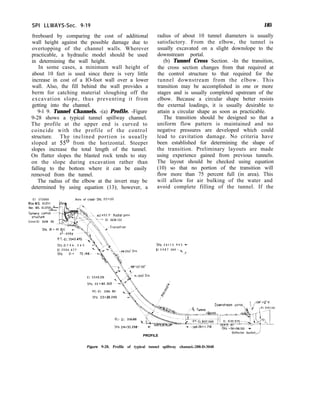
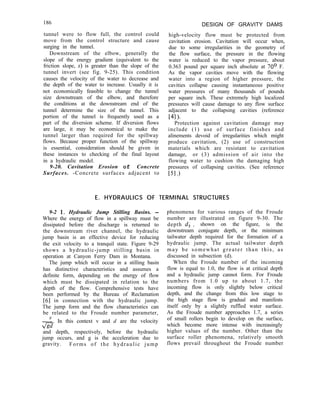
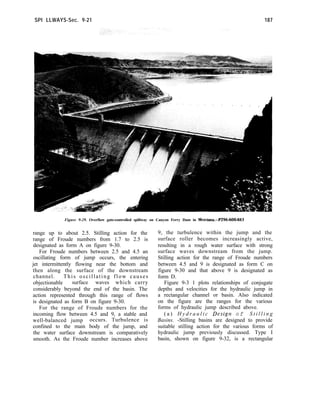
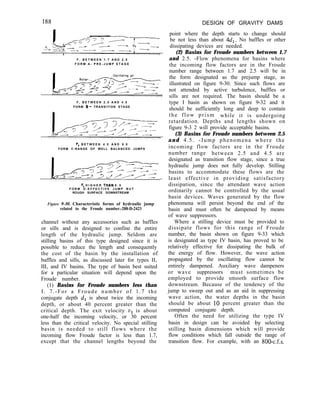
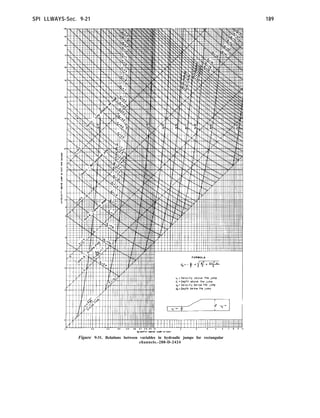
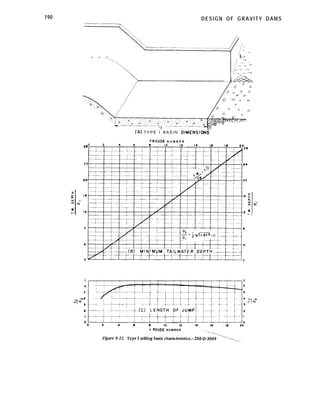
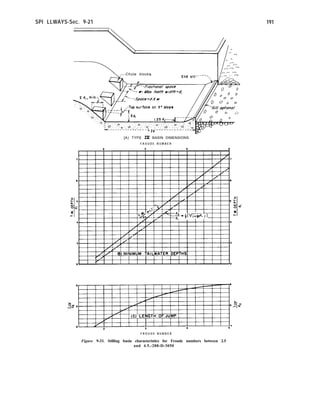
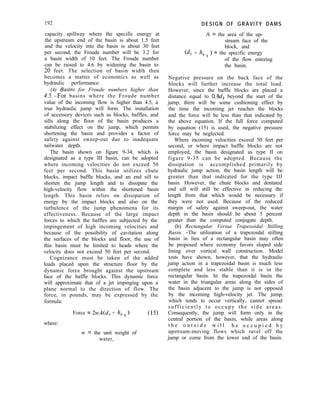
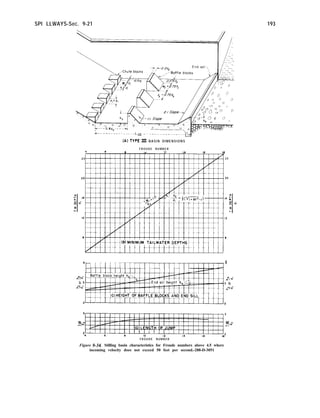
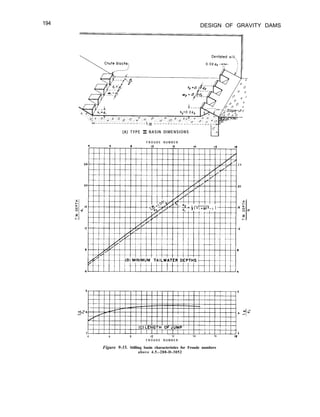
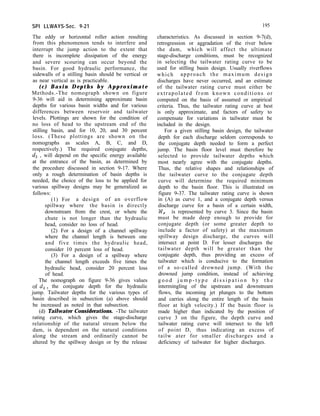
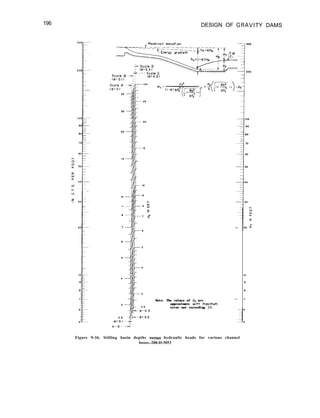
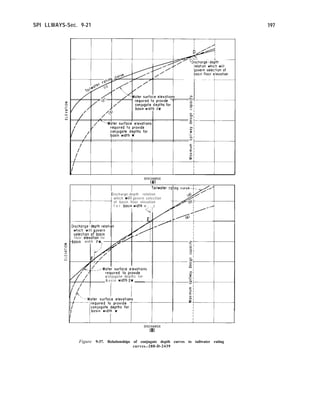
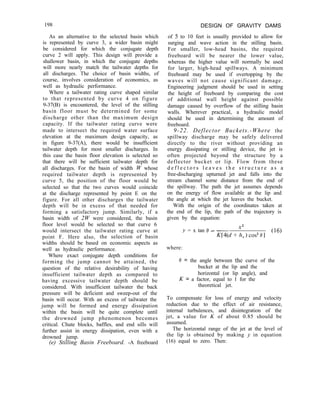
![SPI LLWAYS-Sec. 9-23 199
figure 9-39. The general nature of the
dissipating action for each type is represented
on figure 9-40. Hydraulic action of the two
buckets has the same characteristics, but
distinctive features of the flow differ to the
extent that each has certain limitations. The
high-velocity flow leaving the deflector lip of
the solid bucket is directed upward. This
creates a high boil on the water surface and a
violent ground roller moving clockwise
downstream from the bucket. This ground
roller continuously pulls loose material back
towards the lip of the bucket and keeps some
of the intermingling material in a constant state
of agitation. In the slotted bucket the
high-velocity jet leaves the lip at a flatter angle,
and only a part of the high-velocity flow finds
its way to the surface. Thus, a less violent
surface boil occurs and there is a better
dispersion of flow in the region above the
g r o u n d r o l l e r w h i c h r e s u l t s i n l e s s
concentration of high-energy flow throughout
the bucket and a smoother downstream flow.
Use of a solid bucket dissipator may be
objectionable because of the abrasion on the
concrete surfaces caused by material which is
swept back along the lip of the deflector by the
ground roller. In addition, the more turbulent
surface roughness induced by the severe surface
;oil carries farther down the river, causing
objectionable eddy currents which contribute
to riverbank sloughing. Although the slotted
bucket provides better energy dissipation with
less severe surface and streambed disturbances,
it is more sensitive to sweep-out at lower
tailwaters and is conducive to a diving and
scouring action at excessive tailwaters. This is
not the case with the solid bucket. Thus, the
tailwater range which will provide good
performance with the slotted bucket is much
narrower than that of the solid bucket. A solid
bucket dissipator should not be used wherever
the tailwater limitations of the slotted bucket
can be met. Therefore, only the design of the
slotted bucket will be discussed.
Flow characteristics of the slotted bucket
are illustrated on figure 9-41. For deficient
tailwater depths the incoming jet will sweep
the surface roller out of the bucket and will
produce a high-velocity flow downstream, both
X=4K(d+h,) tan0 co? 8
= 2K(d+h,) sin 28 (17)
The maximum value of x will be equal to
2K (d + h,) when 0 is 45’. The lip angle is
influenced by the bucket radius and the height
of the lip above the bucket invert. It usually
varies from 20’ to 4.5’, with 30’ being the
preferred angle.
The bucket radius should be made long
enough to maintain concentric flow as the
water moves around the curve. The rate of
curvature must be limited similar to that of a
vertical curve in a discharge channel (sec. 9-18),
so that the floor pressures will not alter the
streamline distribution of the flow. The
minimum radius of curvature can be
determined from equation (13), except that
values of p not exceeding 500 pounds per
square foot will produce values of the radius
which have proved satisfactory in practice.
However, the radius should not be less than
five times the depth of water. Structurally, the
cantilever bucket must be of sufficient strength
to withstand this normal dynamic force in
addition to the other applied forces.
Figure 9-38 shows the deflector at the end
of the spillway tunnel at Hungry Horse Dam in
operation.
9 - 2 3 . Su b merged Bucket Energy
Dissipators.-When the tailwater depth is too
great for the formation of a hydraulic jump,
dissipation of the high energy of flow can be
effected by the use of a submerged bucket
deflector. The hydraulic behavior in this type
of dissipator is manifested primarily by the
formation of two rollers; one is on the surface
moving counterclockwise (if flow is to the
right) and is contained within the region above
the curved bucket, and the other is a ground
roller moving in a clockwise direction and is
situated downstream from the bucket. The
movements of the rollers, along with the
intermingling of the incoming flows, effectively
dissipate the high energy of the water and
prevent excessive scouring downstream from
the bucket.
Two types of roller bucket have been
developed and model tested [6] . Their shape
and dimensional arrangements are shown on](https://image.slidesharecdn.com/gravitydams-230723194435-350300a0/85/GravityDams-pdf-231-320.jpg)
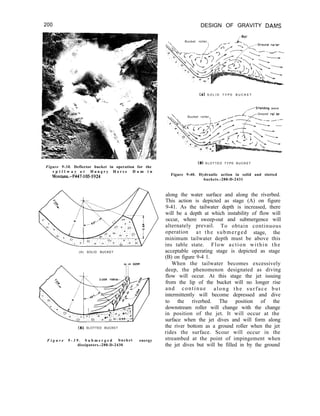
![SPI LLWAYS-Sec. 9-24 201
Tallwater--_
-.
Tailwater below mlnimum. Flaw sweeps out
STAGE (A)
Tailwater below average but above minimum,
Within nom-101 operating range.
STAGE (6) ---0riainol channel bed
Tailwater above mox~mum. Flow diving from
apron scours channel
STAGE (C)
Origmol channel bed--.,
Tailwater same as in C. Diving jet is lifted by ground
roller. Scour hale backfills similar to 6. Cycle repeats.
STAGE (D)
Figure 9-41. Flow characteristics in a slotted
bucket.-288-D-2432
roller when the jet rides. The characteristic
flow pattern for the diving stage is depicted in
(C) and (D) of figure 9-41. Maximum tailwater
depths must be limited to forestall the diving
flow phenomenon.
The design of the slotted bucket involves
determination of the radius of curvature of the
bucket and the allowable range of tailwater
depths. These criteria, as determined from
experimental results, are plotted on figure 9-42
in relation to the Froude number parameter.
The Froude number values are for flows at the
point where the incoming jet enters the bucket.
Symbols are defined on figure 9-43.
9-24. Plunge Pools. -When a free-falling
overflow nappe drops almost vertically into a
pool in a riverbed, a plunge pool will be
scoured to a depth which is related to the
height of the fall, the depth of tailwater, and
the concentration of the flow [7]. Depths of
scour are influenced initially by the erodibility
of the stream material or the bedrock and by
the size or the gradation of sizes of any
armoring material in the pool. However, the
armoring or protective surfaces of the pool will
be progressively reduced by the abrading action
of the churning material to a size which will be
scoured out, and the ultimate scour depth will,
for all practical considerations, stabilize at a
limiting depth irrespective of the material size.
An empirical approximation based on
experimental data has been developed by
Veronese [8] for limiting scour depths, as
follows:
where :
d, = 1.32 @.225 qo.s4 (18)
d, = the maximum depth of scour
below tailwater level
in feet,
H, = the head from reservoir level to
tailwater level in feet,
and
4 = the discharge in c.f.s. per
foot of width.
Three Bureau of Reclamation dams which
have plunge pools for energy dissipators have
been tested in hydraulic models. Reports of the
results of these tests are given in references
[91, [lOl,and [ill.
F. HYDRAULICS OF MORNING GLORY (DROP INLET) SPILLWAYS
9 - 25. General Characteristics. -The flow respect that, in normal operation, the control
conditions and discharge characteristics of a changes as the head changes. As brought out in
morning glory spillway are unique in the the following discussion, at low heads the crest](https://image.slidesharecdn.com/gravitydams-230723194435-350300a0/85/GravityDams-pdf-233-320.jpg)
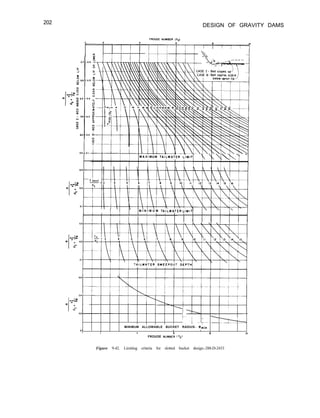
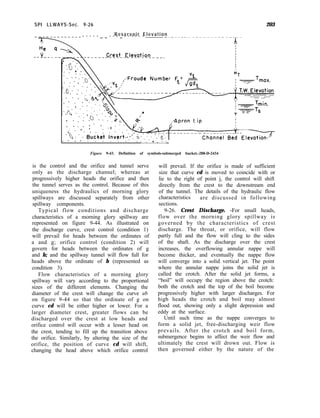
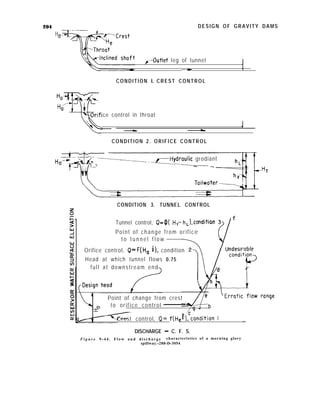
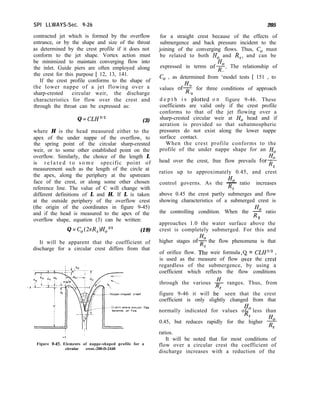
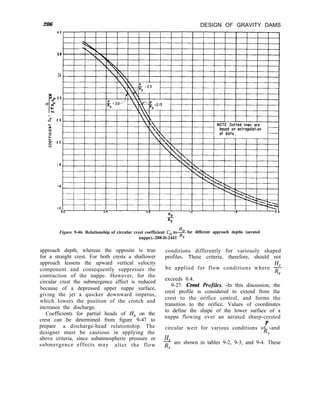
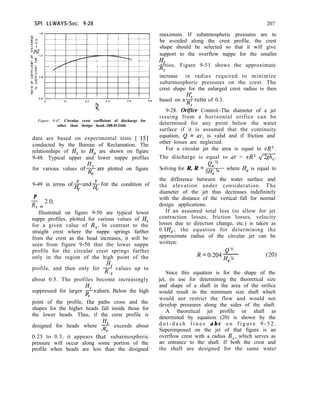
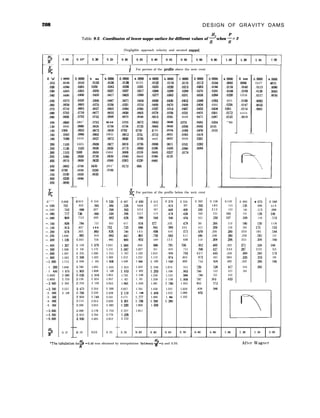
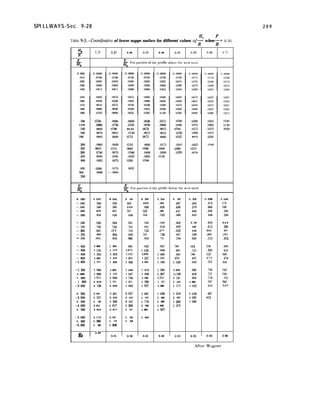
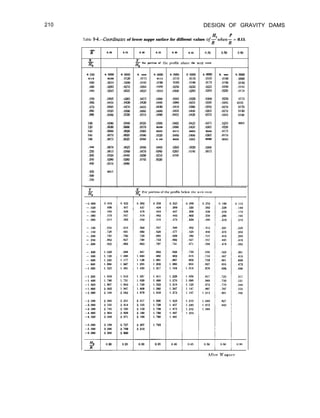
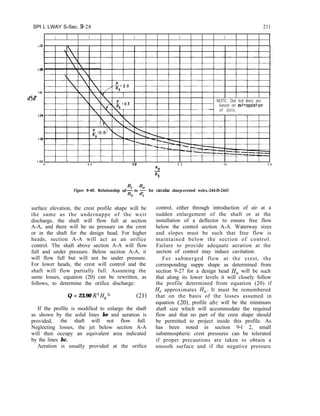
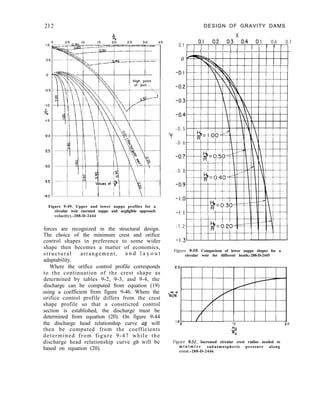
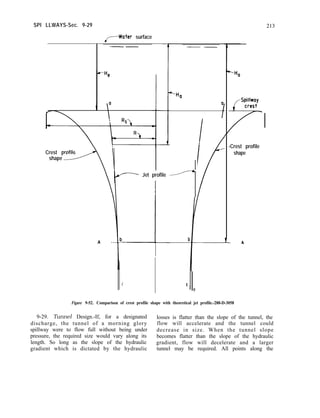
![SPI LLWAYS-Sec. 9-31 215
water pressures should be considered in Normal methods of design should be used
addition to the static water pressures in all for walls, slabs, etc. Where special design
cases. Wherever practicable, laboratory model problems are encountered, the finite element
tests should be used to determine hydraulic method of analysis (appendix F) can be used to
loads, particularly dynamic loads. determine the stresses.
H. BIBLIOGRAPHY
9-3 1. Bibliography.
[l] Bureau of Reclamation, “Studies of Crests of Overfall
Dams,” Bulletin 3, Part VI, Hydraulic Investigations,
Boulder Canyon Project Final Reports, 1948.
[2] Bureau of Reclamation, “Discharge Coefficients For
Irregular Overfall Spillways,” Engineering Monograph
No. 9,1952.
[3] Hinds, Julian, “Side Channel Spillways,” Trans. ASCE,
vol. 89, 1926, p. 881.
[4] Ball, J. W., “Construction Finishes and High-Velocity
Flow ))’ Journal of the Construction Division, ASCE
Proceedings, September 1963.
[5] Colgate, D. M., “Hydraulic Model Studies of Aeration
Devices For Yellowtail Dam Spillway Tunnel,”
Pick-Sloan Missouri River Basin Program, Montana,
REC-ERC-7147,197l.
[6] Bureau of Reclamation, “Hydraulic Design of Stilling
Basin and Bucket Energy Dissipators,” Engineering
Monograph No. 25,1964. -
[7] Doddiah, D., Albertson, M. L., and Thomas, R. A.,
“Scour From Jets,” Proceedings, Minnesota
International Association for Hydraulic Research and
Hydraulics Division, ASCE, Minneapolis, Minn., August
1953,~. 161.
[B] Scimemi, Ettore, “Discussion of Paper ‘Model Study of
Brown Canyon Debris Barrier’ by Bermeal and Sanks,”
Trans. ASCE, vol. 112,1947,p. 1016.
191 Bureau of Reclamation, “Hydraulic Model Studies of
Morrow Point Dam Spillway, Outlet Works and
Powerplant Tailrace,” Report No. HYD-557. 1966.
[lo] Bureau of Reclamation, “Hydraulic Model Studies of the
Pueblo Dam Spillway and Plunge Basin,”
REC-ERC-71-18, 1971.
[ll] Bureau of Reclamation, “Hydraulic Model Studies of
Crystal Dam Spillway and Outlet Works,”
REC-ERC-72-01, 1972.
[12] Peterka, A. J., “Morning-Glory Shaft Spillways,” Trans.
ASCE, vol. 121,1956, p. 385.
[13] Bradley, J. N., “Morning-Glory Shaft Spillways:
Prototype Behavior,” Trans. ASCE, vol. 121, 1956, p.
312.
[14] Blaisdell. F. W., “Hydraulics of Closed Conduit
Spillways-Parts II through VII-Results of Tests on
Several Forms of the SuiIlwav.” University of
Minnesota, Saint Anthony Falls Hydraulic Laboratory,
Technical Paper No. 18, series B, March 1958.
[15] Wagner, W. E., “Morning Glory Shaft Spillways:
Determination of Pressure-Controlled Profiles,” Trans.
ASCE, vol. 121,1956,p. 345.](https://image.slidesharecdn.com/gravitydams-230723194435-350300a0/85/GravityDams-pdf-247-320.jpg)

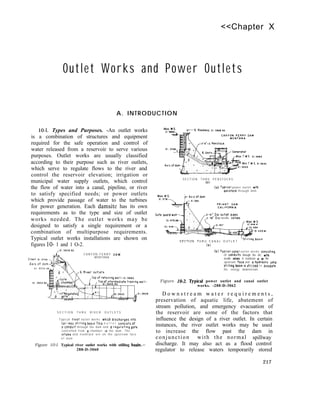
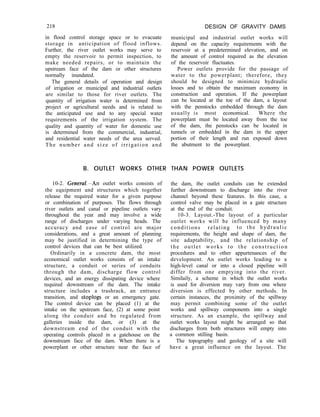
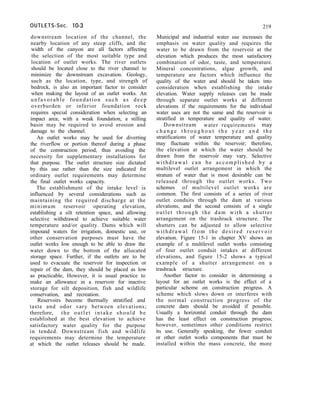
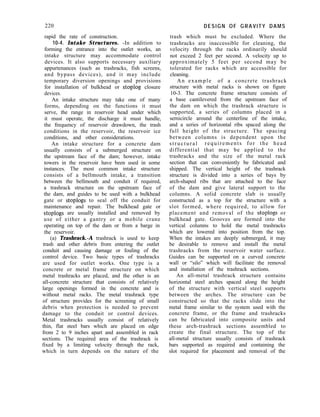
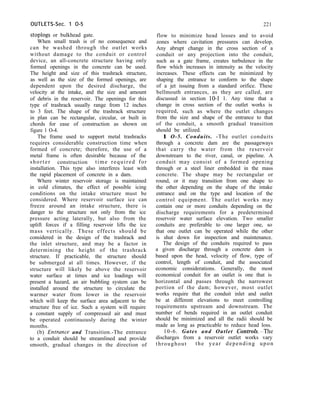
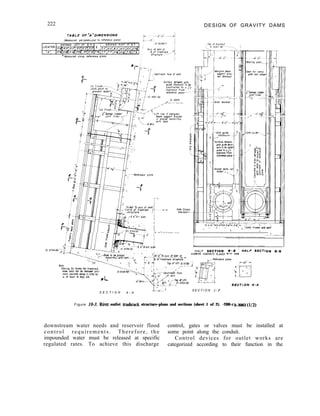
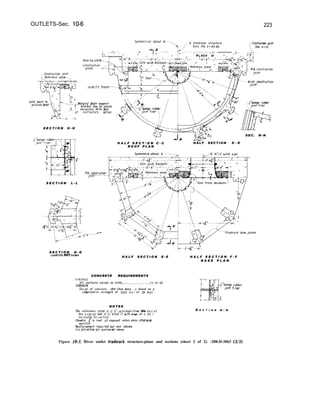
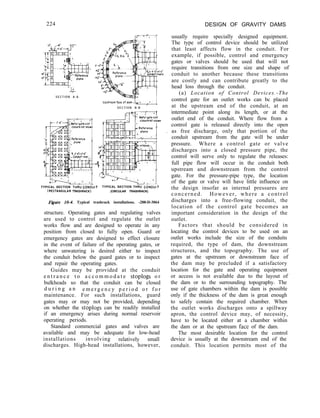
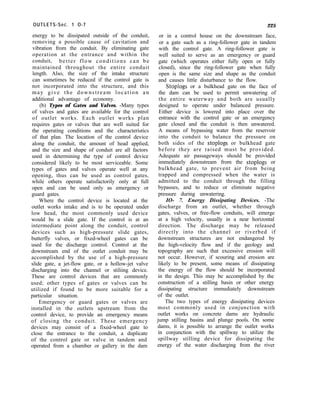
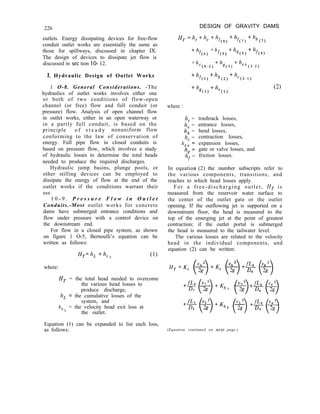
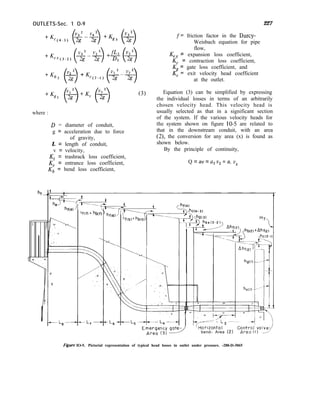
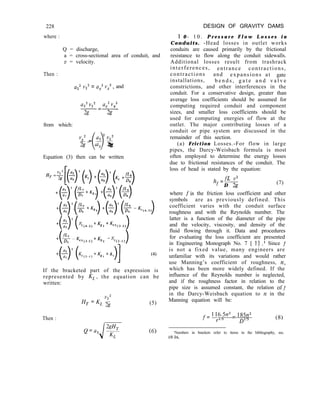
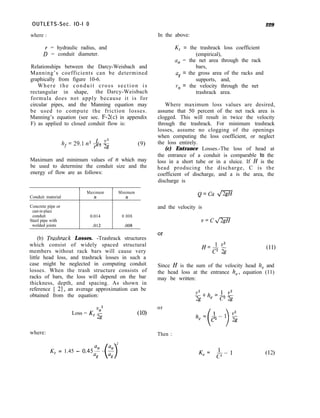
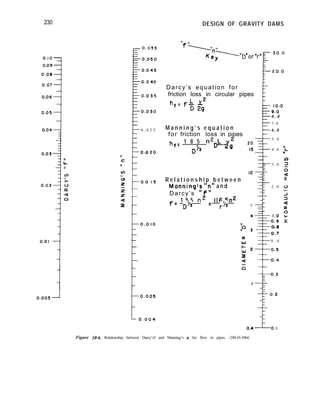
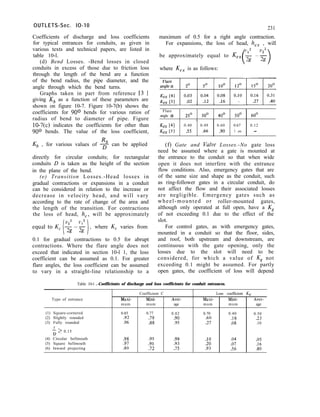
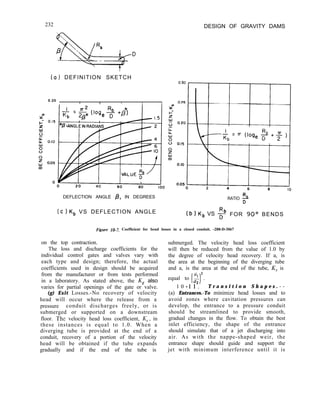
![OUTLETS-Sec. lo-12
contracted to the dimensions of the conduit. If
the entrance curve is too sharp or too short,
subatmospheric pressure areas may develop
which can induce cavitation. A bellmouth
entrance which conforms to or slightly
encroaches upon the free-jet profile will
provide the best entrance shape. For a circular
entrance, this shape can be approximated by an
elliptical entrance curve represented by the
equation:
2
(OFiD) +
2
co:5Dy =l
where x and y are coordinates whose x-x axis is
parallel to and 0.650 from the conduit
centerline and whose y-y axis is normal to the
conduit centerline and 0.5D downstream from
the entrance face. The factor D is the diameter
of the conduit at the end of the entrance
transition.
The jet issuing from a square or rectangular
opening is not as easily defined as one issuing
from a circular opening; the top and bottom
curves may differ from the side curves both in
length and curvature. Consequently, it is more
difficult to determine a transition for a square
or rectangular opening which will eliminate
subatmospheric pressures. An elliptical curved
entrance which will tend to minimize the
negative pressure effects is defined by the
equation:
x2 + AL3 = ]
D2 ( 0 . 3 3 0 ) (14)
where D is the vertical height of the conduit
for defining the top and bottom curves, and is
the horizontal width of the conduit for
defining the side curves. The major and minor
axes are positioned similarly to those indicated
for the circular bellmouth.
( b) Con tractions and Expansions. -To
minimize head losses and to avoid cavitation
tendencies along the conduit surfaces,
contraction and expansion transitions to and
from gate control sections in a pressure conduit
should be gradual. For contractions, the
maximum convergent angle should not exceed
that indicated by the relationship:
tan Q! = t
233
(15)
where :
(Y = the angle of the conduit wall
surfaces with respect to its
centerline, and
U = an arbitrary parameter = -
The values of v and D are the averages of the
velocities and diameters at the beginning and
end of the transition.
Expansions should be more gradual than
contractions because of the danger of
cavitation where sharp changes in the side walls
occur. Furthermore, as has been indicated in
s e c t i o n 10-10(e), loss coefficients for
expansions increase rapidly after the flare angle
exceeds about loo. Expansions should be
based on the relationship:
1
tan (Y = 2u (16)
The notations are the same as for equation
(15). For usual installations, the flare angle
should not exceed about loo.
The criteria for establishing maximum
contraction and expansion angles for conduits
flowing partly full are the same as those for
open channel flow, as given in section 9-18(b)
of chapter IX.
1 0 - 1 2 . E n e r g y D i s s i p a t i n g
Devices. -Whenever practicable, the outlet
works should be located so that the spillway
energy dissipating structures can also be used
to still the flow of the outlet works. Deflector
buckets and hydraulic jump basins are
commonly designed for stilling both outlet
works and spillway flows when the outlet
works flow can be directed into the spillway
stilling basin. The hydraulic design for
free-flow spillways and outlet works is
discussed in chapter IX. Plunge pools and
hydraulic jump stilling basins designed only for
outlet works are discussed below.
(a) Hydraulic Jump Basins.-Where the
outlet works discharge consists of jet flow, the](https://image.slidesharecdn.com/gravitydams-230723194435-350300a0/85/GravityDams-pdf-265-320.jpg)
![234 DESIGN OF GRAVITY DAMS
been developed by Veronese [8] for limiting
scour depths, as follows:
open-channel flow hydraulic jump stilling
basins mentioned above are not applicable. The
jet flow either has to be directed onto the
transition floor approaching the basin so it will
become u n i f o r m l y d i s t r i b u t e d , t h u s
establishing open-channel flow conditions at
the basin, or a special basin has to be designed.
The design of such a basin that will work
well at all discharges is difficult using
theoretical calculations, and model tests should
be conducted to finalize all designs if
practicable. The Bureau of Reclamation
hydraulic laboratory has developed generalized
designs of several kinds of basins based upon
previously run model tests. General design rules
are presented so that the necessary dimensions
for a particular structure may be easily and
quickly determined. One such example is the
design of a hydraulic jump basin to still the jet
flow from a hollow-jet valve. This basin is
about 50 percent shorter than a conventional
basin. The stilling basin is designed to take
advantage of the hollow-jet shape, so solid jets
cannot be used. The general design procedure
can be found in Engineering Monograph No. 25
161.
(b) Plunge Pools.-Where the flow of an
outlet conduit issues from a downstream
control valve or freely discharging pipe, a
riprap- or concrete-lined plunge pool might be
utilized. Such a pool should be employed only
where the jet discharges into the air and then
plunges downward into the pool.
When a free-falling overflow nappe drops
vertically into a pool in a riverbed, a plunge
pool will be scoured to a depth which is related
to the height of the fall, the depth of tailwater,
and the concentration of the flow [ 71. Depths
of scour are influenced initially by the
erodibility of the stream material or the
bedrock and by the size or the gradation of
sizes of any armoring material in the pool.
However, the armoring or protective surfaces
of the pool will be progressively reduced by the
abrading action of the churning material to a
size which will be scoured out and the ultimate
scour d e p t h w i l l , f o r a l l p r a c t i c a l
considerations, stabilize at a limiting depth
irrespective of the material size. An empirical
approximation based on experimental data has
d, = 1.32 H;2== q”es (17)
where :
d,, = the maximum depth of scour
below tailwater level in feet,
H, = the head from the reservoir to
tailwater levels in feet, and
q = the discharge in cubic feet per
second per foot of width. (The
width used for a circular
valve or discharge pipe should
be the diameter.)
Plunge pools used as energy dissipators
should be tested in hydraulic models or, if
possible, compared with similar designs in use
or previously tested in a hydraulic model.
10-13. Open Channel Flow in Outlet
Works.-If the outlet control gate or valve is at
the upstream end or at some point along the
conduit, open channel flow may exist
downstream of the control; however, upstream
of the control the flow is under pressure and
the analysis is similar to that discussed in
previous sections. The conduit downstream of
the control may be enlarged or flared to assure
nonpressure conditions, if desired. When open
channel flow conditions exist, the design
procedures are similar to those for open
channel spillway flow discussed in chapter IX.
An example of an outlet works with open
channel flow downstream of the control gate is
shown on figure 1 O-8.
2. Strucforal Design of Outlet Works
10-14. General.-The structural design of an
outlet works is dependent upon the actual
characteristics of that feature, the head, where
the outlet works are incorporated in the dam
the stresses in the dam due to externa;
loadings, and temperature. The design criteria
for each component of the outlet works should
be established for the conditions which exist or](https://image.slidesharecdn.com/gravitydams-230723194435-350300a0/85/GravityDams-pdf-266-320.jpg)
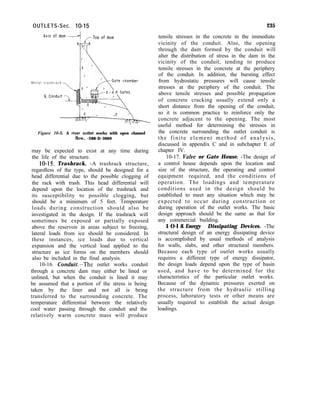
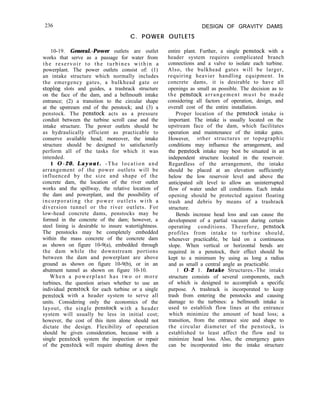
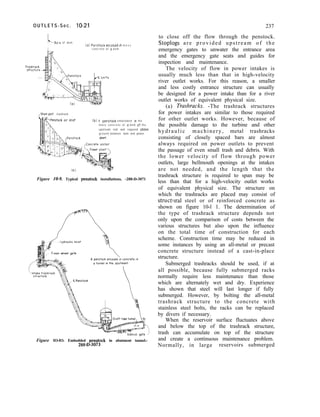
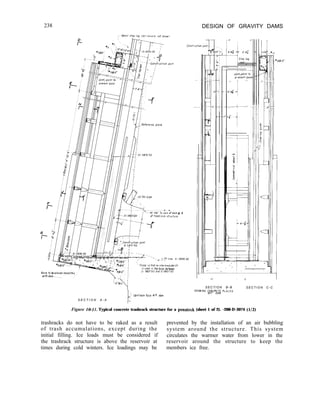
![OUTLETS-Sec. lo-21 239
E/594000-- ] , ,)& 1 -’ 1
o/one ._ 1,
H A L F S E C T I O N D - D H A L F S E C T I O N E - E
Symmetr~coi a b o u t @
‘fq(&
-Tl
k---No chomfe!
S E C T I O N J - J
: - No chamfer
S E C T I O N H - H
CONCRETE FINISHES
Ail streomhned surface of ribs and columns ~40r UJ
A l l o t h e r rurfoces Q or~2
base piotes
N O T E S
The reference plane is 8’.6”upstreom of ox~s at @ of trashrock
structure at El 604500 wrth o slope of 0 172.1 -horn? to vert
Chamfer f’or tool al/exposed corners unless otherwse specihed
H A L F S E C T I O N F - F H A L F S E C T I O N G - G
To reference
S E C T I O N L - L S E C T I O N P - P SECTION K-K
reference
Figure 10-11. Typical concrete trashrack structure for a penstock (sheet 2 of 2). -288-D-3074 (2/2)](https://image.slidesharecdn.com/gravitydams-230723194435-350300a0/85/GravityDams-pdf-271-320.jpg)
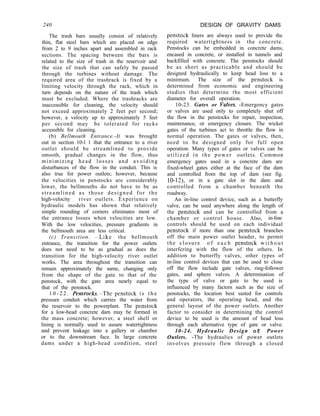
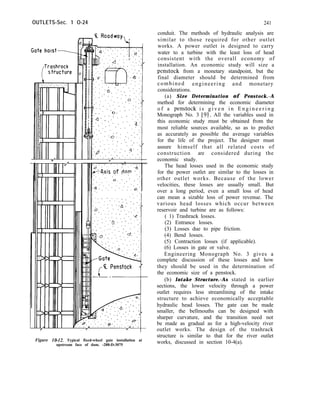
![242
10-25. Structural Design of Power
Outlets.-The structural design of a power
o u t l e t i s d e p e n d e n t u p o n t h e a c t u a l
characteristics of the power outlet works: the
head; and where applicable, the stresses within
the dam, due to temperature, gravity, and
external loads. The design criteria for power
outlet works should be established for the
conditions which exist or may be expected to
exist at any time during the operation or life of
the structure.
(a) Trashrack.-The design of a trashrack
structure for a power outlet should be based on
a head differential of 5 feet due to partial
clogging of trash. This small head differential
minimizes power loss and is sufficient for the
low velocities at which the power outlets
operate. Ice loads should be applied in cold
climates if the trashrack is exposed or partially
exposed above the reservoir. Temperature loads
during construction should also be investigated
in the design procedures.
(b) Penstocks. -The penstocks through a
concrete dam are usually lined with a steel
DESIGN OF GRAVITY DAMS
shell; however, for low heads, penstocks may be
simply a formed opening through the dam.
Most penstock linings begin downstream from
the transition. Therefore, when designing
reinforcement around the penstocks, two
conditions, lined and unlined, are usually
present. In the area through which the
penstocks are lined, a reasonable portion of the
stresses may be assumed to be taken by the
liner and not transferred to the surrounding
concrete. Hydrostatic bursting pressures,
concentration of the stresses within the dam,
and temperature differentials between the
water in the penstock and the mass concrete all
may create tensile stresses in the concrete at
the periphery of the penstock. Reinforcement
is therefore placed around the penstock within
the areas of possible tensile stress. A common
method of analysis to determine the stresses in
the concrete is a finite element study using a
computer for the computations. Bursting
pressures, dam loadings, and temperature
variations can all be incorporated into this
analysis to design the required reinforcement.
D. BIBLIOGRAPHY
[l
[2
] Bradley, J. N., and Thompson, L. R., “Friction Factors
for Large Conduits Flowing Full,” Engineering
Monograph No, 7, Bureau of Reclamation, March 1951.
] Creager, W . P . , a n d J u s t i n , J . D . , “ H y d r o e l e c t r i c
H,andbook.” second edition. John Wilev & Sons. Inc..
10-26. Bibliography.
New York:N. Y., 1954.
[3] “Hydraulic Design Criteria, Sheet 228-1, Bend Loss
Coefficients,” Waterways Experiment Station, U.S. Army
Engineers, Vicksburg, Miss.
[4] King, W. H., “Handbook of Hydraulics,” fourth edition,
McGraw Hill Book Co., Inc., New York, N. Y., 1954.
[5] Rouse, Hunter, “Engineering Hydraulics,” John Wiley &
Sons, Inc., New York, N. Y., 1950.
[6] “Hydraulic Design of Stilling Basins and Energy
Dissipators,” Engineering Monograph No. 25, Bureau of
Reclamation, 1964.
[7] Doddiah, D., Albertson, M. L., and Thomas, R. A., “Scour
From Jets,” Proceedings, Minnesota International
Hydraulics Convention (Joint Meeting of International
Association for Hydraulic Research and Hydraulics
Division, ASCE), Minneapolis, Minn., August 1953, p.
161.
[8] Scimemi, Ettore, “Discussion of Paper ‘Model Study of
Brown Canyon Debris Barrier’ by Bermeal and Sanks,”
Trans. ASCE,vol. 112,1947, p. 1016.
[9] “Welded Steel Penstocks,” Engineering Monograph No. 3,
Bureau of Reclamation, 1967.](https://image.slidesharecdn.com/gravitydams-230723194435-350300a0/85/GravityDams-pdf-274-320.jpg)
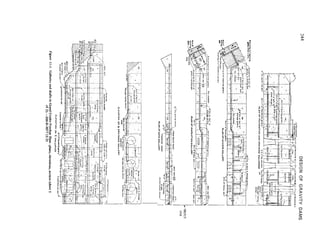
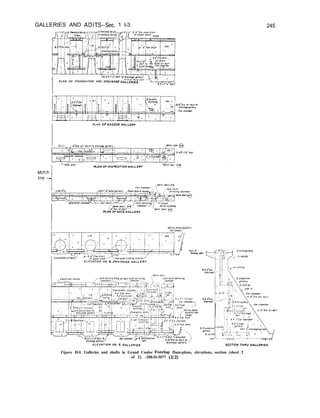
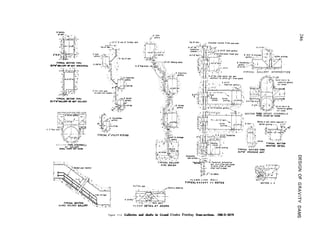
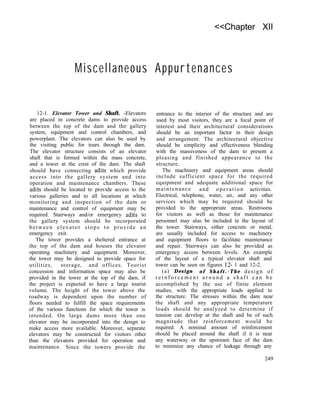
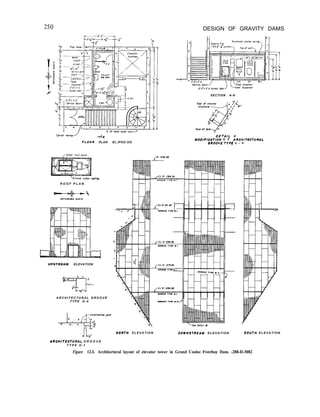

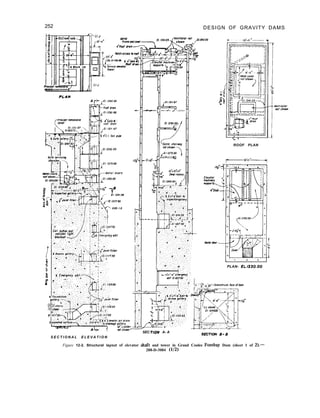
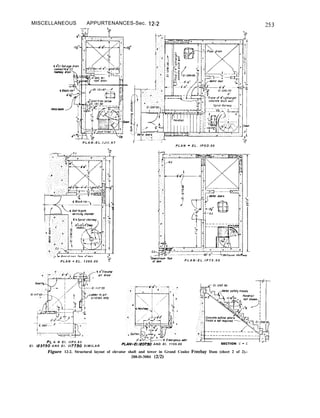
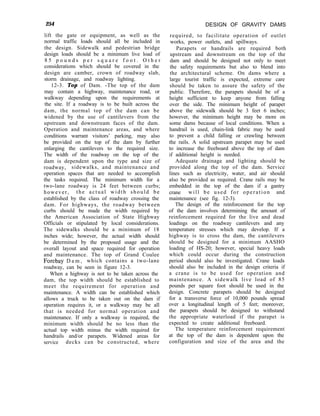
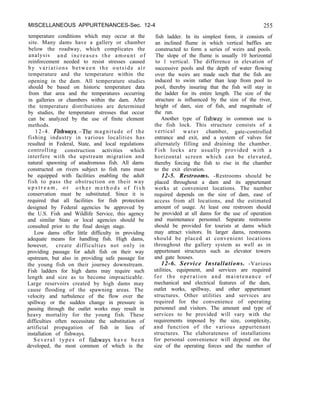
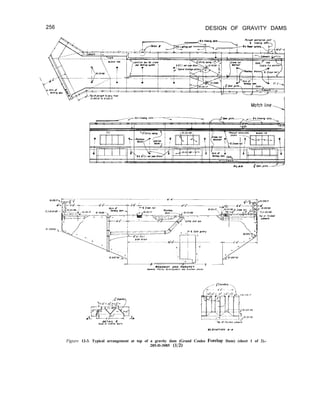
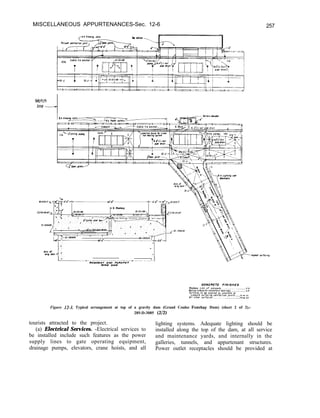
![<<Chapter XIII
Structural Behavior Measurements
13-1. Scope and Purpose. -Knowledge of
the behavior of a concrete gravity dam and its
foundation may be gained by studying the
service action of the dam and the foundation,
using measurements of an external and an
internal nature. Of primary importance is the
information by which a continuing assurance
of the structural safety of the dam can be
gaged. Of secondary importance is information
on structural behavior and the properties of
concrete that may be used to give added
criteria for use in the design of future concrete
gravity dams.
In order to determine the manner in which a
dam and its foundation behave during the
periods of construction, reservoir filling, and
service operations, measurements are made on
the structure and on the foundation to obtain
actual values of behavior criteria in terms of
strain, temperature, stress, deflection, and
deformation of the foundation. Properties of
the concrete from which the dam is
constructed, such as temperature coefficient,
modulus of elasticity, Poisson’s ratio, and
creep, are determined in the laboratory.
( a ) D e v e l o p m e n t o f M e t h o d s . - T h e
investigations of the behavior of concrete dams
began at least 50 years ago, and have included
scale model and prototype structures. Reports
on the investigations are available in references
[ 1 I, [2], and [31 .I Along with the
development of instruments [4] to use for
measurements, and the instrumentation
programs, there was the development of a
suitable method for converting strain, as
determined in the concrete which creeps under
‘Numbers in brackets refer to items in the bibliography sec.
13-l 1.
load [5], to stresses that are caused by the
measured deformation [6] . The basic method,
which departs from simple Hooke’s law
relationships obtained for elastic materials, has
been presented in reference [7] with later
refinements presented in other publications
[8, 91. As analyses of the behavioral data from
dams were completed, reports on the results of
the investigations became available [ 10, 11 I .
Similarly, reports on the results of
investigations of foundation behavior have
become available [ 12, 131.
(b) Two General Methods.-At a major
concrete dam, two general methods -of
measurement are used to gain the essential
behavioral information, each method having a
separate function in the overall program.
The first method of measurement involves
several types of instruments that are embedded
in the mass concrete of the structure and on
features of the dam and appurtenances to the
dam. Certain types of instruments are installed
at the rock-concrete interfaces on the
abutments and at the base of the dam for
measuring deformation of the foundation.
Others are installed on the steel liners of
penstocks for measuring deformation from
which stress is determined, and at the outer
surface of the penstocks for measuring
hydrostatic head near the conduit. This type of
instrumentation may also be used with rock
bolts in walls of underground openings such as
a powerplant or tunnel and in reinforcement
steel around penstocks and spillway openings
to measure deformation from which stress is
determined.
The second method involves several types of
precise surveying measurements which are
259](https://image.slidesharecdn.com/gravitydams-230723194435-350300a0/85/GravityDams-pdf-291-320.jpg)
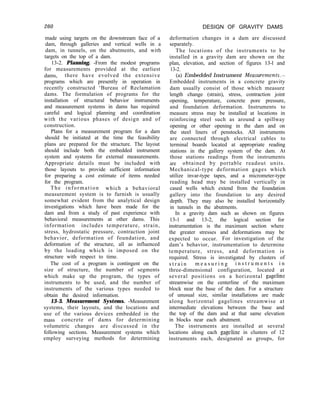
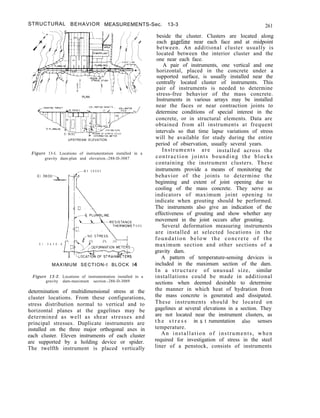
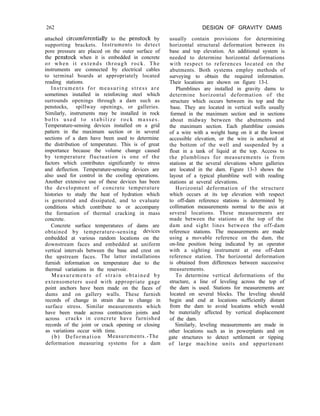
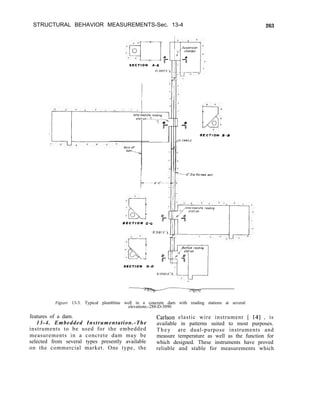
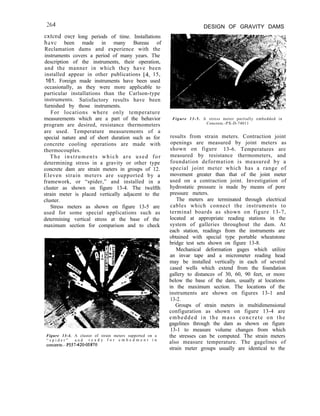
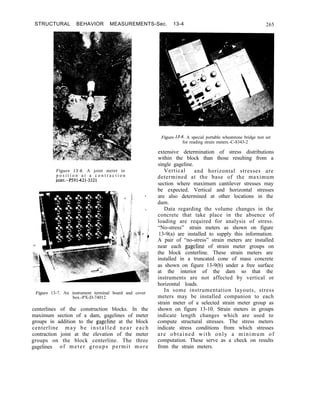
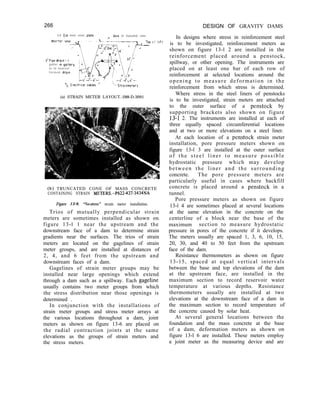
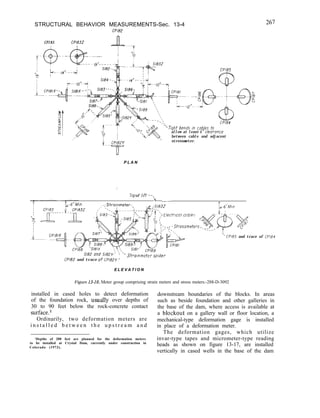
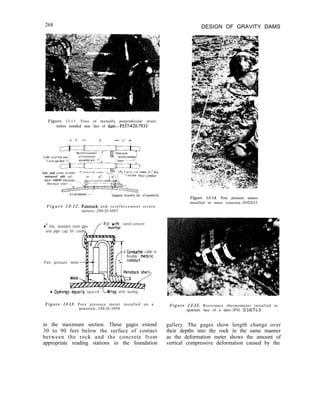
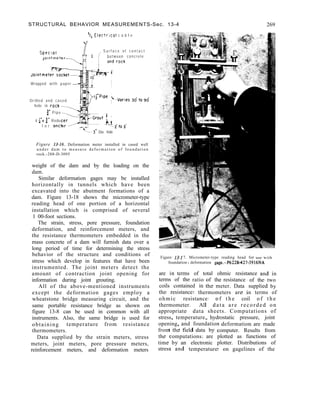
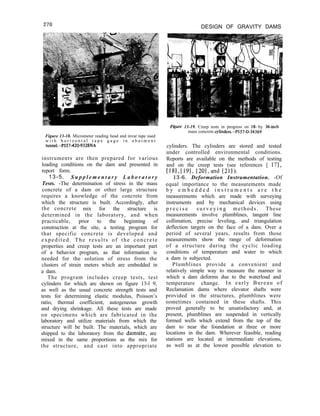
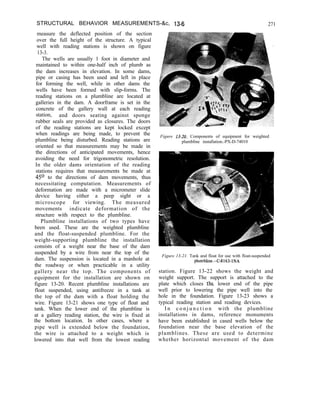
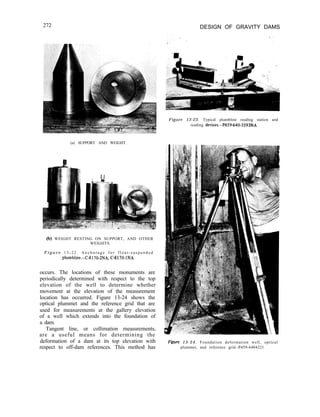
![STRUCTURAL BEHAVIOR MEASUREMENTS-Sec. 13-6 273
been used for measuring the deflection at the
top of some Bureau of Reclamation gravity and
arch dams. It is also used at major structures
and is convenient for measurement at small
dams that have no assigned survey personnel,
since the survey can usually be conducted by
two persons.
Collimation measurements are made with a
theodolite or jig-transit. An instrument pier as
shown on figure 13-25 is constructed on one
reservoir bank on the axis and at a higher
elevation than the dam. A reference target as
shown on figure 13-26 is installed on the
opposite reservoir bank on the axis and at
about the same elevation as the pier. The target
and pier locations are selected so that a sight
line between them will be approximately on
the axis or parallel to it at the location of a
Figure 13-25. An instrument pier for use with collimation
or triangulation systems.-P526400-7877
Figure 13-26. A reference sighting target for use in
obtaining collimation measurements.-P526-400-7852
movable measuring target as shown on figure
13-27 on the top of the dam. Progressive
differences in the position of the movable
target from the sight line indicate the
deformation change in fractions of an inch at
the measurement station. Usually three to four
stations on a dam are sufficient to obtain the
desired information. The results are correlated
with plumbline measurements to provide
sufficient data for charting the deformation
behavior of the structure. A typical layout for
a collimation system and locations of the items
of equipment are shown on figure 13-28.
A more elaborate installation, and one that
requires experienced and trained personnel, is
that of triangulation targets on the face of a
dam from off-dam references. Although the
installation is better suited for an arch dam
than for a gravity dam, a minimal installation is
entirely satisfactory for gravity dam
deformation measurements. The layout of
targets on the face of the dam is made
compatible with the layout of the embedded
instruments. Targets are located on the
gagelines of instruments, and on the locations
of plumbline reading stations projected radially
from the plane of the axis.
This system requires a net of instrument
piers and a baseline downstream from the dam.
The configuration is laid out to provide the
greatest strength of the geometrical figures
[22] and to afford sight lines to each target
from as many instrument piers as is feasible.
The nature of the terrain and the topography](https://image.slidesharecdn.com/gravitydams-230723194435-350300a0/85/GravityDams-pdf-305-320.jpg)
![274 DESIGN OF GRAVITY DAMS
Figure 13-27. A movable collimation target at a measuring
station on top of a dam-PX-D-74009
PLAN
UPSTREAM ELEVATION
Figure 13-28. A collimation system layout for a gravity
dam-288-D-3097
of the area are governing factors in the size of
the net layout. The measurements are made
using first-order equipment, methods, and
procedures insofar as feasible. The results from
these measurements show deformation of a
dam with respect to off-dam references and
deformation of the canyon downstream from a
dam in the streamwise and cross-stream
directions. The layout of a system and
locations of items of equipment are shown on
figure 13-29. Figure 13-25 shows a pier suitable
Figure 13-29. A triangulation system layout for a gravity
dam.-288-D-3099
for theodolite stations. Figure 13-30 shows the
tensioning device used with the tape for precise
baseline measurements, and figure 13-3 1 shows
targets used on the face of a dam and on the
theodolite piers.
Leveling measurements are used to
determine vertical displacements of a structure
with respect to off-dam references. These
measurements employ first-order equipment
and procedures [23]. Base references for the
measurements should be far enough from the
dam to assure that they are unaffected by
vertical displacement caused by the dam and
reservoir.
Combinations of the several precise
surveying-method measurements are included
in the behavior measurement layouts for new
dams. Except for plumbline and deformation
well measurements, all are readily adaptable to
older dams, should monitoring of behavior
become desirable.
13 -7. Other Measurements. -Under this
general category may be included types of
measurements which are related to and have an
i n f l u e n c e o n the structural behavior
measurements, but which are not included as a
part of the program for those measurements.
The measurements of primary interest are
those of air temperature as recorded at an
official weather station, air temperature as may
be recorded at certain locations on a project,](https://image.slidesharecdn.com/gravitydams-230723194435-350300a0/85/GravityDams-pdf-306-320.jpg)
![STRUCTURAL BEHAVIOR MEASUREMENTS-Sec. 13-7 275
Figure 13-30. A tensioning device used with a tape for
precise baseline measurements.-P557-D-58714
Figure 13-31. A pier plate, pier targets, and dam
deformation targets.-P557-D-58717
river water temperature, concrete temperature
during the construction of a dam, reservoir
water elevation, uplift pressure under a dam,
and flow of water from drainage systems. The
latter two items are discussed more fully.
(a) Uplift Pressure Measurements.-A
system of piping is installed in several blocks at
the contact between the foundation rock and
the concrete of a gravity dam as shown on
figure 13-32. The piping is installed to
d e t e r m i n e w h e t h e r a n y h y d r a u l i c
underpressures may be present at the base of
the dam due to percolation or seepage of water
along underlying foundation seams or joint
systems after filling the reservoir. Measured
values of uplift pressure also may indicate the
effectiveness of foundation grouting and of
drainage. The uplift pressure gradient through
the section of a dam used for design is an
assumed variation between the upstream and
downstream faces of a dam as shown in
reference [24] and in section 3-9 of this
manual.
Uplift pressures are determined by pressure
gages or by soundings. When a pipe is under
pressure, the pressure is measured by a
Bourdon-type pressure gage calibrated in feet,
attached through a gage cock to the pipe. When
zero pressure is indicated at a pipe, the water
level in the pipe is determined by sounding.
Another system for measuring uplift
pressure at the base of a structure where no
galleries are included near the foundation into
which a piping system may be routed is to
install pore pressure cells at the locations to be
investigated. Electrical cables may be routed
from the cell locations to appropriate reading
stations on the downstream face or top of the
structure where measurements can be obtained.
The installation of pore pressure cells is
particularly applicable to installations beneath
concrete apron slabs downstream from an
overflow section of a dam, spillway training
walls, and powerhouse structures. A typical
pressure cell installation is shown on figure
13-33. Details on figure 13-34 show the
manner in which contraction joints can be
crossed by electrical instrument cable which is
encased in electrical conduit.
(b) Drainage Flo w Measurements. -A
system of foundation drains is installed during
the construction of a gravity dam. The drainage
system usually consists of 3- or 4-inch-diameter
pipes placed on approximately lo-foot centers
in the axis direction, in the floors of the
foundation gallery and foundation tunnels.
Periodic measurements of flow from the
individual drains should be made and recorded.
When flows from drains are minimal,
measurements may be made using any suitable
container of known volume and noting the
number of containers filled per minute. When
flows are too great to measure by that method,
measuring weirs may be installed as needed in
the drainage gutters of the galleries and adits of
a dam. Weirs should be located as required to
measure flows from specific zones in a dam.](https://image.slidesharecdn.com/gravitydams-230723194435-350300a0/85/GravityDams-pdf-307-320.jpg)
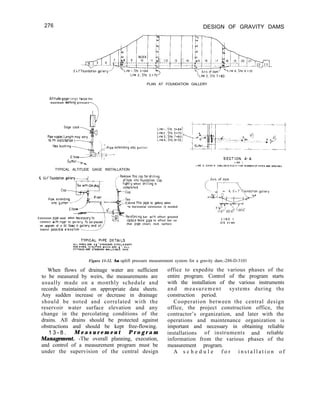
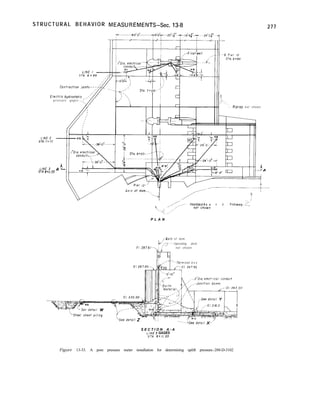
![278 DESIGN OF GRAVITY DAMS
Electric hydrostotrc
pressore gage and
hoid;nq fu'ture-.-.-we.-->
/.-Air vent
;',-i"Dio,eieclricai conduit
,
Electric hydrostatic
pressure gage and holding
fixture.---_
.-A!r vent
-Tee in conduitrun OS req'd
req'd. for grout!"g.
for groutrng
Holding fixture placed
Holdrng fixture placed ,,,'
in concrete sand---
D E T A I L W DETA/L X
1Typ'col nstollot'o" -12" siabl Typtco! ~nstolloiton ~-slobs over 12')
&cure conduit to reinforcement
/' lls necessoiy -~'D~o,holes for O,P Vents
,' L)
TV .~,ock out (pock with burlap1
~"Electrrcol condurt--,
,,-Type "~"rubber waterstop
-. : ,--i'"eiosflc filler
-.._
Tee for grouting- Tee for
-Tee for grouting
groutrng
Plug ends ofconduitoround
(rubber hose attached
'.-Tee for grouting.~, -‘,‘~;a electrlcel conduit
with steel bonds); -...
_I.' cabletopreventgroutfrom
DETA,‘ Z enterrng exponsro" couplrng.
‘-Plug ends ofco"durtarou"d
cable to prevent grout from
entering expansion coupling.
/YETA/L Y
(Typical ]ornt crossrng - 12' sfabsl
(T~~,co; ,oint crossing-slabs over 12'1
F&we 13-34. Details of pore pressure meter installation illustrated on figure 13-33.-288-D-3103
instrumentation and for obtaining readings at a
new dam begins almost with the placement of
the first bucket of concrete, continues through
the construction period, and then extends into
t h e o p e r a t i n g s t a g e , p o s s i b l y f o r a n
undetermined period of time.
The information which is obtained is
forwarded to the design office in the form of a
report prepared at monthly intervals as
explained in reference [25]. It includes all
tabulations of instrument readings obtained
during the prior month and other pertinent
information, such as daily records of air and
water temperature, reservoir and tailwater
elevations when the operating period is
reached, any other data which may have an
effect on the structural action of a dam, and
comments concerning the operation of
i n s t r u m e n t s o r measurement devices.
Photographs and sketches should be used freely
to convey information.
The schedules for obtaining data from
structural behavior installations are somewhat
varied. Embedded instrument readings are
required more frequently immediately after
embedment than at later periods. The reading
frequency is usually weekly or every 10 days
during construction and semimonthly after
construction.
In some cases, instrument readings at
monthly intervals can be allowed, Although the
wider spread of intervals is not desirable for
strain meters, it is satisfactory for stress meters,
reinforcement meters, joint meters, pressure
cells, and thermometers. During periods of
reservoir filling or rapid drawdown, readings at
more frequent intervals are preferred. In this
case, schedules for readings may be accelerated
for the periods of time involved.
Data from deflection measuring devices such
as plumblines and collimation are preferred
weekly. During events of special interest, such
as a rapidly rising or falling reservoir, readings
at closer intervals may be desired.
Data from uplift pressure measurement
systems may be obtained monthly except
during the initial filling of a reservoir when
data are obtained at weekly or lo-day intervals.](https://image.slidesharecdn.com/gravitydams-230723194435-350300a0/85/GravityDams-pdf-310-320.jpg)
![STRUCTURAL BEHAVIOR MEASUREMENTS-Sec. 13-9 279
Pore pressure gages may be read monthly. At
dams where drain flow is of a sufficient
quantity to be measure, these data should be
obtained at monthly intervals.
T h e t a r g e t d e f l e c t i o n a n d p i e r n e t
triangulation measurements should be
conducted at least semiannually during the
periods of minimum and maximum air
temperature so as to obtain the furthest
downstream and upstream deformed positions
of a dam. During the early stages of reservoir
filling and operation, additional measurements
are desirable and are made approximately
midway between those of minimum and
maximum air temperature conditions. These
latter data are useful in noting deformation
trends and for correlating collimation and
plumbline information.
Periodic leveling should be conducted in the
vicinity of and across the top of a dam to
detect possible vertical displacement of the
structure.
The planned program for measurements
should cover a time period which will include a
full reservoir plus two cycles of reservoir
operation, after which a major portion of the
measurements are suspended. After the
suspension of a major portion of readings,
some types of measurements, such as those
from plumblines, collimation, foundation
deformation meters and gages, and from
certain clusters of embedded meters which are
considered essential for long-time structural
surveillance, are continued indefinitely. For
these measurements, the intervals between
successive readings may be lengthened.
13-9. Data Processing. -The installations of
instruments and measurement systems in dams
and the associated gathering of quantities of
data require that a program for processing be
planned in advance. This requires definitely
established schedules and adherence to the
processing plan. Otherwise, seemingly endless
masses of data can accumulate from behavior
instrumentation and become overwhelming
with no apparent end point in sight. Careful
planning with provisions for the execution of
such a program, possibly during a period of
several years, cannot be too strongly
emphasized.
For some measurements, computations and
plots can be made and used to advantage by
construction or operating personnel at a
damsite. Under this category are data from
resistance thermometers, joint meters,
extensometers, Bourdon pressure gages, and
the less complex systems for measuring
deformation, such as collimation and
plumblines. X-Y hand plotting of these data
can be maintained with relative ease, as
required.
F o r m e a s u r e m e n t s f r o m t h e o t h e r
instruments such as strain meters, stress meters,
and reinforcement meters, the obtaining of
results is complex and time consuming.
The methods and details for computing
which are used to reduce the instrument data
to temperature, stress, and deflection are
completely described in separate reports (see
references [6], 181, [26], and [27]). The
results of the Bureau’s laboratory creep test
program, which covers a period of more than
20 years, are described in references [ 51, [ 181,
[28], and [291.
The processing of large masses of raw data is
efficiently and economically handled by
computer methods. The instrument and
deformation data are processed in the Bureau’s
E&R Center in Denver. Processing of the
majority of these data is presently done by
punched cards, magnetic tape, and electronic
computers, using programs of reference [26]
for the computing which have been devised for
the specific purposes. Plotted results are from
output material which is fed into an electronic
X-Y plotter. Reports are prepared from these
results.
13-10. Results. -The interpretation of data
and compiled results includes the careful
examination of the measurements portion of
the program as well as examination of other
influencing effects, such as reservoir operation,
air temperature, precipitation, drain flow and
leakage around a structure, contraction joint
grouting, concrete placement schedule,
seasonal shutdown during construction,
concrete testing data, and periodic instrument
evaluations. All of these effects must be
reviewed and, when applicable, fitted into the
interpretation. The presentation of results,](https://image.slidesharecdn.com/gravitydams-230723194435-350300a0/85/GravityDams-pdf-311-320.jpg)
![280
both tabular and graphical, must be simple,
forceful, and readily understood.
The interpretation of the measurement
results, as shown in references [ 271, [30], and
[ 311 , progresses along with the processing of
the gathered data. Progress reports usually
cover the findings which are noted during the
periods of construction and initial reservoir
filling stages for a dam. The resume of findings,
as a final report, is usually not forthcoming
until several years after completion of the
structure, since the factors of a full reservoir,
its seasonal operating cycle, the seasonal range
of concrete temperature, and local effects of
temperature on concrete are all time-governed.
13-l 1. Bibliography.
[II
VI
[31
]41
[51
[61
[71
181
[91
“Arch Dam Investigation,” vol. I, Engineering Foundation
Committee on Arch Dam Investigation, ASCE, 1927.
“Arch Dam Investigation,” vol. II, Committee on Arch
Dam Investigation, The Engineering Foundation, 1934.
“Arch Dam Investigation,” vol. Ill, Committee on Arch
Dam Investigation, The Engineering Foundation, 1933.
Raphael, J. M., and Carlson, R. H., “Measurement of
Structural Action in Dams,” James J. Gillick and Co.,
Berkeley, Calif., 1956.
McHenry, Douglas, “A New Aspect of Creep in Concrete
and its Application to Design,” Proc. ASTM, vol. 43, pp.
1069-1087, 1943.
Jones, Keith, “Calculations of Stress from Strain in
Concrete,” Engineering Monograph No. 25, Bureau of
Reclamation, October 29,196l.
R a p h a e l , J . M . , “ D e t e r m i n a t i o n o f S t r e s s f r o m
Measurements in Concrete Dams,” Question No. 9,
Report 54, Third Congress on Large Dams, ICOLD,
Stockholm, Sweden, 1948,
Roehm, L. H., and Jones, Keith, “Structural Behavior
Analysis of Monticello Dam for the Period September
1955 to September 1963,” Technical Memorandum No.
622, with Appendixes I and II, Bureau of Reclamation,
September 1964.
Carlson, R. W., “Manual for the Use of Stress Meters,
Strain Meters, and Joint Meters in Mass Concrete,” second
edition, 1958, R. W. Carlson, 55 Maryland Avenue,
Berkeley, Calif.
[lo] Raphael, J. M., “The Development of Stress m Shasta
Dam,“Trans. ASCE, vol. 118, pp. 289-321, 1953.
[ 111 Copen, M. D., and Richardson, J. T., “Comparison of the
Measured and the Computed Behavior of Monticello
(Arch) Dam,” Question No. 29, Report 5, 8th Congress
on Large Dams, ICOLD, Edinburgh, Scotland, 1964.
[12] R i c e , 0 . L . , “In Situ Testing of Foundation and
Abutment Rock on Large Dams,” Question No. 28,
R e p o r t 5 , 8 t h C o n g r e s s o n L a r g e D a m s , ICOLD,
Edinburgh, Scotland, 1964.
[ 131 Rouse, G. C., Richardson, J. T., and Misterek, D. L.,
DESIGN OF GRAVITY DAMS
“Measurement of Rock Deformations in Foundations on
M a s s C o n c r e t e D a m s , ” A S T M S y m p o s i u m ,
Instrumentation and Apparatus for Soil and Rock, 68th
Annual Meeting, Purdue University, 1965.
(141 Technical Bulletin Series, Bulletins 16 through 23,
Terrametrics Division of Earth Sciences, Teledyne Co.,
Golden, Colo., 1972.
[15 ] Technical Record of Design and Construction, “Glen
Canyon Dam and Powerplant,” Bureau of Reclamation,
pp. 117-138 and 449453, and p. 464, December 1970.
[ 161 Technical Record of Design and Construction, “Flaming
Gorge Dam and Powerplant,” Bureau of Reclamation,
1968.
1171 Hickey, K. B., “Effect of Stress Level on Creep and
Creep Recovery of Lean Mass Concrete,” Report
REC-OCE-69-6, Bureau of Reclamation, December 1969.
[18] “A Loading System for Compressive Creep Studies on
Concrete Cylinders,” Concrete Laboratory Report No.
C-1033, Bureau of Reclamation, June 1962.
[ 191 Best, C. H., Pirtz, D., and Polivka, M., “A Loading
System for Creep Studies of Concrete,” ASTM Bulletin
No. 224, pp. 44-47, September 1957.
(201 “A IO-Year Study of Creep Properties of Concrete,”
Concrete Laboratory Report No. SP-38, Bureau of
Reclamation. July 1953.
1211 Hickey, K. B., “Stress Studies of Carlson Stress Meters in
C o n c r e t e . ” Reuort REC-ERC-71-19. Bureau of
Reclamation, Aprii1971.
[22] “Manual of Geodetic Triangulation,” Special Publication
No. 247, Coast and Geodetic Survey, Department of
Commerce, Washington, D.C., 1950.
[23] “Manual of Geodetic Leveling,” Special Publication No.
239, Coast and Geodetic Survey, Department of
Commerce, Washington, D.C., 1948.
[24] Design Criteria for Concrete Gravity and Arch Dams,”
Engineering Monograph No. 19, Bureau of Reclamation,
p. 3, December 1960.
[ 251 Reclamation Instructions, Part 175, Reports of
Construction and Structural Behavior (L-21 Report)
Bureau of Reclamation, 1972.
[26] “Calculations of Deflections Obtained by Plumblines,”
Electronic Computer Description No. C-114, Bureau of
Reclamation, 1961.
[27] Roehm, L. H., “Investigation of Temperature Stresses
and Deflections in Flaming Gorge Dam,” Technical
Memorandum 667, Bureau of Reclamation, 1967.
[28] “Twenty-Year Creep Test Results on Shasta Dam
Concrete.” Laboratorv Report No. C-805A, Bureau of
Reclamation, February 1962.
[29] “Properties of Mass Concrete in Bureau of Reclamation
Dams,” Laboratory Report No. C-1009, Bureau of
Reclamation, December 196 1.
[30] Roehm, L. H., “Deformation Measurements of Flaming
Gorge Dam,” Proc. ASCE, Journal of the Surveying and
Mapping Division, vol. 94, No. SUl, pp. 37-48, January
1968.
(311 Richardson, J. T., “Measured Deformation Behavior of
Glen Canyon Dam,” Proc. A S C E , J o u r n a l o f t h e
Surveying and Mapping Division, vol. 94, No. SU2, pp.
149-168, September 1968.](https://image.slidesharecdn.com/gravitydams-230723194435-350300a0/85/GravityDams-pdf-312-320.jpg)
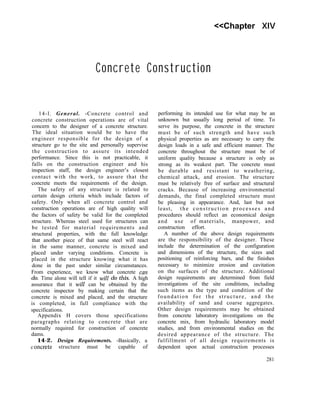
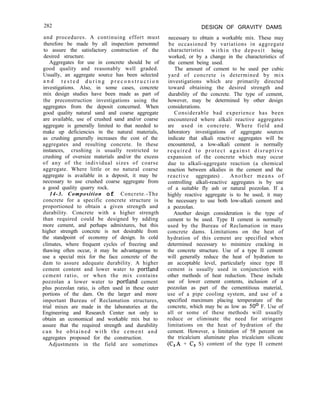


![ECOLOGICAL CONSIDERATIONS-Sec. 15-4
fish kills, and some means such as a holding
pond or contour ditches should be used to
reduce their presence and steps taken to
eventually eliminate them. Substances that can
cloud or darken the water interfere with the
ability of sight-feeding fish to forage, and
should not be allowed to enter the water.
In mining areas where heavy erosion often
occurs, careful consideration must be given to
the effects of siltation which may rapidly
reduce the reservoir capacity. Consideration
must also be given to the acidic character of
the water since it can cause fish kills. Control
dams may be the solution, and in one case the
Bureau of Reclamation has constructed an
off-reservoir dam to reduce the rapid
sedimentation of the main reservoir and to
limit the amount of acidic inflow to an
acceptable level.
The temperature of the water controls
timing of migration, breeding, and hatching
and affects the appetite, growth, rate of
heartbeat, and oxygen requirements of all fish.
Each species of fish has an optimum
temperature range within which it can survive,
and consideration must be given to the
temperature range which will exist both in the
reservoir and in the stream below the dam due
to the resefioir releases. For example, if a low
dam is constructed in a mountainous area, the
cool water entering the shallow reservoir can be
warmed by the sun during the summer months
to an undesirable extent. The warm
temperatures of the shallow water within the
lake and also of the downstream releases could
then prevent the spawning of cold water
species of fish such as trout.
To remedy this problem, care must be taken
to provide sufficiently deep reservoir areas
where cold water will remain, and to use an
outlet works which is capable of selectively
withdrawing the colder water from the lower
reservoir depths. Federal and State fish and
wildlife agencies should be consulted as to the
correct depth for the outlets in a specific area.
Figure 15-l shows the selective withdrawal
outlet works to be used at Pueblo Dam in
Colorado. Figure 15-2 shows a selective
withdrawal outlet works used at Folsom Dam
in California. Movable shutters were placed
289
Trashracks.
seats.ond
qmdes not
shorn
8
P L A N - F I S H H A T C H E R Y O U T L E T W O R K S
....-I
S E C T I O N A - A
Figure 15-I. Selective withdrawal outlet at Pueblo Dam
in Colorado. Water can be withdrawn at any of four
levels.-288-D-3104
upstream from the trashracks. By manipulation
of the shutters water may be drawn from the
desired level. The Bureau of Reclamation has
used selective withdrawal outlet works at
several locations to create favorable
temperatures for fish spawning downstream of
the dam. Further information concerning these
structures is available in references [ 1 I and
[2] .l Another reason for providing adequate
reservoir depth, in addition to creating
favorable conditions for spawning, is to prevent
fish kill in the winter due to extreme cold.
However, shallow reservoir areas are sometimes
required to develop a warm water fishery or for
waterfowl habitats.
Although salmon are commonly thought of
as the only migrators, other species of fish such
‘Numbers in brackets refer to items in the bibliography,
section 15-l 2.](https://image.slidesharecdn.com/gravitydams-230723194435-350300a0/85/GravityDams-pdf-321-320.jpg)
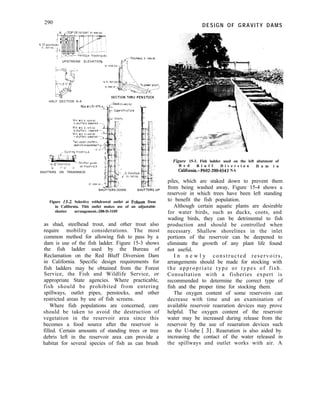
![ECOLOGICAL CONSIDERATIONS-Sec. 15-5 291
Figure 15-4. An aerial view of a small reservoir with trees left at the water’s edge to provide a fish
habitat.-288-D-2869
bibliography of reaeration devices compiled by feeding areas, (2) loss of habitat, and (3)
the Bureau of Reclamation is contained in limitation of mobility. The severity of each of
reference [4] . these effects can be significantly reduced.
In some cases, fish hatcheries can be built in
conjunction with the dam. Figure 15-5 shows
the hatchery below Nimbus Dam in California.
Canals also may provide spawning areas for
fish, although considerable cost and special
equipment may be required. Figure 15-6 shows
an artist’s conception of the “grave1 cleaner”
which will be provided at a salmon spawning
area in the Tehama-Colusa Canal in California.
Special gravel and special gravel sizes were
required in the canal bottom to facilitate
spawning.
15 -5. Environmental Considerations for
Wildlife. -Three common detrimental effects of
reservoirs on wildlife involve: (1) removal of
When reservoirs inundate wildlife feeding
areas, new areas should be planted to lessen the
impact and, if possible, new types of grasses
which are suitable and which provide more
food per unit area should be planted. In
addition, the new feeding areas can sometimes
be irrigated with reservoir water to cause rapid,
heavy growth. If the reservoir water is not
immediately needed for irrigation, the water
level can be left below the normal water
surface to allow sufficient time for the feeding
areas which are to be flooded to be replaced by
areas of new growth.
Where flooding of the homes of a large
number of smaller animals such as muskrat and](https://image.slidesharecdn.com/gravitydams-230723194435-350300a0/85/GravityDams-pdf-323-320.jpg)
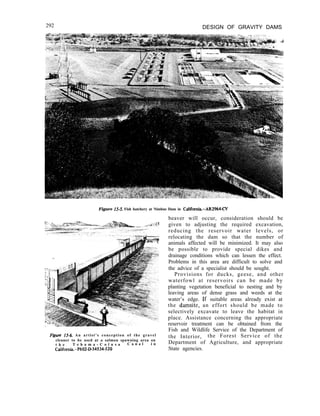
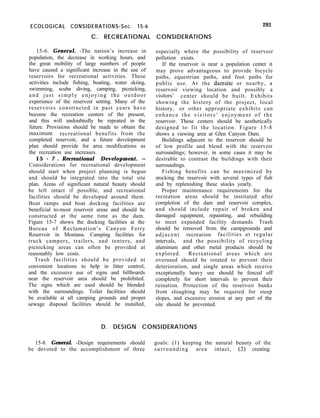
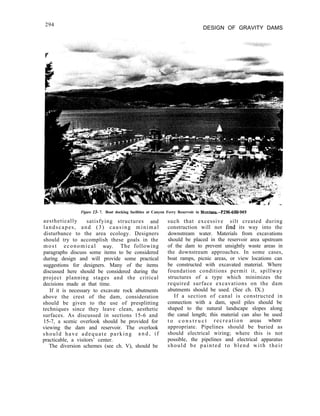
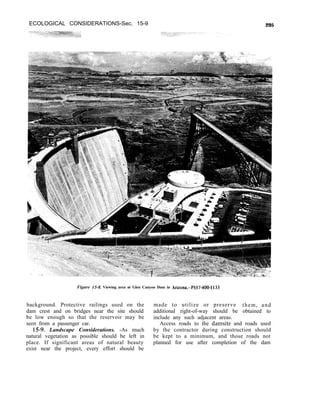
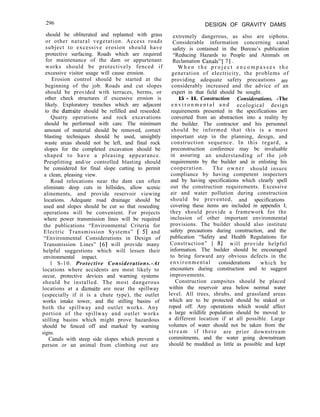
![ECOLOGICAL CONSIDERATIONS-Sec. 15-12 297
pollution free; siltation ponds may be needed
in extreme cases. The builder should be
required to remove or bury all trash and debris
collected during the construction period and to
remove all temporary buildings. Every
opportunity should be taken to use the timber
in the reservoir area for commercial operations.
The burning of trees cleared within the
reservoir area should be prevented if excessive
air pollution will result or if State laws prevent
it. At Pueblo Dam in Colorado, the Bureau
required that all brush and timber smaller than
7 inches in diameter be chipped into mulch and
stockpiled for future use on the reseeded areas.
The chipping operation at Pueblo Dam is
shown in figure 15-9. Slightly larger timber can
be cut into firewood for use at camping and
recreation areas, and still larger timber can be
channeled into some commercial use such as
production of lumber, wallboard, or boxes.
A temporary viewing site for the project,
having signs which show the completed project
and explain its purpose, is helpful in promoting
good community relations.
[II
f21
131
[41
[51
161
[71
Figure 15-9. Chipping operations at Pueblo Dam in
Colorado. All brush and timber smaller than 7 inches
in diameter are chipped and stored for use as a mulch
on reseeded areas.-P382-700-790 NA
E. BIBLIOGRAPHY
15-12. Bibliography.
“Register of Selective Withdrawal Works in United
States,” Task Committee on Outlet Works, Committee on
Hydraulic Structures, Journal of the Hydraulics Division,
ASCE, vol. 96, No. HY9, September 1970, pp.
1841-1872.
Austin, G. H., Gray, D. A., and Swain, D. G., “Multilevel
Outlet Works at Four Existing Reservoirs,” Journal of the
Hydraulics Division, ASCE, vol. 95, No. HY6, November
1970, pp. 1793-1808.
Speece, R. E., and Orosco, R., “Design of U-Tube
Aeration Systems,” Journal of the Sanitary Engineering
Division, ASCE, vol. 96, No. SA3, June 1970, pp.
715-725.
K i n g , D . L . , “ R e a e r a t i o n o f S t r e a m s a n d
Reservoirs-Analysis and Bibliography,” REC-OCE-70-55,
Bureau of Reclamation, December 1970.
U.S. Department of the Interior and U.S. Department of
Agriculture, “Environmental Criteria for Electric
Transmission Systems,” Government Printing Office,
Washington. D.C., 1970.
Brenman, H., and Covington, D. A., “Environmental
Considerations in Design of Transmission Lines,” ASCE
N a t i o n a l M e e t i n g on Transportation Engineering,
Washington, D.C., July 1969.
Latham. H. S.. and Verzuh. J. M.. “Reducing Hazards to
P e o p l e ’ a n d A n i m a l s o n R e c l a m a t i o n C a n a l s , ”
REC-OCE-70-2, Bureau of Reclamation, January 1970.
[8] Bureau of Reclamation, “Safety and Health Regulations
l for Construction,” latest edition.
-> “Environmental Quality-Preservation and
Enhancement.” Reclamation Instructions. Series 350,
Part 376. 1969.
U.S. DepartmentoftheInterior,“Man-AnEndangeredSpecies,”
Government Printing Office, Washington, D.C., 1968.
“River of Life, Water: The Environmental Challenge,”
Government Printing Office, Washington, D.C., 1970.
-, “The Population Challenge-What It Means to
America,” Government Printing Office, Washington, D.C.,
1966.
“The Third Wave,”
Thington, D.C., 1967.
Government Printing Office,
Benson, N. G. (editor), “A Century of Fisheries in North
America,” American Fisheries Society, Washington, D.C.,
1970.
Clawson, M., and Knetsch, J. L., “Economics of Outdoor
Recreation,” The John Hopkins Press, Baltimore, Md.,
1966.
Dasmann, R. E., “Environmental Conservation,” John Wiley &
Sons, Inc., New York, N.Y., 1968.
Dober, R. P., “Environmental Design,” Van Nostrand Reinhold
Co., New York, N.Y., 1969.
“Environmental Quality,” First annual report of the Council
on Environmental Quality, Government Printing Office,
Washington, D.C., August 1970.
*References without numbers are not mentioned in text.](https://image.slidesharecdn.com/gravitydams-230723194435-350300a0/85/GravityDams-pdf-329-320.jpg)

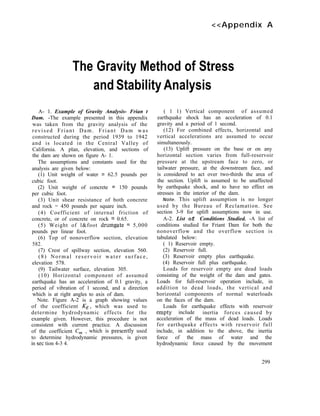
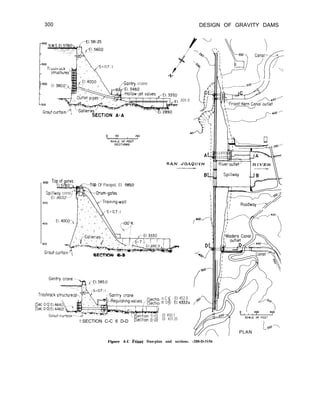
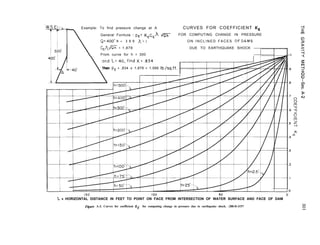
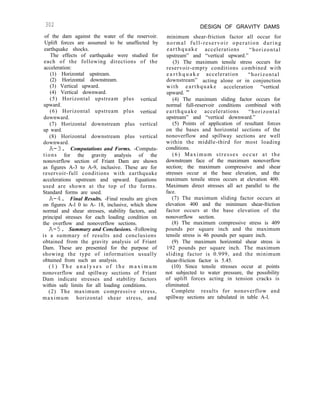
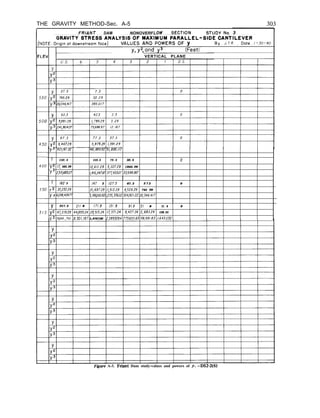

![F.!?IANT.. D A M NONOVERFLOW. S E C T I O N . R E S E R V O I R W . S . EL..5?8 TAILWATER E L . N.QlvE. ., S T U D Y N o . . ? . .
’ 2
GRAVITY STRESS ANALYSIS OF MAXIMUM PARALLEL-SIDE CANTILEVER m
-A
INCLUDING EFFECTS OF TAILWATER AND HORIZONTAL EARTHQUAKE G)
EA R TH WA KE SHEAR STRESS ON HORIZONTAL AND VERTICAL PLANES Tzy =Tyz = a,+ b,y + c,y2 By.. J..!.!?.. ..Dote .?.mr.6rW.
Tzyv=- (9”-P’*PE)tan9, a, = Tzy,= (ozo- p’k’tp: 1 tan QD b, = - [ ~~(“)+q(~~yu’t~(~~yDl] Cl = +Jw)+$~~~y,) t $(T~yo)
z
=I
I I :
I (t Use (t) sign if horizontal earthquake acceleration is upstream.) (ruse t-J siqn if horizontal earthquake acceleration is upstream.)
Q=..
-137 432,33 -/36,314,55 0 3,4/55 9,919 3 /5, ///
w
Figure A-5. Friant Dam study-shear stresses on horizontal and vertical planes. -DS2-2(8) z](https://image.slidesharecdn.com/gravitydams-230723194435-350300a0/85/GravityDams-pdf-337-320.jpg)


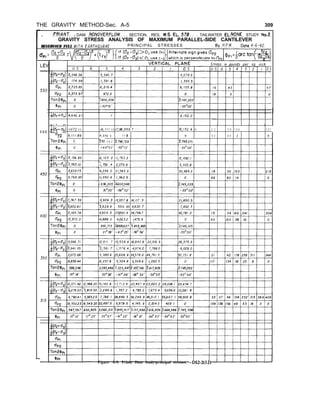
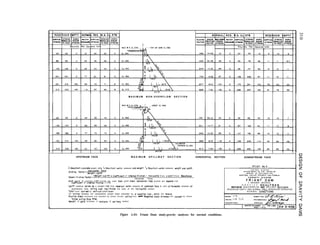
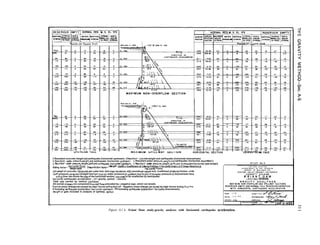
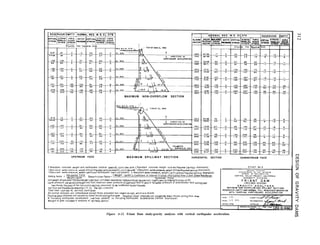
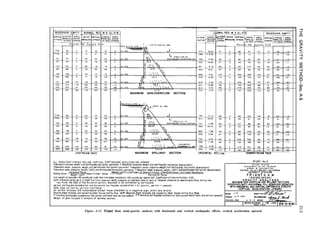
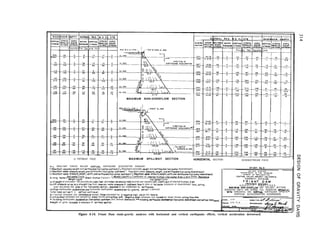
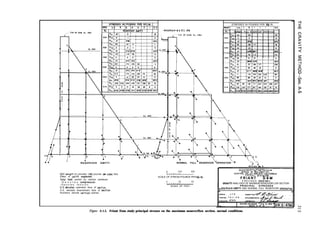
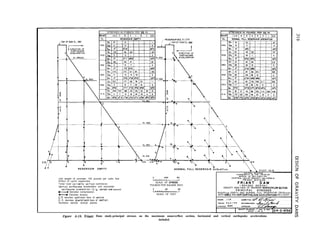
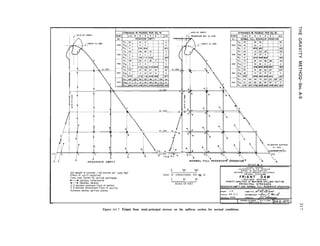
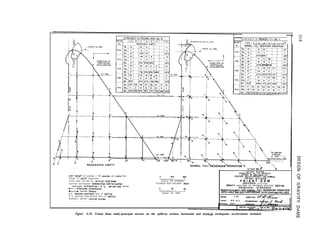


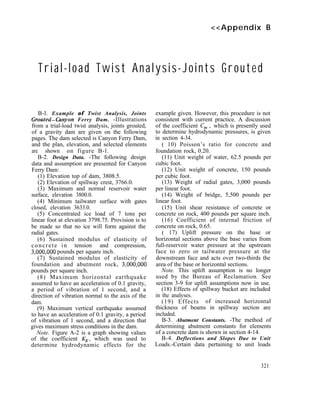
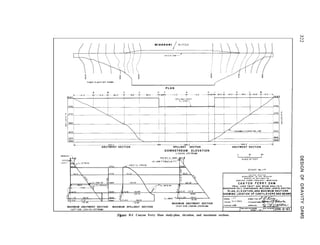
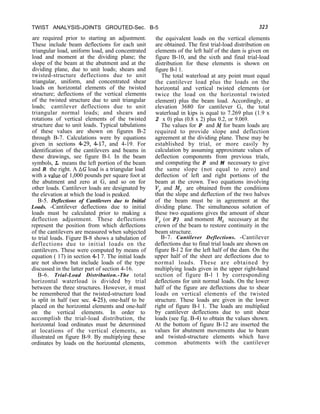
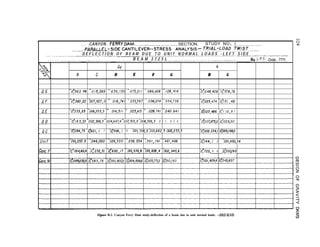
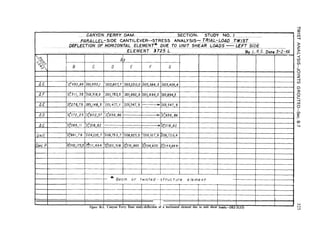
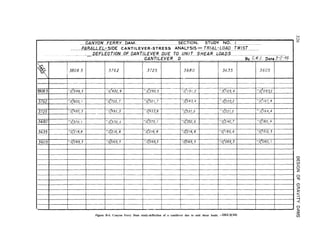
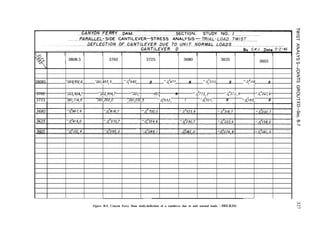
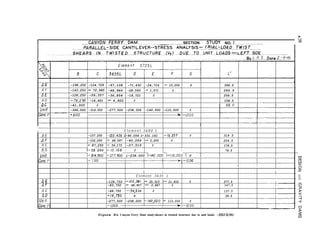
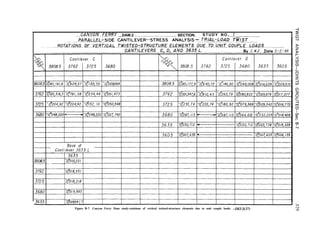
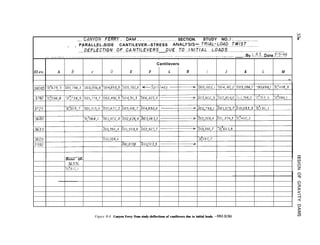
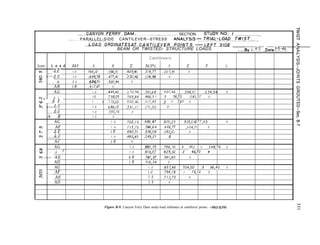
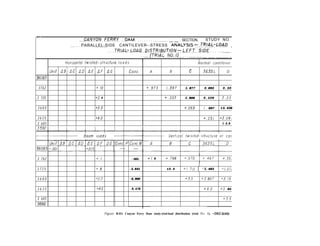

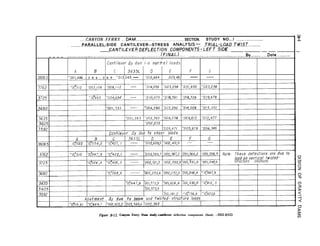
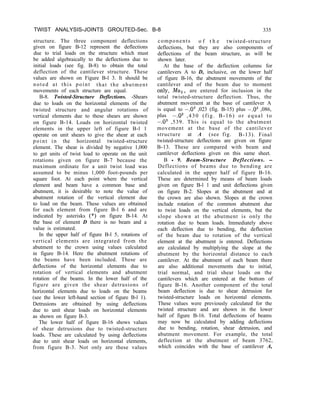
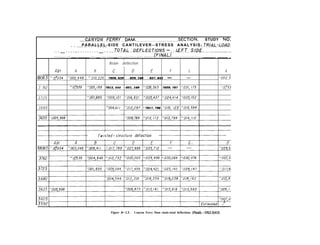
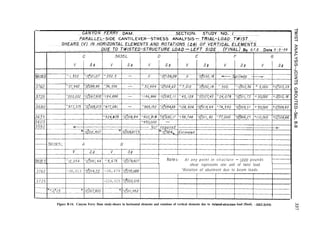

![I- CANYON F E R R Y DAM .__.______.._._...__ .__.__._.___ SECTION. STUDY
. . . NO.../ .._____..____ _ ______. 12
-
I 1 Rotation 1 Beom Ay due to bending and shear
due to Beam Ay due to rotation of abutment caused by twist on vertical elements. 2
twist Abf. 1 A ! B c I D 1 E .F -1 G
,b$$[~ds a?c?-?)i?
_ #OCR. -
G
. !
po851 0 +.O;Or4 ! T032,216 ldO9, 324 IT019,646 17028,161 /TO36,838 1 -
1 - p.op 25 ~~0,~085 1 15
-
#XL 0 bO/, 031 :002,/9 7 :003,285 :004,678 TOO5,/05 :OC'6,669
3762 :0,30/4 TO7034 :003, 061 :009,465 T0/5,508 :020,851 TOP/,747 :021,708 ~0,'008 fo;ol I
4xL 0 '001,642 ~003,173 7005,134 TOO5,735 -007,938 c,
3725 :0:020 TO:183 :003,740 :008,274 TO//,904 TO/2,187
UJXL 0 302, i63 TOO4,934 :005,782
3680 :0:01028 -0;815
- ~003,455 :004,609 TOO4,896
4XL ABT. -,0:744 :002,591 :003,156
3635 1 :O:OlY 1 1:001,655 /DO&756 1!003,943 ~rOO3,850
I I I
I I I I I I ,
Beam dy, also twlsfed-structure ily (shear detrusionl due to twisted-structure loads.
A b f B c D E F G
?yO48 -.0:9Of -.0,'993 ~OOf,OO5 ~001,005 - -
3762 YOTO86 -.0T687 TOO/,363 :001,957 fOO2,417 1002,436 ~002,383
3725 -.0,%87 TOO2,514 :004,149 :005,174 305,267 -005,235
I
3680 I 301,609 x04,292 TOO6,066 ~066,258 7006,301
I I I 1 I I I 1 I I I I I
3635 1 PO/,915 1:002,86/ jPO4,2// 1:004,365 lr004,277 1
_.. _ I
Abufmen? movemeqts o f b e o m d u e ,‘s loads o n o t h e r elpnenfs
1 (37621 1 f37251 1 (3680) 1 (3635) 1
1 :0;74/9 /:001,225 1:002,187 [TQ2,428 1
Abutment movements of twlsted structure due to loads on other elements.
1 TO:430 ~'001,257 /1)02,250 ]ToO2,505 !
Figure B-16. Canyon Ferry Dam study-beam deflection due to beam loads and abutment rotations, and deflection of horizontal elements due
to twisted-structure loads (final).-DS2-2(46)](https://image.slidesharecdn.com/gravitydams-230723194435-350300a0/85/GravityDams-pdf-371-320.jpg)


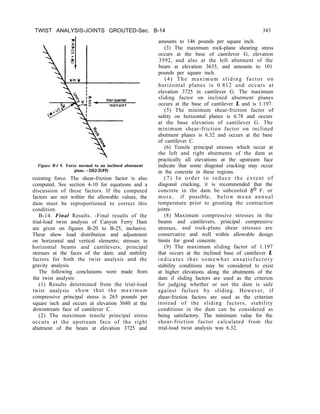
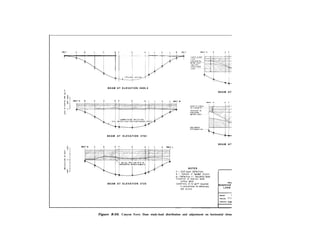
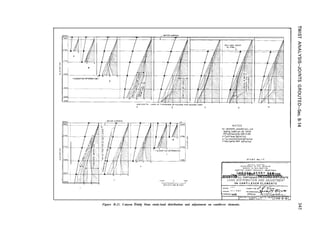
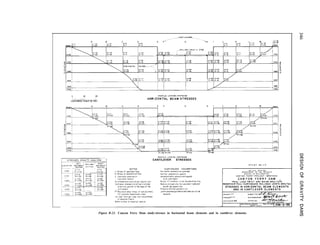
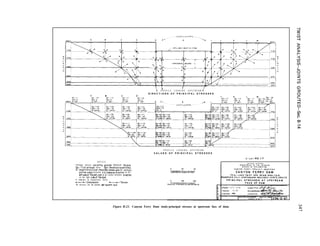
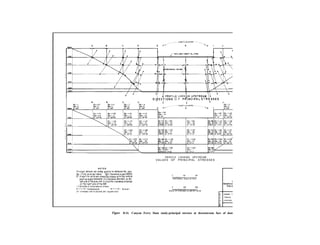
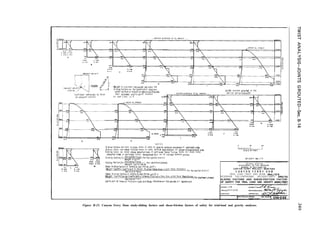

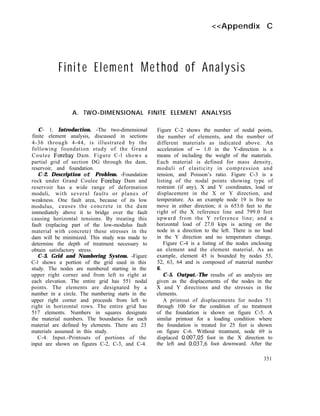
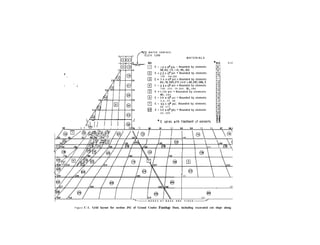


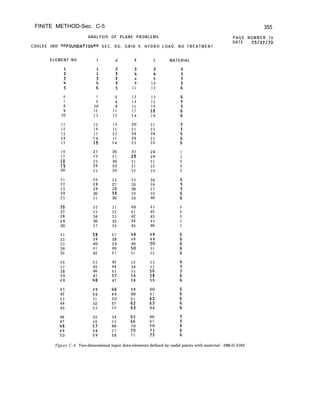


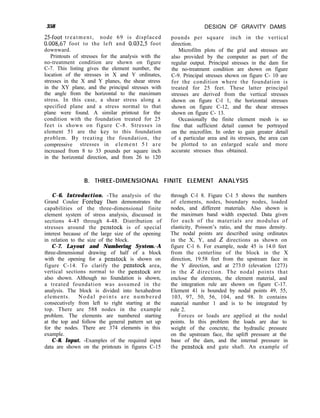
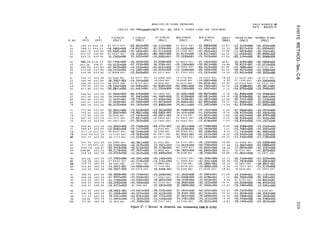
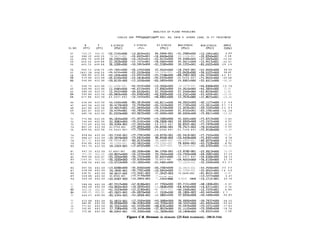
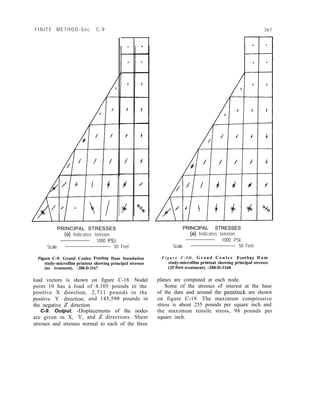
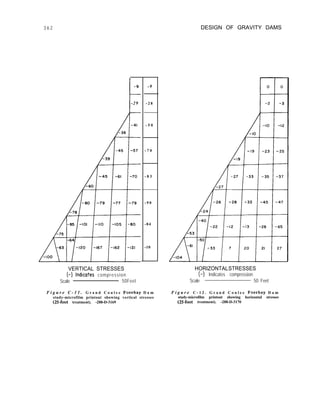

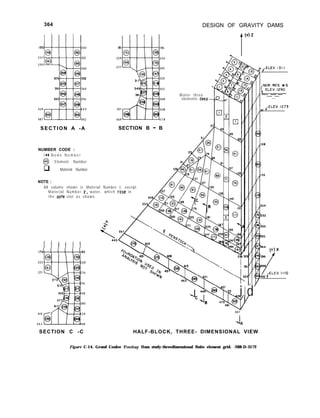


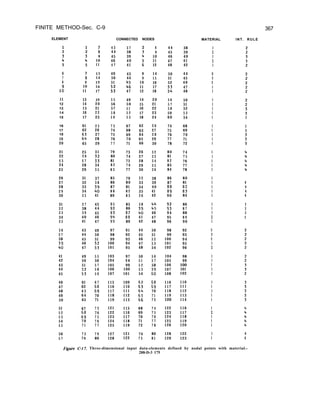
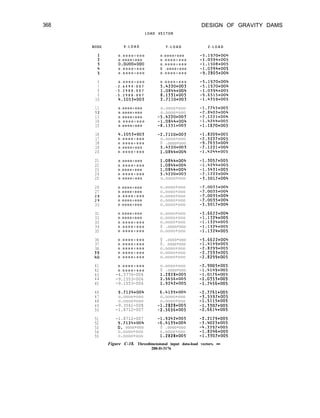
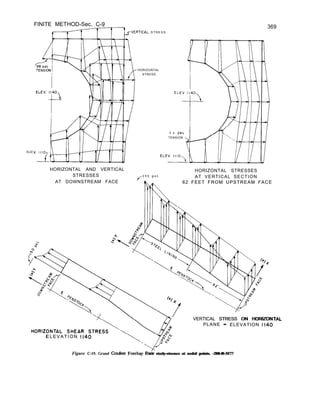

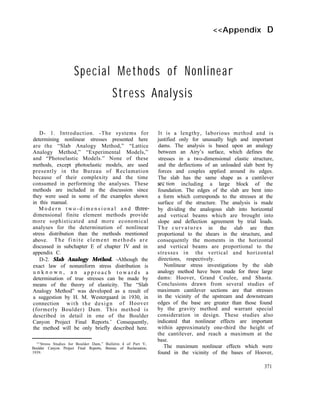
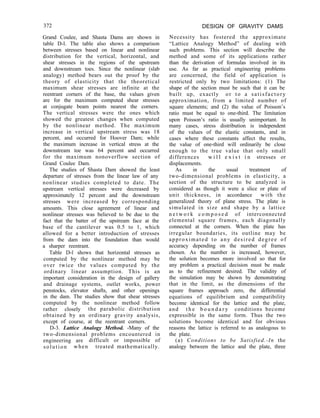

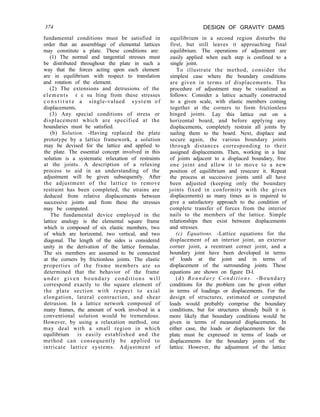
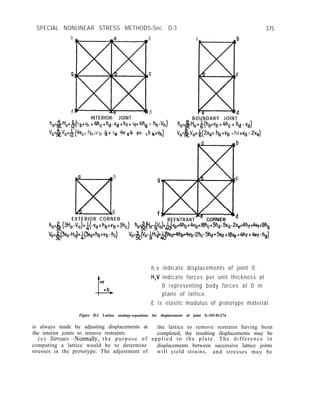
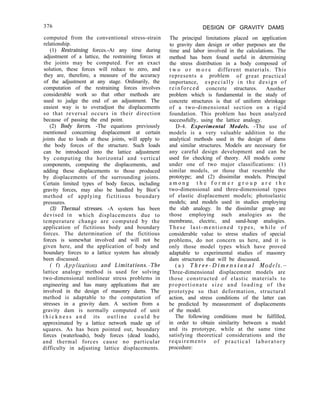
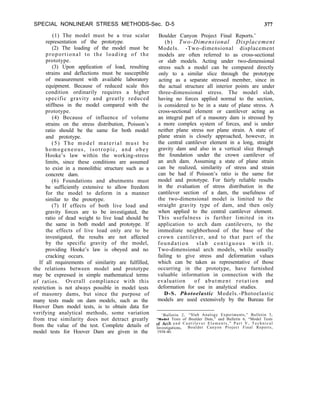
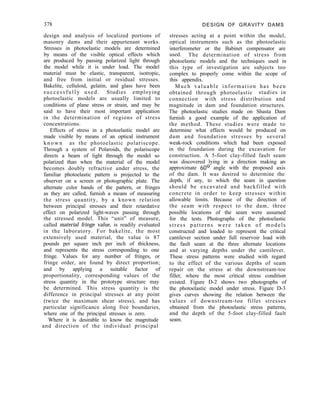
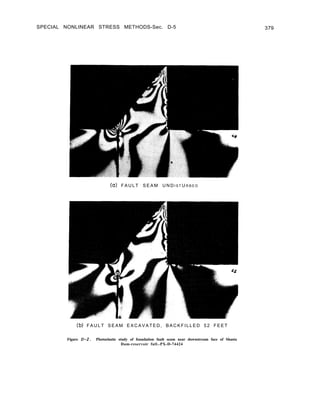
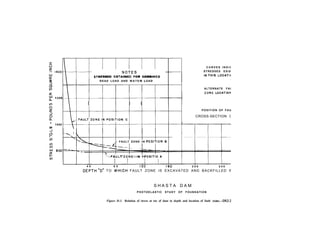
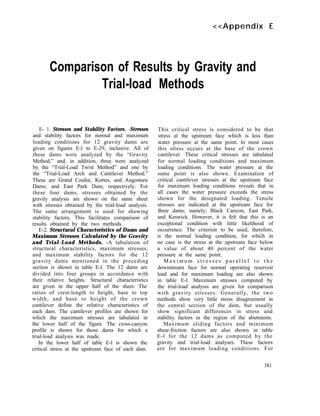
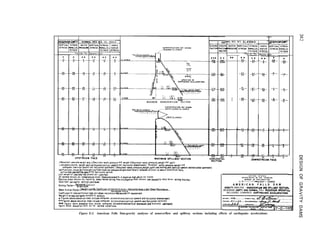
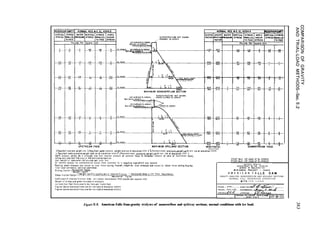
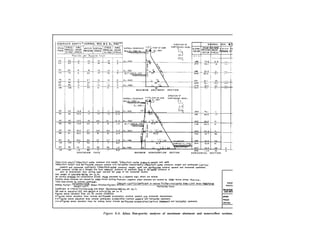
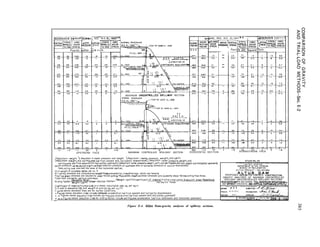
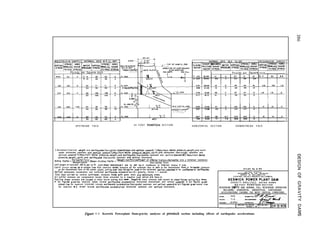
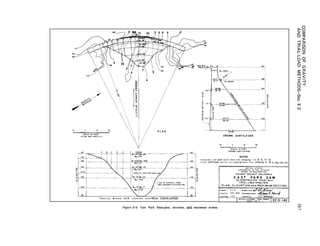
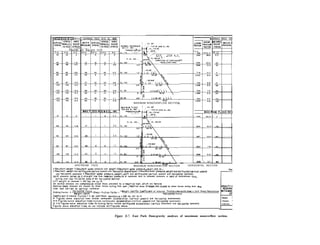
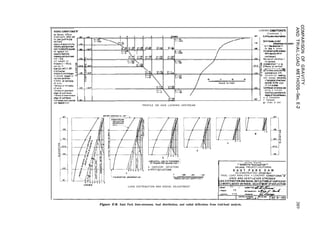
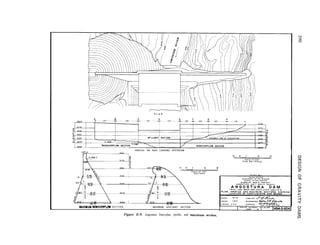
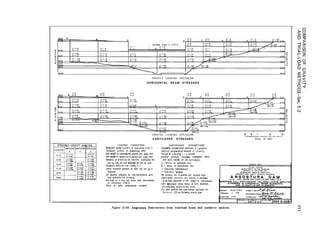
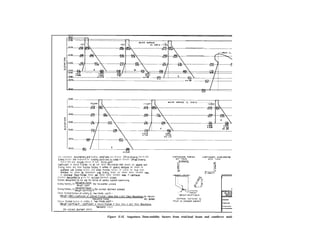
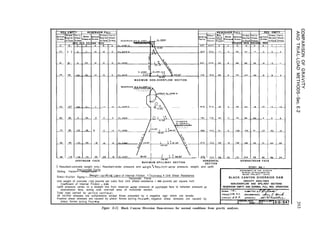
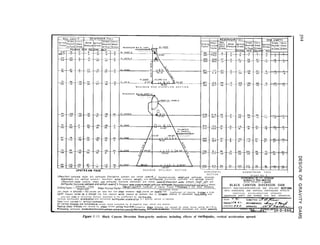
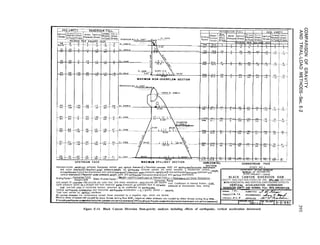
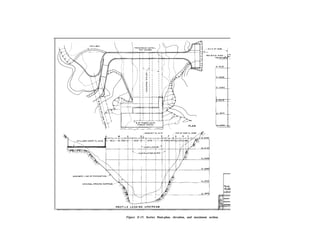
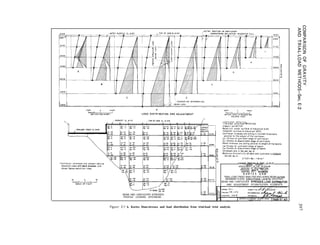
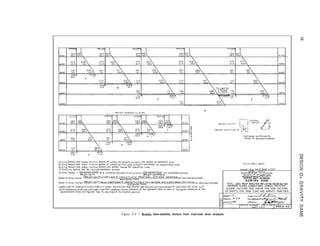
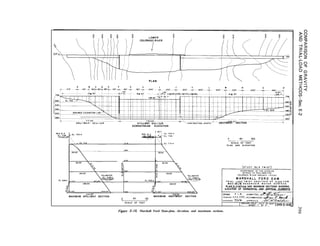

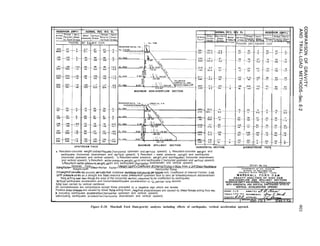
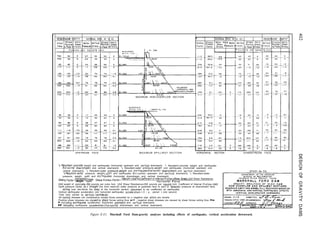
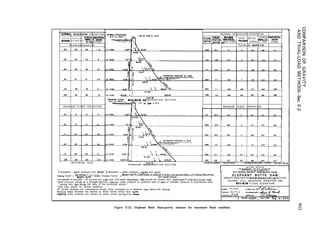
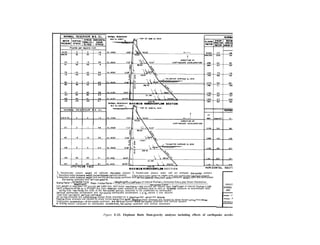
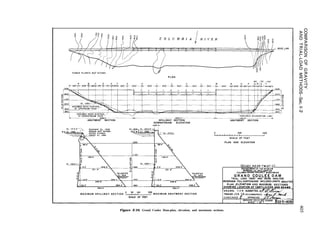
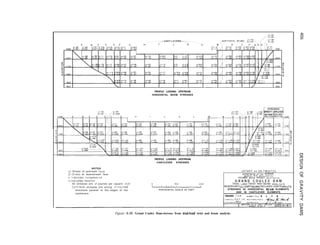
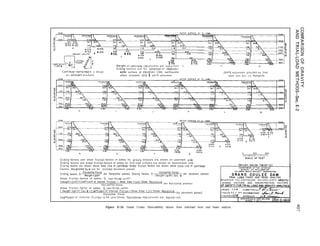
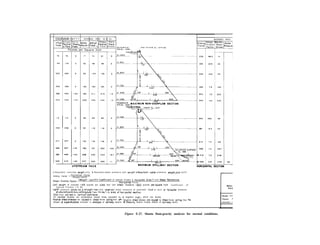
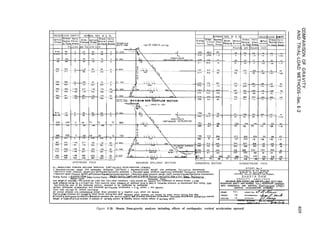
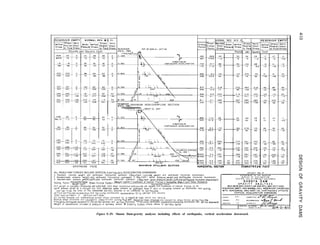

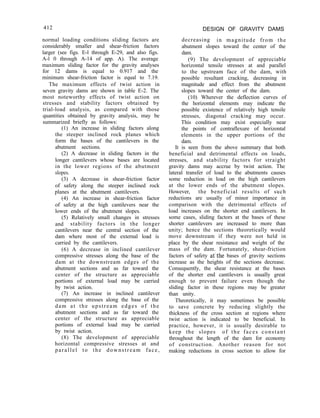
![TABLE E-2.-Maximum effects of twist action in some gravity dams
with principal dimensions of twisted structure. -DS2-2(T3)
G E N E R A L D I M E N S I O N S
G E N E R A L D I M E N S I O N S A N D D A T A
A N D D A T A
I
NAME OF DAM
.t- ‘. r ‘- ,
’ “arshall Ford] Davis
me?;?
.ower-Colo. L o w e r - C o l o .
1 Ariij:jgvodal
8 5 0 4118 3 3 9 0 2 7 0 0 4 0 2
Width a t top o f dam 2 2 I -20 2 7.5 3 0 2 0 3 0 3 2
3 0 8 394 720 216 110
17 I I 0
Remarks:
Designed OS
Grovrty Dam
Radius 700 ft.
Concrete Grovil
Penstock Sectic
Notes:
Figures obove Itne-Joints ungrouted. Figures below line- Joints grouted
D i m e n s i o n s i n f e e t , S t r e s s e s i n p.s.i, Stresses act parallel to face.](https://image.slidesharecdn.com/gravitydams-230723194435-350300a0/85/GravityDams-pdf-445-320.jpg)