Downloaded 11 times
![Tom Zeppenfeldt Ophileon
(:GRAPH) - [:DESCRIBES] -> (:RESULTSCHAIN)](https://image.slidesharecdn.com/rcgraphs-140315113010-phpapp01/85/GRAPH-DESCRIBES-RESULTSCHAIN-1-320.jpg)
![Tom Zeppenfeldt Ophileon
(:GRAPH) - [:DESCRIBES] -> (:RESULTSCHAIN)](https://image.slidesharecdn.com/rcgraphs-140315113010-phpapp01/75/GRAPH-DESCRIBES-RESULTSCHAIN-1-2048.jpg)
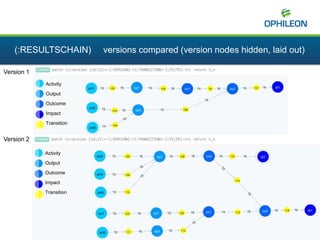
![(:RESULTSCHAIN) with transition nodes
Activity Output Outcome Impact
As a linking point to attach transition indicators for monitoring
As a way to keep historic versions of a results chain
Each transition between steps of the results chain is split up into
(:STEP) – [:TS] -> (:TRANSITION) – [:TE] -> (:STEP)
TS TE TS TE TS TE](https://image.slidesharecdn.com/rcgraphs-140315113010-phpapp01/85/GRAPH-DESCRIBES-RESULTSCHAIN-4-320.jpg)
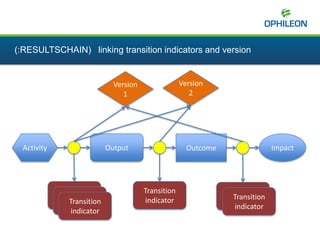
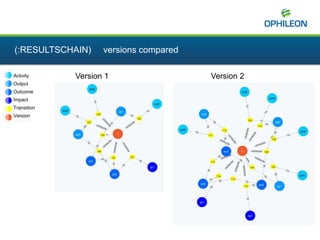

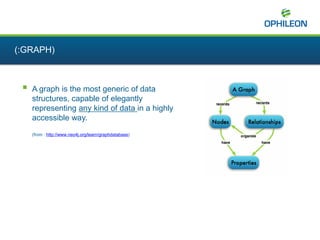
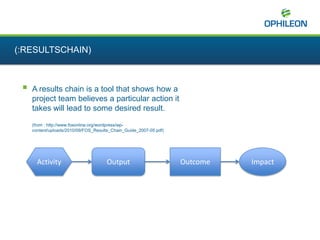
A graph is a data structure that can represent any type of data in a highly accessible way. A results chain shows how a project team believes a particular action will lead to a desired result through a series of steps from activity to output to outcome and impact. Results chains can be enhanced by adding transition nodes between steps to monitor progress and keep versions of the chain that can be compared.


![Getting Started with Apache Spark: Big Data Made Simple [Free Meetup]](https://cdn.slidesharecdn.com/ss_thumbnails/apachesparkgettingstarted-260203175547-8361bcc3-thumbnail.jpg?width=640&height=640&fit=bounds)


