Download to read offline

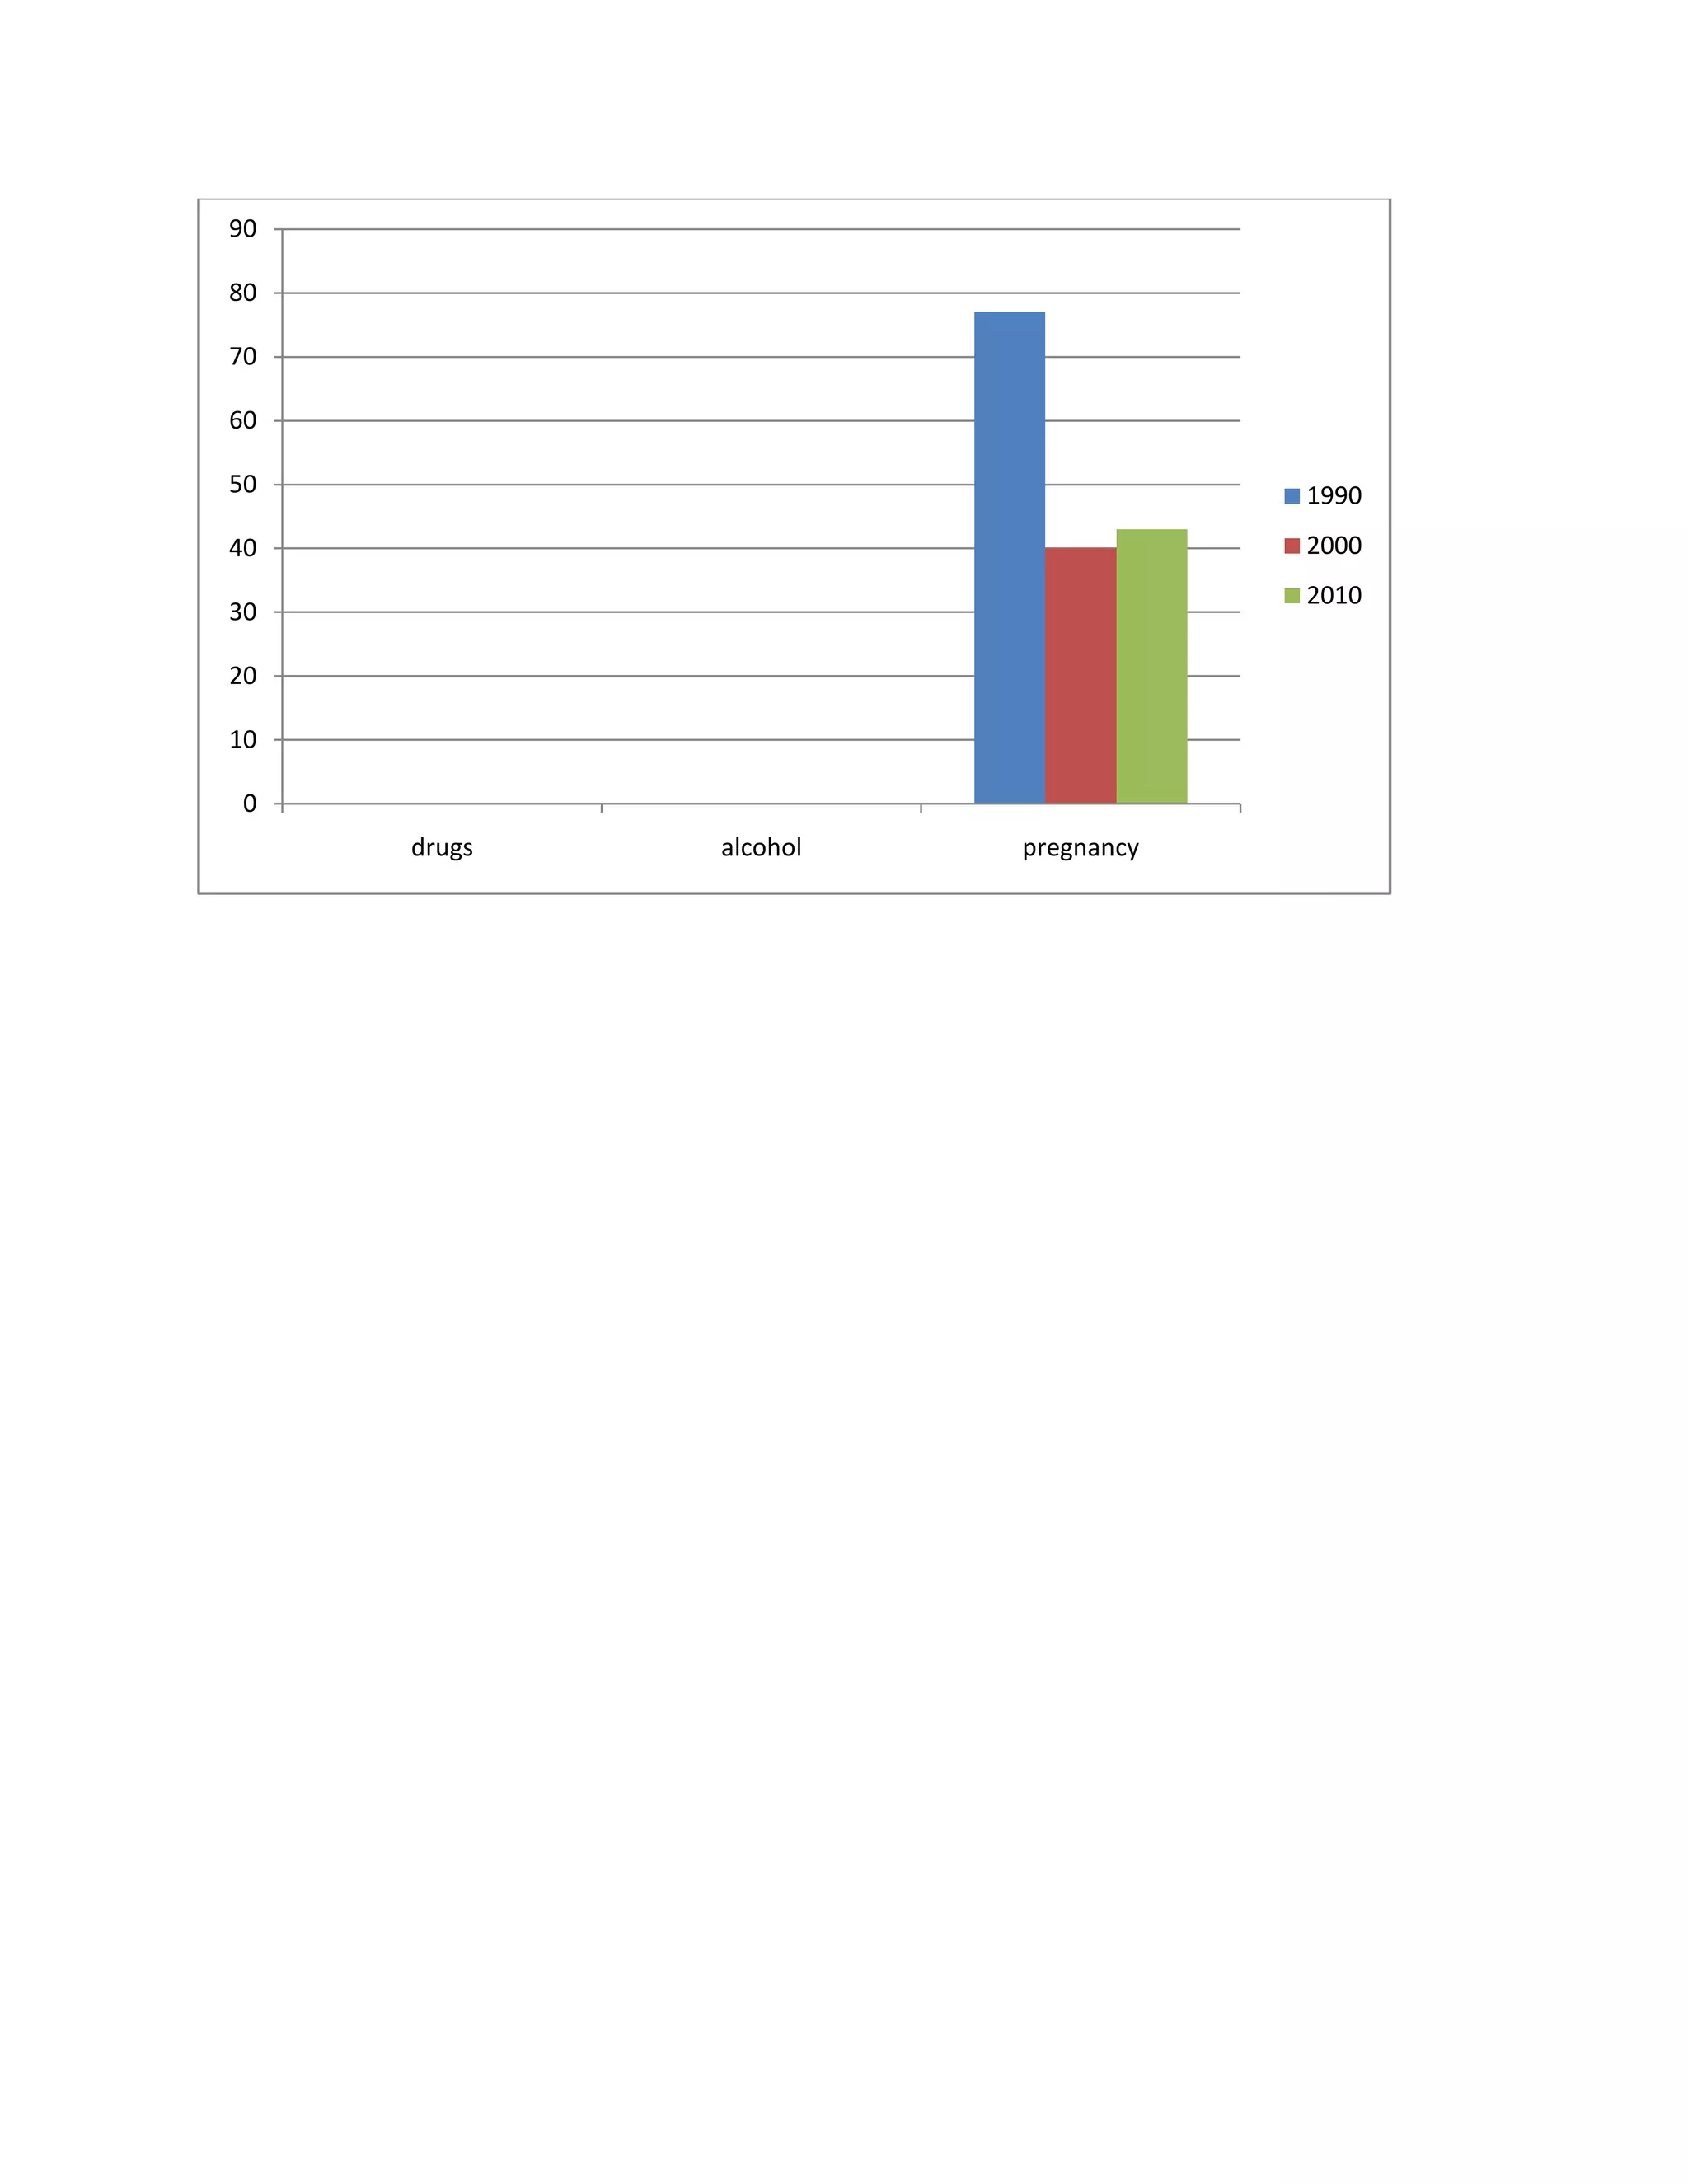
The graph shows three data points for drugs, alcohol, and pregnancy on the y-axis for the years 1990, 2000, and 2010 on the x-axis. The data points for drugs, alcohol, and pregnancy all decreased from 1990 to 2010, with drugs and alcohol decreasing the most and pregnancy decreasing the least.


