Download as PDF, PPTX


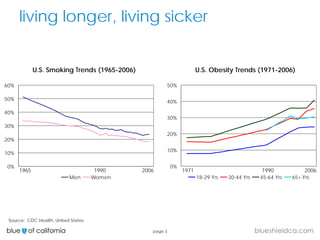


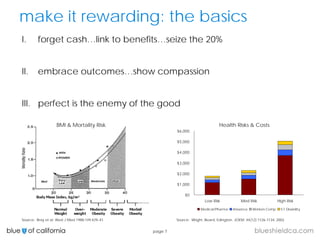
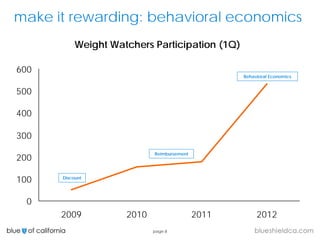


The document discusses strategies for enhancing wellness initiatives, emphasizing the importance of making health programs rewarding, easy, social, and fun. It presents data on U.S. smoking and obesity trends along with the rise of digital health data. Additionally, it touches on the positive impact of social cohesion and behavioral economics on health outcomes and participant engagement.


