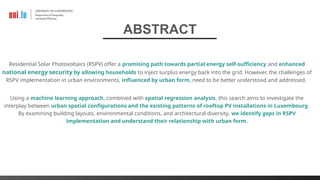
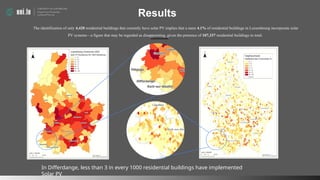
Exploring the Spatial and Built
Environmental Characteristics of
Residential Solar Photovoltaic
Implementations in Luxembourg
10
April
2024
Université du Luxembourg
Maison des Sciences Humaines
11 Portes des sciences
L-4366 Esch-sur-Alzette
Alex Skinner & asst. Prof Catherine Jones
Residential Solar Photovoltaics (RSPV) offer a promising path towards partial energy self-sufficiency and enhanced
national energy security by allowing households to inject surplus energy back into the grid. However, the challenges of
RSPV implementation in urban environments, influenced by urban form, need to be better understood and addressed.
Using a machine learning approach, combined with spatial regression analysis, this search aims to investigate the
interplay between urban spatial configurations and the existing patterns of rooftop PV installations in Luxembourg.
By examining building layouts, environmental conditions, and architectural diversity, we identify gaps in RSPV
implementation and understand their relationship with urban form.
ABSTRACT
Aims & Objectives
Objectives and Research Questions:
What is the spatial distribution of solar PV in Luxembourg?
● Identify the spatial distribution of solar PV installations in Luxembourg, using a
deep learning approach.
● To understand how deep learning techniques be used to accurately identify and
map solar PV installations in Luxembourg.
How does this spatial distribution relate to the pattern’s urban
form and function?
● Examine Luxembourg’s urban environmental characteristics.
● To explore how the built environment of Luxembourg is a driver of solar PV
installation patterns.
● To evaluate what the current spatial distribution says about potential future trends
in solar PV installation.
Opportunities and Barriers
Time &
Money
Acceptance
Urban Form
Market Price
Feasibility
Technology
Worldviews
Education and Awareness
Personal Preference
Table 1: Urban form 1(a) variables at the two different levels
Residential Building Level Neighbourhood Level
Roof Complexity Residential Building Count
Roof Slope Total Building Count
Roof Aspect Total Address Count
Building Compactness Percentage of residential housing
Building Area Population Density
Building Height Neighbourhood Compactness
Building Volume Neighbourhood Building Density
Distance to Road Greenspace
Road Width of Closest Road Urbanity
Space Between Addresses
Openness (space not taken by
buildings)
Residential Building Type (House or
Apartment) Distance from Urban Centres
Table 2: Physical Environment Variables
Variable
Slope
Aspect
Solar Radiance
Solar Duration
Method - Conceptual Model
Hexagon Neighbourhood Grid
●Results aggregated into custom hexagonal neighborhood grid
●Each hexagon: length of 800m along major diagonal
●Emulates 15-minute walkable neighborhood
●Solution to lack of small area neighborhood data for Luxembourg
●Spatial efficiency reduces problems with a-priori-defined
neighborhoods
●Helps mitigate modifiable areal unit problem, orientation, and sampling
biases
Figure.4: Hexagonal Grid Neighbourhood coverage over
Luxembourg consisting of 4631 neighbourhoods. The number of
neighbourhoods was reduced to 2369 when controlling for areas in
which people lived. (Source: Own, 2023)
Figure 5: Voronoi Diagram illustrating compactness over Luxembourg City’s residential housing.
(Source: Own, 2023)
Photo by Yuri Shirota on Unsplash
What is the spatial distribution of residential solar PV in Luxembourg?
• Evaluate state of Solar Energy using Deep Learning processes to classify
orthoimages (Data from 2022 -> resolution of 0.1m)
• Analysis conducted for all of Luxembourg, with 87% accuracy.
• Literature:
• CNN to identify solar PV has been tried and tested with both high and low-
resolution imagery (Kwan, 2012.; Yu et al., 2018)
• Different image sources such as satellite or aerial (Mao et al., 2023).
• recent studies have used orthophotographic imagery with resolutions
between 0.3 and 0.05m for higher precision (de Hoog et al., 2020; Mayer et
al., 2020; Sommer et al., 2018; Yuan et al., 2016)
Method - Convolutional Neural Network (CNN)
Photo by Yuri Shirota on Unsplash
Orthoimagery of Capellen,
Luxembourg, before and after
extract by mask was used to
isolate the buildings that were
the focus of the CNN.
Method - CNN
Results
In Differdange, less than 3 in every 1000 residential buildings have implemented
Solar PV
The identification of only 4,420 residential buildings that currently have solar PV implies that a mere 4.1% of residential buildings in Luxembourg incorporate solar
PV systems—a figure that may be regarded as disappointing, given the presence of 107,337 residential buildings in total.
Results
Spatial Autocorrelation
● Global Moran's I Index: 0.068898 indicating
positive spatial autocorrelation
● High z-score: 9.2, significantly low p-value,
supporting deviation from spatial randomness
● LISA analysis confirms distinct spatial clusters:
high-high and low-low residential PV installations
in Luxembourg
● High-high clusters in central Luxembourg suggest
favorable conditions for implementation
● Low-low clusters in northern rural areas and
inner-city regions indicate adoption barriers
Outcomes of Global Moran’s I Index
on the Neighbourhood Level
Moran's Index 0.068898
Expected Index -0.000423
Variance 0.000057
z-score 9.200134
p-value 0.000000
Results
Spatial Autocorrelation
● Municipal-level clustering deviates significantly
from spatial randomness.
● High-high clusters in central rural/suburban
Luxembourg suggest favorable conditions for
implementation.
● Low-low clusters in northern rural areas and
inner-city regions indicate adoption barriers.
Outcomes of Global Moran’s I Index on
the Municipal Level
Moran's Index 0.233918
Expected Index -0.009901
Variance 0.003194
z-score 4.313967
p-value 0.000016
Highlights from OLS across all models.
●Roof area had high significance. (M1,2,3)
●Volume replaced area as highly significant in M4.
●Distance from road had unexpectedly high significance across
all models.
●Roof slope was deemed important to varying degrees.
(M,1,2,3)
●Population density had no significant effect, but building
density and neighbourhood compactness did.
●No physical environment variables had a significant effect,
even when trialled as a separate model.
●Adjusted R-Squared is low (~6%), but this is understandable
due to known causes such as affluence.
Results
Limitations
● Difficulties in separating urban form and affluence.
● Data on building age and house price invaluable but not accessible at this time.
● Roof variance needs to be examined in more detail, or perhaps with greater numbers of residential
buildings.
● Model accuracy of 87% could be improved, additional testing and training needed to differentiate heat
pumps from RSPV.
Next Steps
● Expand study area to the ‘Grande Region’ - Luxembourg, Wallonia, Lorraine, Saarland, Rheinland for a
more comprehensive model.
● Apply similar CNN model to previous years (2017 - 2022) to explore the temporal distribution and diffusion
of RSPV.
● Urban form influences residential solar photovoltaic (RSPV) implementation patterns.
● Variables like area and distance from the road are significant but likely correlated with affluence,
requiring further investigation.
● Focusing on lower quartiles of these variables as proxies for relative deprivation can offer insights into
disparities in RSPV adoption.
● Understanding the urban form-RSPV adoption relationship aids in tailoring effective strategies and
challenging conventional assumptions.
In summary
● Policymakers can allocate resources more effectively and implement targeted policies, such as
subsidies, to promote adoption in underserved areas.
● Future studies and policies should analyze existing RSPV distribution, identify gaps, and
promote a more equitable and sustainable transition to solar power.
Acknowledgements
This study is funded as part of the SolarZukunft Project.
Thank you to the Institute of Advanced Studies for the
opportunity and Audacity funding.

GISRUK_ASK_RSPV_SolarPanelDistribution.pptx

  • 1.
    Exploring the Spatialand Built Environmental Characteristics of Residential Solar Photovoltaic Implementations in Luxembourg 10 April 2024 Université du Luxembourg Maison des Sciences Humaines 11 Portes des sciences L-4366 Esch-sur-Alzette Alex Skinner & asst. Prof Catherine Jones
  • 2.
    Residential Solar Photovoltaics(RSPV) offer a promising path towards partial energy self-sufficiency and enhanced national energy security by allowing households to inject surplus energy back into the grid. However, the challenges of RSPV implementation in urban environments, influenced by urban form, need to be better understood and addressed. Using a machine learning approach, combined with spatial regression analysis, this search aims to investigate the interplay between urban spatial configurations and the existing patterns of rooftop PV installations in Luxembourg. By examining building layouts, environmental conditions, and architectural diversity, we identify gaps in RSPV implementation and understand their relationship with urban form. ABSTRACT
  • 3.
    Aims & Objectives Objectivesand Research Questions: What is the spatial distribution of solar PV in Luxembourg? ● Identify the spatial distribution of solar PV installations in Luxembourg, using a deep learning approach. ● To understand how deep learning techniques be used to accurately identify and map solar PV installations in Luxembourg. How does this spatial distribution relate to the pattern’s urban form and function? ● Examine Luxembourg’s urban environmental characteristics. ● To explore how the built environment of Luxembourg is a driver of solar PV installation patterns. ● To evaluate what the current spatial distribution says about potential future trends in solar PV installation.
  • 4.
    Opportunities and Barriers Time& Money Acceptance Urban Form Market Price Feasibility Technology Worldviews Education and Awareness Personal Preference
  • 5.
    Table 1: Urbanform 1(a) variables at the two different levels Residential Building Level Neighbourhood Level Roof Complexity Residential Building Count Roof Slope Total Building Count Roof Aspect Total Address Count Building Compactness Percentage of residential housing Building Area Population Density Building Height Neighbourhood Compactness Building Volume Neighbourhood Building Density Distance to Road Greenspace Road Width of Closest Road Urbanity Space Between Addresses Openness (space not taken by buildings) Residential Building Type (House or Apartment) Distance from Urban Centres Table 2: Physical Environment Variables Variable Slope Aspect Solar Radiance Solar Duration Method - Conceptual Model
  • 6.
    Hexagon Neighbourhood Grid ●Resultsaggregated into custom hexagonal neighborhood grid ●Each hexagon: length of 800m along major diagonal ●Emulates 15-minute walkable neighborhood ●Solution to lack of small area neighborhood data for Luxembourg ●Spatial efficiency reduces problems with a-priori-defined neighborhoods ●Helps mitigate modifiable areal unit problem, orientation, and sampling biases Figure.4: Hexagonal Grid Neighbourhood coverage over Luxembourg consisting of 4631 neighbourhoods. The number of neighbourhoods was reduced to 2369 when controlling for areas in which people lived. (Source: Own, 2023) Figure 5: Voronoi Diagram illustrating compactness over Luxembourg City’s residential housing. (Source: Own, 2023)
  • 7.
    Photo by YuriShirota on Unsplash What is the spatial distribution of residential solar PV in Luxembourg? • Evaluate state of Solar Energy using Deep Learning processes to classify orthoimages (Data from 2022 -> resolution of 0.1m) • Analysis conducted for all of Luxembourg, with 87% accuracy. • Literature: • CNN to identify solar PV has been tried and tested with both high and low- resolution imagery (Kwan, 2012.; Yu et al., 2018) • Different image sources such as satellite or aerial (Mao et al., 2023). • recent studies have used orthophotographic imagery with resolutions between 0.3 and 0.05m for higher precision (de Hoog et al., 2020; Mayer et al., 2020; Sommer et al., 2018; Yuan et al., 2016) Method - Convolutional Neural Network (CNN)
  • 8.
    Photo by YuriShirota on Unsplash Orthoimagery of Capellen, Luxembourg, before and after extract by mask was used to isolate the buildings that were the focus of the CNN. Method - CNN
  • 9.
    Results In Differdange, lessthan 3 in every 1000 residential buildings have implemented Solar PV The identification of only 4,420 residential buildings that currently have solar PV implies that a mere 4.1% of residential buildings in Luxembourg incorporate solar PV systems—a figure that may be regarded as disappointing, given the presence of 107,337 residential buildings in total.
  • 10.
    Results Spatial Autocorrelation ● GlobalMoran's I Index: 0.068898 indicating positive spatial autocorrelation ● High z-score: 9.2, significantly low p-value, supporting deviation from spatial randomness ● LISA analysis confirms distinct spatial clusters: high-high and low-low residential PV installations in Luxembourg ● High-high clusters in central Luxembourg suggest favorable conditions for implementation ● Low-low clusters in northern rural areas and inner-city regions indicate adoption barriers Outcomes of Global Moran’s I Index on the Neighbourhood Level Moran's Index 0.068898 Expected Index -0.000423 Variance 0.000057 z-score 9.200134 p-value 0.000000
  • 11.
    Results Spatial Autocorrelation ● Municipal-levelclustering deviates significantly from spatial randomness. ● High-high clusters in central rural/suburban Luxembourg suggest favorable conditions for implementation. ● Low-low clusters in northern rural areas and inner-city regions indicate adoption barriers. Outcomes of Global Moran’s I Index on the Municipal Level Moran's Index 0.233918 Expected Index -0.009901 Variance 0.003194 z-score 4.313967 p-value 0.000016
  • 12.
    Highlights from OLSacross all models. ●Roof area had high significance. (M1,2,3) ●Volume replaced area as highly significant in M4. ●Distance from road had unexpectedly high significance across all models. ●Roof slope was deemed important to varying degrees. (M,1,2,3) ●Population density had no significant effect, but building density and neighbourhood compactness did. ●No physical environment variables had a significant effect, even when trialled as a separate model. ●Adjusted R-Squared is low (~6%), but this is understandable due to known causes such as affluence. Results
  • 13.
    Limitations ● Difficulties inseparating urban form and affluence. ● Data on building age and house price invaluable but not accessible at this time. ● Roof variance needs to be examined in more detail, or perhaps with greater numbers of residential buildings. ● Model accuracy of 87% could be improved, additional testing and training needed to differentiate heat pumps from RSPV. Next Steps ● Expand study area to the ‘Grande Region’ - Luxembourg, Wallonia, Lorraine, Saarland, Rheinland for a more comprehensive model. ● Apply similar CNN model to previous years (2017 - 2022) to explore the temporal distribution and diffusion of RSPV.
  • 14.
    ● Urban forminfluences residential solar photovoltaic (RSPV) implementation patterns. ● Variables like area and distance from the road are significant but likely correlated with affluence, requiring further investigation. ● Focusing on lower quartiles of these variables as proxies for relative deprivation can offer insights into disparities in RSPV adoption. ● Understanding the urban form-RSPV adoption relationship aids in tailoring effective strategies and challenging conventional assumptions. In summary ● Policymakers can allocate resources more effectively and implement targeted policies, such as subsidies, to promote adoption in underserved areas. ● Future studies and policies should analyze existing RSPV distribution, identify gaps, and promote a more equitable and sustainable transition to solar power.
  • 15.
    Acknowledgements This study isfunded as part of the SolarZukunft Project. Thank you to the Institute of Advanced Studies for the opportunity and Audacity funding.

Editor's Notes

  • #2 NOT FOR SHOWING IN THE CONFERENCE JUST FOR STIMULATING MY IMAGINATION!
  • #3 We chose to focus on the soalr transitaion because (exsting debates with respect to wind ) …. focussing primarily on solar as this is one of the transitsions that is more "accessible to local populations from the perspective of descision-making" and we have observed a rise in interest in solar (commerical for example) … 
  • #5 National / international surveys widely support Renewable Energy Projects but we know from investigations that conflicts and genuine concerns are raised during local project implementation Here it is important that we make a clear distinction between "affordable housing", housing that is affordable to the middle classes, affordable rental housing and social (rental) housing.  So whilst there are various known and unknown socioeconomic factos ...Hidden biases, cultural norms and social behaviours, world views,