1. The document describes steps to create agro-climatic zones of Tanzania using GIS by analyzing temperature, rainfall, and evapotranspiration data.
2. Key steps include converting vector data to raster, calculating moisture availability, classifying temperature and moisture zones, and combining the zones to produce the final agro-climatic map.
3. Models are created in GIS software to automate the process and allow easy reproduction of the analysis.
This document provides steps to transfer operational data from an ECS system to Excel for analysis and visualization. Key steps include:
1) Using the ECS interface to select parameters and timeframe for trend data capture.
2) Copying the trend data to the clipboard and pasting into an Excel sheet.
3) Formatting the pasted data into separate columns for analysis and plotting.
4) Creating scatter plots of variables over time and interpreting relationships.
Oracle Warehouse Management Labs provides documentation on how to perform cycle counts using a mobile application in Oracle Warehouse Management. It covers the required setups including defining ABC compiles and classes, assigning items to ABC groups, and defining the cycle count. It then explains how to manually schedule cycle counts, perform a full cycle count, and enter counts using the mobile GUI application. It also provides details on counting plain, lot-controlled, and serial-controlled items mobility as well as useful SQL queries and running LPN diagnostics.
This document provides step-by-step instructions for modeling methane combustion using ANSYS CFX. It begins by importing a mesh file and defining boundary conditions including inlet velocities and species concentrations. Reaction kinetics are then specified by defining the combustion reaction and associated rate parameters. Finally, a high temperature boundary condition is applied to the mesh surface to ignite the combustion process. The tutorial aims to provide guidelines for initial combustion simulations while noting that input values may need refinement for accuracy.
This document discusses using Visual Basic for Applications (VBA) macros in Excel. It explains that VBA macros allow users to add functionality to Excel by creating small programs in the form of functions or subroutines. Functions can be used like other Excel functions, while subroutines perform procedures without returning values. The document provides examples of a function to convert Celsius to Fahrenheit and a subroutine to write a sine wave function to a range of cells. It also outlines some basic programming concepts in VBA like flow control and running macros.
This document provides instructions for using macros in AutoCAD to summarize earthwork areas between two lines. The macros find the intersection points between lines, calculate cut and fill areas, and export the area data to a quantity table and Excel spreadsheet. The macros automate repetitive cross-section analysis tasks, allowing an engineer to quickly process multiple sections within a single AutoCAD drawing.
This document provides instructions for analyzing spreadsheet data in GeoGebra by copying data from another application into GeoGebra's spreadsheet view, selecting one variable analysis to generate a histogram of the data, and optionally generating additional plots like a boxplot or second histogram by right clicking or using GeoGebra's math calculators interface. Outlier data like an age of 138 is identified for potential removal to clean up the data.
This document describes a computer based modelling project to simulate temperature distribution across a plate. The author developed a MATLAB script and graphical user interface (GUI) to allow users to input parameters and visualize the iterative temperature corrections. Key aspects included designing the GUI, implementing a method to correct temperatures using matrix operations based on Laplace's equation, and addressing challenges in modelling a central conducting hole. The completed project allows flexible adjustment of simulation variables and outputs clear graphs of the temperature distribution.
ENGR 102B Microsoft Excel Proficiency LevelsPlease have your in.docxYASHU40
ENGR 102B: Microsoft Excel Proficiency Levels
Please have your instructor or TA initial each level as you complete it. If you need additional help, ask the TAs or use the help guide within Excel.
Once you master Excel Levels I through IV, you can note Excel as a skill on your resume!
Please see D2L Content for this week for your Excel Homework assignment (individual), which is due via D2L Dropbox by the due date specified in the D2L News for your section.
If you use a Mac, please be sure to submit your homework in a format that the grader and instructor can open on a PC.
Level I: Basic Functions Initials _______
1. Calculating an Average: Calculate the arithmetic average of the 5 values listed below. Enter the values in cells A2 through A6. Place a descriptive label in cell A1.
3.6, 3.8, 3.5, 3.7, 3.6
First, calculate the average the long way, by summing the values and dividing by 5:
You will enter the following formula into a blank cell to accomplish this:
=(A2+A3+A4+A5+A6)/5
Second, calculate the average using Excel’s AVERAGE( ) function by entering the following formula in a cell:
=AVERAGE(cellrange)
Replace the “cellrange” with the actual addresses in your spreadsheet of the range of cells holding the five values (i.e., for this problem, the cell range is A2:A6).
2. Determining Velocities (in kph): Some friends at the University of Calgary are coming south for spring break. Help them avoid a speeding ticket by completing a velocity conversion worksheet that calculates the conversion from mph to kph in increments of 10 from 10 to 100. A conversion factor you will need is 0.62 miles/km; you will need this factor to convert from miles/hour to km/hour. Place the conversion factor in its own cell and then reference it in your conversion calculations using absolute cell referencing (e.g., $C$2). Refer to the CBT video on Absolute and Relative Cell Referencing from the “Preparation for the Excel Workshop” assignment if you don’t remember how to do this.
Level II: Advanced Functions Initials _______
1. Projectile Motion I: (See following page for Fig. 1 Excel chart) A projectile is launched at the angle 35o from the horizontal with a velocity equal to 30 m/s. Neglecting air resistance and assuming a horizontal surface, determine how far away from the launch site the projectile will land.
To answer this problem, you will need:
1. Excel’s trigonometry functions to handle the 35o angle, and
2. Equations relating distance to velocity and acceleration
When velocity is constant, as in the horizontal motion of our particle (since we’re neglecting air resistance), the distance traveled is simply the initial horizontal velocity times the time of flight:
(Equation 1)
What keeps the projectile from flying forever is gravity. Since the gravitational acceleration is constant, the vertical distance traveled becomes
(Equation 2)
Because the projectile ends up back on the ground, the final value of y is zero (a hor ...
This workshop involves a thermal-stress analysis of intersecting pipes using ABAQUS. A quarter symmetry model is created and meshed. A thermal analysis is performed to determine the temperature distribution. This is followed by two static stress analyses - the first applies an internal pressure, and the second uses the temperatures from the thermal analysis as loading. A restart analysis is then used to illustrate ABAQUS' restart capability. Finally, an explicit dynamics analysis is performed to simulate the fully coupled thermal-stress response.
Chapter 8Exercise1.Design an application that accept.docxtiffanyd4
Chapter 8
Exercise
1.
Design an application that accepts 10 numbers and displays them in descending order.
4. The village of Ringwood conducted a census and created records that contain household data, including income. Ringwood has exactly 75 households. Write a program into which a village statistician can enter each of the 75 household income values, and determine the mean and median house-hold income.
13. Your student disk contains fi les named DEBUG08- 01. txt, DEBUG08- 02. txt, and DEBUG08- 03. txt. Each fi le starts with some comments that describe the problem. Comments are lines that begin with two slashes (//). Following the comments, each fi le contains pseudocode that has one or more bugs you must fi nd and correct.
08-01
// This application reads 10 numbers
// and sorts them, and displays the three highest numbers
start
Declarations
num SIZE = 10
num number
num numbers[SIZE]
num count
getReady()
while count < SIZE
detailLoop()
endwhile
finish()
stop
getReady()
output "Enter a number "
input number
return
detailLoop()
numbers[SIZE] = number
count = count + 1
output "Enter a number "
input number
return
finish()
sort()
output "The highest three are ", numbers[0], numbers[0], numbers[0]
return
sort()
num x = 0
num y = 0
num COMPS = count - 1
while y < COMPS
x = 0
while x < COMPS
if numbers[x] < numbers[x + 1] then
swap()
endif
x = x + 1
endwhile
y = y + 1
endwhile
return
swap()
num temp
temp = numbers[x + 1]
numbers[x + 1] = numbers[x]
numbers[x] = temp
return
08-02
// This application reads student typing test data
// including number of errors on the test, and the number
// of words typed per minute. Grades are assigned based
// on the following table:
//
Errors
// Speed
0
1
2 or more
// 0–30
C
D
F
// 31–50
C
C
F
// 51–80
B
C
D
// 81–100
A
B
C
// 101 and up
A
A
B
start
Declarations
num MAX_ERRORS = 2
num errors
num wordsPerMinute
num grades[5][3] = {"C", "D", "F"},
{"C", "C", "F"},
{"B", "C", "D"},
{"A", "B", "C"},
{"A", "A", "B"}
num LIMITS = 5
num speedLimits[LIMITS] = 0, 31, 51, 81, 101
num row
output "Enter number of errors on the test "
input errors
if errors = MAX_ERRORS then
errors > MAX_ERRORS
endif
output "Enter the speed in words per minute "
input wordsPerMinute
while row < LIMITS AND wordsPerMinute >= speedLimits[row]
row = row + 1
endwhile
row = row - 1
output "Your grade is ", grades[errors][row]
stop
08-03
This application reads sales data for an automobile dealership.
// Up to 100 sale amounts can be entered. The entered sale amounts
// are sorted so the median sale can be displayed.
start
Declarations
num SIZE = 100
num QUIT = 99999
num saleAmount
num sales[SIZE]
num count = 0
num middlePosition
num x
num y
num temp
num comps
getReady()
while saleAmount count < SIZE
detailLoop()
endwhile
finish()
stop
getReady()
output "Enter sale amount "
input saleAmount
return
detailLoop()
sales[x] = saleAmount
co.
This document provides instructions for a GIS exercise involving spatial analysis of elevation and precipitation data. The goals are to calculate average watershed elevation and precipitation for subwatersheds of the San Marcos River basin. Slope, aspect, flow direction and hydrologic slope will first be calculated from a sample digital elevation model to demonstrate spatial analysis tools in ArcGIS. A ModelBuilder model is then created to automate these calculations. Finally, the model is applied to real elevation data for the San Marcos basin watersheds to calculate average elevation and interpolate precipitation from station data to estimate watershed precipitation volumes and runoff ratios.
Training materials developed with peers at Columbia University for Google, Inc. These materials illustrate methods to incorporate JavaScript into Google Earth Engine to generate relevant products for stakeholders using climate data.
The document provides instructions for two programming assignments:
1. Create a Cylinder class with radius and height variables, a constructor to initialize them, and a volume() method. Also create a CylinderTest class with a main() method that declares a Cylinder array, prompts the user for cylinder properties, and displays the calculated volumes.
2. Create a Date class with month, day, and year variables and a nextDay() method to increment the date. Also create a DateTest class with a main() method that prompts the user for a start date, creates a Date object, and loops 40 times calling nextDay() and displaying the result to test date wrapping.
The document provides an overview of Arc Map and describes how to open and use the Arc Toolbox. It discusses the different components of the Arc Map application window including the table of contents, view window, menu bar, and toolbar. It then explains that Arc Toolbox contains geoprocessing tools for creating and analyzing geographic datasets. It provides screenshots and descriptions of the Arc Toolbox window and tools. Finally, it provides step-by-step instructions for starting ArcMap, opening an existing map document, and saving and closing the document.
This document provides instructions for using ANSYS to analyze a plate structure with pinned connections. It describes 20 steps to: 1) import the CAD model, define materials and mesh the midplane surfaces; 2) apply multi-point constraints (MPCs) at pinned connections and a beam element between plates; 3) apply boundary conditions and a pressure load; and 4) solve and inspect results including stresses and reactions at supports. The goal is to demonstrate using MPCs to model pinned joints in a finite element analysis.
This document describes NetCDF Extractor V2.1, which allows users to create contour and heat map graphs from NetCDF data in addition to extracting data. It provides step-by-step instructions for using the tool to extract data, generate 2D graphs by selecting variables and domains, and customize graph settings like colors, text size and styles. Key features include generating contour plots with labeled lines and heat maps with customizable color ranges.
This document provides an overview of creating a Windows Forms application in C#. Key points include:
- A Windows Forms app contains Program.cs, which runs the form, and Form1.cs, which defines the form.
- Controls can be added to the form visually or through code and have properties like text and events like click handlers.
- Common tasks like input, output, and problem solving are similar to console apps but use Windows forms techniques instead of console output.
- Several exercises demonstrate creating GUIs and handling events and input/output for a Windows Forms application.
INTRODUCTION The goal of this programming project is to entble studen.pdfameancal
This document describes a Python program that allows users to input personal expense names and amounts into lists, and then display the expense data in different formats (table, pie chart, bar chart). It provides instructions for writing functions to input the name and amount data, display an expense report, and a main function to call the other functions and display a menu. Sample user interactions are given to demonstrate normal and no-data flows through the program. Program style requirements include adding comments and prohibiting certain code structures.
Events allow methods in one class to trigger methods in another class without instantiating the other class. To set up an event handler:
1. Create an event in a class.
2. Create a triggering method that raises the event.
3. Create an event handler method for the event in the same or another class.
4. Register the event handler method.
The triggering method calls the event, which executes the event handler method. Examples demonstrate setting up event handlers within the same class and across classes.
This document provides instructions for setting up and running a real-time PCR experiment using a Stratagene Mx3000P instrument and analyzing the results. It describes creating a PCR protocol template, loading the reaction mix into the instrument, running the PCR experiment, and analyzing the amplification plots to determine threshold cycle (Ct) values and export the data to Excel.
IRJET- Temperature Conditioning for Solar DryerIRJET Journal
This document describes the design of a temperature controlled solar dryer. It begins with an introduction that explains the problems with traditional sun drying methods and how a solar dryer aims to improve the drying process. It then provides details on the methodology, including the use of a microcontroller to automatically control and maintain the temperature based on sensors. Diagrams of the system design and block diagrams of the circuit are included. The drying chamber consists of multiple trays and the microcontroller is programmed with different temperature ranges for different seasons and products. When drying is complete, an alarm will sound to notify the user. In summary, this document outlines the design of an automated solar dryer that uses a microcontroller to precisely control temperature during drying based on
This chapter discusses using procedures and exception handling in programs. It covers creating a splash screen, pausing it, adding a combobox, handling events, coding sub and function procedures, passing arguments, creating class variables, and using try-catch blocks to handle exceptions. Procedures should perform single tasks, substantial processing, and sub and function procedures should be used appropriately to break a larger program into manageable parts.
This document discusses meters in IBM Maximo Asset Management. It defines meters as a way to collect metering data for assets and locations. There are three types of meters: continuous, gauge, and characteristic. Meters can be used to trigger preventive maintenance and condition monitoring work orders. The document provides details on creating and configuring meters, entering meter readings, and using meters for maintenance planning and work order generation.
This tutorial introduces how to model a gas absorption process in HYSYS using a packed column where CO2 is absorbed from a gas stream into propylene carbonate. The key steps are: 1) defining the components, streams, and packed column, 2) specifying stream compositions and flow rates, 3) running the simulation, 4) changing from trays to packed section, 5) obtaining the column diameter, height, and exit gas CO2 concentration. Increasing the solvent flow rate decreases the exit CO2 concentration without significantly changing column size.
This tutorial describes a hybrid approach for classifying ground points from airborne laser scanning (ALS) data. The method combines progressive triangulated irregular network (TIN) densification and point cloud segmentation. First, outliers are removed from the imported ALS point cloud. Then, segmentation is used to group points. Ground points are classified using TIN densification. Finally, a high resolution digital terrain model (DTM) is generated from the ground points and smoothed.
This document describes how to perform maximum likelihood classification on Landsat imagery to identify wetlands using ENVI 4.7. It discusses:
1. Loading and calibrating pre- and post-Hurricane Katrina Landsat datasets for a region in Louisiana.
2. Creating regions of interest (ROIs) through polygon selection on image data and scatter plot methods to identify water and land pixels for classification training.
3. Performing atmospheric correction using dark subtraction and QUAC methods.
4. Running maximum likelihood classification using the ROIs as training data to produce classifications identifying water and land, and evaluating the results.
1. The document provides instructions to create a personal geodatabase in ArcCatalog to store GIS data.
2. It describes how to create feature datasets and feature classes to organize different types of geographic features.
3. Steps are outlined to register a topographic map by adding control points and rectifying the map, then digitizing features from the map into the newly created feature classes.
This tutorial teaches how to execute tools in ModelBuilder. It provides steps to create a model that buffers proposed roads and clips vegetation data to identify vegetation types near the roads. The steps include: 1) adding Buffer and Clip tools to the model; 2) filling in tool parameters by connecting input and output data; 3) running the model to execute the tools; and 4) saving the model in a toolbox for future use. Additional analysis is demonstrated by adding a Summary Statistics tool to calculate affected area by vegetation type within the buffers.
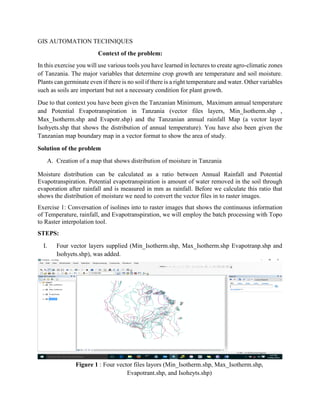
1. GIS AUTOMATION TECHNIQUES
Context of the problem:
In this exercise you will use various tools you have learned in lectures to create agro-climatic zones
of Tanzania. The major variables that determine crop growth are temperature and soil moisture.
Plants can germinate even if there is no soil if there is a right temperature and water. Other variables
such as soils are important but not a necessary condition for plant growth.
Due to that context you have been given the Tanzanian Minimum, Maximum annual temperature
and Potential Evapotranspiration in Tanzania (vector files layers, Min_Isotherm.shp ,
Max_Isotherm.shp and Evapotr.shp) and the Tanzanian annual rainfall Map (a vector layer
Isohyets.shp that shows the distribution of annual temperature). You have also been given the
Tanzanian map boundary map in a vector format to show the area of study.
Solution of the problem
A. Creation of a map that shows distribution of moisture in Tanzania
Moisture distribution can be calculated as a ratio between Annual Rainfall and Potential
Evapotranspiration. Potential evapotranspiration is amount of water removed in the soil through
evaporation after rainfall and is measured in mm as rainfall. Before we calculate this ratio that
shows the distribution of moisture we need to convert the vector files in to raster images.
Exercise 1: Conversation of isolines into to raster images that shows the continuous information
of Temperature, rainfall, and Evapotranspiration, we will employ the batch processing with Topo
to Raster interpolation tool.
STEPS:
I. Four vector layers supplied (Min_Isotherm.shp, Max_Isotherm.shp Evapotranp.shp and
Isohyets.shp), was added.
Figure 1 : Four vector files layors (Min_Isotherm.shp, Max_Isotherm.shp,
Evapotrant.shp, and Isoheyts.shp)
2. II. By opening the attribute table of each layer identification of the field that contains data can
be done (the temperature fields are given in the Fahrenheit units and the rainfall and
evapotranspiration in mm). The data value fields will be used to create the raster layers)
III. To convert vector to raster, Spatial Analyst tool>> Interpolation>> then Right Click Top
to Raster and Select Batch. Batch widow was opened and add Min_Isotherm.shp,
Max_Isotherm.shp, Evapotranp.shp and Isohyets.shp
Figure 2: Batch processing window
IV. Validating the data button before Clicking OK to run the batch processing. Check Values
also generates output dataset names. The Check Values button validates the entire batch
grid's content. Check Values also generates output dataset names.
V. After the batch is completed running four files will be produced and displayed as below:
3. ann_rain 1
min_temp
max_temp evs_temp
Figure 3: Raster display of four output layers ann_rain for isohytes Min_Temp for
Min_Isotherm.shp output, Max_temp for Max_Isotherm output and Evp_Trans for
Evapotransp.shp output
5. Exercise 2: Creating the moisture distribution map as ration of Rainfall and
Evapotranspiration.
This operation was done by simple Math and Divide Tool when the Rainfall is divided by
evapotranspiration, the process that is known as image rationing. But also can be run using the
image calculator. We will use the image calculator although the equation is not complicated.
STEPS:
I. Open Arc Map >> Click a toolbox >> spatial analyst >> Map Algebra >> Raster calculator,
Raster Calculator was opened:
II. Following formula was entered “Ann_Rain” / “Evp_Trans” implying annual rainfall
divide by potential evapotrasipitation, the output file Moist_Av i.e., moisture availability
was assigned.
III. Click OK. Raster Calculator run and the Moisture availability raster file (Moist_Av)
produced. As per below display
Figure 5: Moisture Availability
6. Exercise 3: Production of Agro -climate zone of Tanzania
Agro-climatic zone is an important concept for agricultural planning. The concept is used to
identify regions suitable for particular crop production. Agro climatic zones for any particular
place can be determined by the combination of moisture availability and temperature zones.
Challenge 1: Produce the average annual temperature using a step by step procedure, show the
procedure and produce the result.
STEPS:
I. Image calculator in the Arc Map was opened and entering the following
formula((((Min_Temp + Max_Temp)/2)-32)*5)/9. This is a complicated formula that
calculates average annual temperature in 0C from the Mean annual Minimum Temperature
and Maximum Temperature in Fahrenheit.
II. Formula was entered by clicking the Files and the operators in the image calculator.
III. Output Five was called Av_An_T
Figure 6: Average Annual temperature in 0C
7. There in the previous steps we have produced the average annual temperature Av_An_T and the
moisture availability Moist_Av which need to be zoned and combined to produce agro climate
zones:
Exercise 3.1 Creating a moisture availability zones and Average annual temperature zone
First the temperature zone model was created. The model classifies the average Annual
temperature Av_An_T into zones using Table 2 provided and then clip the temperature zone to
Tanzania Country boundary
Steps:
I. In ArMap, Click on Modeler builder window was opened
II. Drag and drop Av_An_T on Model builder Window >> Select the file >> Click Add in the
Add data Window, the oval shaped circle in the Model Builder Window labeled Av_An_T
appeared
III. Then reclassify tool was found by click on the tool box (Spatial Analyst Tools >> Reclass
>> Reclassify) and drag and drop the tool on the model builder window
IV. The path was changed by Double Click on the Output Raster and change name from the
default folder to working folder and call the output raster file Temp_Zones.
V. The oval cycle Av_An_T was connected to Reclassify box, by clicking on the connect
tool and click on the Av_An_T oval cycle and move the magic wand that appears to
Reclassify box, and then select input raster
VI. The reclassify tool was opened by Double Click on the Reclassify box >> Change the
values in the Reclassification window to use the values in Table 2>> Reverse the New
Values. Such action will reverse the values such that low temperature zone are assigned
low value code and high temperature high value codes.
VII. Then raster was clipped by Open Tool box again >> Data Management >> Raster >> Raster
Possessing >> Clip, Drag and drop the Clip Tool on the Model Builder Window
VIII. The Output Temp_Zones was connected from Reclassify to Clip tools using a connect
tool. The tool changed the color to show that it has input
IX. Double click the Clip Tool to open the input window, Add Tz_Boundary to Output extent
(optional), Check the box, Use the Input Feature For Clipping Geometry (Optional), Write
Tz_Temp_Zones for Output raster
X. Click Ok to return to the model builder Window.
XI. Click on Auto Layout, The four blue and green boxes icon on the model builder window
toolbar. After inputting of all information your mode will look as follows:
8. Figure 6: Mode Builder Window toolbar for tz_temp_zone
Then click run on model to results the map display as seen in attached below:
9. Figure 7: Tanzania temperature Zones Map
By repeating the previous steps on exercise 3.1 above the below model was created and run to
produce Tanzania moisture availability map
Figure 8: Mode Builder Window toolbar for tz_moist_zone
10. Figure 9: Running the model completed
Figure 10: Tanzania moist zones Map
11. Exercise 3.1.1: Saving the Model.
Model you can be saved and reused. The Model is always saved in the toolbox. To serve the model
there are series of steps adding toolbox and save the model in the toolbox created. The model was
saved as moist zone and can be rerun to other analysis. It displayed as per below snapshot:
Figure 11: Saved Model
12. Figure 12: Moisture Zone availability Model
Exercise 3.2 Creation of Agro climatic Zone from Moisture availability zone and Temperature
Zone.
Steps:
1. By using batch processing of model builder both Tz_Temp_Zones and Tz_Moist_Zones
were converted to vector (Use the Tool Raster to Polygon)
Figure 13: Temperature polygon map produced
13. Figure 14: Moisture polygon map produced
2. Union Tool from Geoprocessing was used to combine the 2 vectors produced in Step 1
above and named Tz_Ag_Z. (The Single vector layer with a tables containing the
Temperature and Vector Values was produced and displayed as per below snapshot)
Figure 15: TZ_AG_Z map (Union of two polygon)
3. By studying the GRIDCODE and GRIDCODE_1 Fields, these are the values of the
Temperature zones and Field Zones, if the Value of GRIDCODE is 0 and the Values of
GRIDCODE_1 is any other value and vice versa it means those rows have no combination
of temperature zones and moisture availability zones. Therefore, they do not produce
Agro-climate Zone therefore we need to delate them and remain with row that have
GRIDCODE and GRIDECODE_1values other than 0.
14. Figure 16: Temperature zones and Field Zones
Challenge 3: Write a SQL statement to select All values with GRIDCODE value 0 and
GRIDECODE_1values 0
1. Start editor was started and select the GRIDCODE and GRIDECODE_1 with values 0 and
delete them ( by use of the SQL Tool, Query by attribute)
2. After deleting rows with GRIDCODE value 0 and GRIDECODE_1values 0 stop editing
and serve edits. The below tables were produced:
15. Figure 17: SQL Tool, Query by attribute
Figure 18: After deleting rows with GRIDCODE value 0 and GRIDECODE_1values 0 (Agro
climatic Zones of Tanzania (FID)
16. 3. FID in the map was visualized to produce The Tanzanian Agro Climate Zone Map. (It is
not possible to symbolize FID in ArcGIS. Therefore New Field was crated with the FID
Values)
4. This was done by Add Field and Call it TzAgClZ
5. Then Populate TzAgClZ Field with FID result by right clinking of the Field and Select
Field Calculator>>formula [FID] *1 was entered in the field calculator window, then OK
(The FID Valued duplicated in the TzAgClZ Field.)
6. Then Tz_Ag_Z was visualized using the Unique Value, and TzAgClZ Field was chosen
as the input values. (A map of Tanzania Agro climate Map displayed as seen in attached
below snapshot)
7. The Map was labeled with the Values of both GRIDCODE and GRIDECODE_1 to see the
moisture and Temperature combination of each zone.
Figure 19: The map showing moisture and Temperature combination of each zone
17. Challenge 4: Create a Model that produce Agro climate Zones using all steps in this practical.
Figure 20: Overall Agro climate Zones