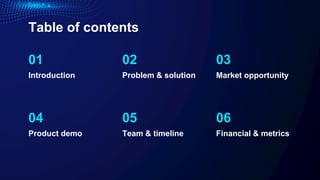
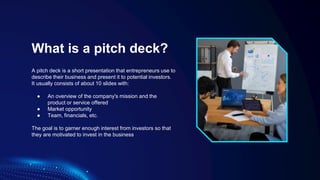
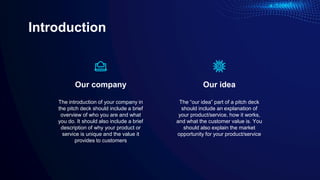
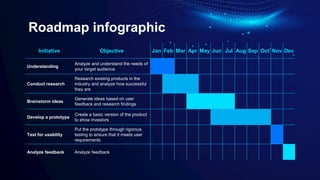
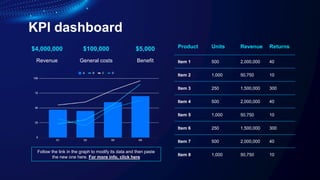
La gestión de software se refiere a la planificación, organización y control de los procesos relacionados con el desarrollo, implementación y mantenimiento de programas informáticos. Aquí te proporciono algunos detalles clave:
¿Qué es un software de gestión?
Un software de gestión es un sistema diseñado para simplificar grandes proyectos y tareas, facilitar la colaboración en equipos de trabajo y aumentar la productividad en los procesos y operaciones de un negocio1.
Está compuesto por diversas herramientas para ejecutar tareas administrativas y operativas.
Su objetivo principal es mejorar la eficiencia y la organización interna de una empresa.
Características clave de un software de gestión:
Colaborativos: Unifican todas las áreas de la empresa y facilitan la comunicación entre colaboradores.
Visibles: Proporcionan una vista completa de lo que sucede en la empresa, agilizando la toma de decisiones estratégicas.
Adaptables: Crecen junto con la empresa y se ajustan a las necesidades cambiantes.
Intuitivos: Son fáciles de implementar y aprender, con interfaces amigables para los usuarios.
Beneficios de un software de gestión en las empresas:
Eficiencia: Optimiza procesos y reduce errores.
Organización: Facilita la gestión interna y la toma de decisiones.
Colaboración: Mejora la comunicación entre equipos.
Escalabilidad: Se adapta al crecimiento de la empresa.
Implementación sencilla: No requiere mucho tiempo de capacitación.
En resumen, un software de gestión es una herramienta esencial para mantener la eficiencia y el orden en las operaciones empresariales. Si necesitas más detalles o ejemplos específicos, no dudes en preguntar.
2. Contents of this template
Fonts To view this template correctly in PowerPoint, download and install the fonts we used
Used and alternative resources An assortment of graphic resources that are suitable for use in this presentation
Thanks slide You must keep it so that proper credits for our design are given
Colors All the colors used in this presentation
Icons and infographic resources These can be used in the template, and their size and color can be edited
Editable presentation theme You can edit the master slides easily. For more info, click here
You can delete this slide when you’re done editing the presentation
For more info:
Slidesgo | Blog | FAQs
You can visit our sister projects:
Freepik | Flaticon | Storyset | Wepik | Videvo
4. What is a pitch deck?
A pitch deck is a short presentation that entrepreneurs use to
describe their business and present it to potential investors.
It usually consists of about 10 slides with:
● An overview of the company's mission and the
product or service offered
● Market opportunity
● Team, financials, etc.
The goal is to garner enough interest from investors so that
they are motivated to invest in the business
6. Our idea
Introduction
The “our idea” part of a pitch deck
should include an explanation of
your product/service, how it works,
and what the customer value is. You
should also explain the market
opportunity for your product/service
The introduction of your company in
the pitch deck should include a brief
overview of who you are and what
you do. It should also include a brief
description of why your product or
service is unique and the value it
provides to customers
Our company
7. Main ideas of a pitch deck
Presentation Investors
A great presentation for a
pitch deck should be concise,
clear and easy to
understand. Visual elements
such as charts, graphs,
images, and videos can help
to make the presentation
engaging
When it comes to picking
investors for a pitch deck, it's
important to research
potential investors and
understand their preferences,
goals and interests
The value of a product is
determined by how much
customers are willing to pay
for it. It's a combination of
factors, including the quality
of the product, its features,
and how well it meets
customer needs
Value
8. Stay ahead of trends
Key ideas in market opportunity
Analyze existing customer needs and
identify gaps in the market to find new
opportunities
Utilize technology and customer
feedback to come up with novel
solutions that meet your customer’s
demands or needs
Monitor changes in the marketplace,
such as shifts in consumer behavior or
emerging technologies, to stay
competitive and capitalize on new
opportunities and trends
Identify times of year when demand for
certain products may spike, such as
holidays or special occasions, and use
these times to target customers or
maximize sales
Research new markets Innovative solutions
Seasonal spikes
9. Six recommendations
Structure your pitch deck
clearly and make sure all
the important points are
easy to understand
Incorporate visuals or
graphics to illustrate your
message and keep the
audience engaged
Include impactful stories,
statistics, or facts that will
help your audience
remember your
message afterwards
Practice presenting your
deck beforehand with
friends or colleagues for
feedback, then use this
input to refine it further
Keep it simple Use visuals Keep it short
A good pitch deck should be
concise and clear; avoid
trying to cram in too much
information
A pitch deck is an overview
of your business; focus on
key points that get the most
important ideas across
Make it
memorable Test & iterate Main points
10. Estimated delivery time per unit
9h 55m 23s
333,000
Users bought our product
386,000 km
Avg. distance travelled by logistics team
12. Revenue by quarter
Q4
October -
December
Q3
July - September
Q2
April - June
Q1
January - March
Follow the link in the graph to modify its data and then paste the new one here. For more info, click here
13. Competition comparison
Features Value Pricing Trial Competence Share
Company A Fuel economy Special offers $23,000 No Low 8%
Company B Design Reliability $27,000 No Low 5%
Company C Performance Repairs $30,000 Yes High 20%
Company D Safety features Marketing $24,000 No High 22%
Company E Technology Customers $32,000 Yes Low 10%
Company F Comfort Best prices $15,000 Yes High 30%
Company G Customization Brand name $45,000 No Low 5%
15. Timeline of your presentation
Provide a brief
overview of the
pitch deck's content
Engage the
audience with a
compelling
introduction
Identify the
customer's pain
points
and challenges
Describe how your
product or service
can solve the
problem
Highlight the unique
value proposition
and benefits of your
specific solution
Analyze the target
market size, growth
potential, and
competition briefly
Explain your
financial needs and
briefly outline your
funding allocation
End with a clear and
concise call to
action
16. Organizational chart
Jane Doe
CEO
John Smith
Department Head
Maya Wilson
Department Head
Steven Ander
Manager
Sarah Williams
Manager
Richard Taylor
Manager
Emma Miller
Manager
William Young
Employee
James Scott
Employee
Michelle García
Employee
Brian Clark
Employee
Alan Turner
Employee
17. Market size overview
$100M
$20M
$5M
Outer circle
Include the total size of the market, which
represents the entire potential customer base for
the product or service
Middle circle
Identify the target market for the product or service,
which may be a subset of the total market. This
could be based on factors such as demographics,
geography, or specific needs
Inner circle
Indicate the current market size, which represents
the portion of the target market that the company
has successfully captured
18. Roadmap infographic
Initiative Objective Jan Feb Mar Apr May Jun Jul Aug Sep Oct Nov Dec
Understanding
Analyze and understand the needs of
your target audience
Conduct research
Research existing products in the
industry and analyze how successful
they are
Brainstorm ideas
Generate ideas based on user
feedback and research findings
Develop a prototype
Create a basic version of the product
to show investors
Test for usability
Put the prototype through rigorous
testing to ensure that it meets user
requirements
Analyze feedback Analyze feedback
19. KPI dashboard
Product Units Revenue Returns
Item 1 500 2,000,000 40
Item 2 1,000 50,750 10
Item 3 250 1,500,000 300
Item 4 500 2,000,000 40
Item 5 1,000 50,750 10
Item 6 250 1,500,000 300
Item 7 500 2,000,000 40
Item 8 1,000 50,750 10
$4,000,000 $100,000 $5,000
Revenue General costs Benefit
Follow the link in the graph to modify its data and then paste
the new one here. For more info, click here
20. CREDITS: This presentation template was created by
Slidesgo, and includes icons by Flaticon, and infographics &
images by Freepik
Thanks!
Do you have any questions?
youremail@freepik.com
+34 654 321 432
yourwebsite.com
Please keep this slide for attribution
22. Alternative resources
Here’s an assortment of alternative resources whose style fits the one of this template:
Vectors
● Abstract secure technology background with circuit
● Modern background design
● Background fingerprint neon
● Gradient ssl illustration
23. Did you like the resources on this template? Get them for free at our other websites:
Vectors
● Abstract big data concept wallpaper
● Abstract secure technology background with circuit
Photos
● Business person looking at finance graphs
● Human resources concept with man
Icons
● Icon Pack: Cloud Computing and Network | Lineal
Resources
24. Instructions for use
If you have a free account, in order to use this template, you must credit Slidesgo by keeping the Thanks slide. Please
refer to the next slide to read the instructions for premium users.
As a Free user, you are allowed to:
● Modify this template.
● Use it for both personal and commercial projects.
You are not allowed to:
● Sublicense, sell or rent any of Slidesgo Content (or a modified version of Slidesgo Content).
● Distribute Slidesgo Content unless it has been expressly authorized by Slidesgo.
● Include Slidesgo Content in an online or offline database or file.
● Offer Slidesgo templates (or modified versions of Slidesgo templates) for download.
● Acquire the copyright of Slidesgo Content.
For more information about editing slides, please read our FAQs or visit our blog:
https://slidesgo.com/faqs and https://slidesgo.com/slidesgo-school
25. As a Premium user, you can use this template without attributing Slidesgo or keeping the Thanks slide.
You are allowed to:
● Modify this template.
● Use it for both personal and commercial purposes.
● Hide or delete the “Thanks” slide and the mention to Slidesgo in the credits.
● Share this template in an editable format with people who are not part of your team.
You are not allowed to:
● Sublicense, sell or rent this Slidesgo Template (or a modified version of this Slidesgo Template).
● Distribute this Slidesgo Template (or a modified version of this Slidesgo Template) or include it in a database or in
any other product or service that offers downloadable images, icons or presentations that may be subject to
distribution or resale.
● Use any of the elements that are part of this Slidesgo Template in an isolated and separated way from this
Template.
● Register any of the elements that are part of this template as a trademark or logo, or register it as a work in an
intellectual property registry or similar.
For more information about editing slides, please read our FAQs or visit our blog:
https://slidesgo.com/faqs and https://slidesgo.com/slidesgo-school
Instructions for use (premium users)
26. This presentation has been made using the following fonts:
Manrope Bold
(https://fonts.google.com/specimen/Manrope)
Alegreya Sans
(https://fonts.google.com/specimen/Alegreya+Sans)
#ffffff #0c1763 #030619
#00dffc #00aeef #0074ff
Fonts & colors used
27. Create your Story with our illustrated concepts. Choose the style you like the most, edit its colors, pick the background
and layers you want to show and bring them to life with the animator panel! It will boost your presentation. Check out how
it works.
Storyset
Pana Amico Bro Rafiki Cuate
28. You can easily resize these resources without losing quality. To change the color, just ungroup the resource and click
on the object you want to change. Then, click on the paint bucket and select the color you want. Group the resource again
when you’re done. You can also look for more infographics on Slidesgo.
Use our editable graphic resources...
29.
30.
31. JANUARY FEBRUARY MARCH APRIL
PHASE 1
Task 1
Task 2
JANUARY FEBRUARY MARCH APRIL MAY JUNE
PHASE 1
PHASE 2
Task 1
Task 2
Task 1
Task 2
32.
33.
34. You can resize these icons without losing quality.
You can change the stroke and fill color; just select the icon and click on the paint bucket/pen.
In Google Slides, you can also use Flaticon’s extension, allowing you to customize and add even more icons.
...and our sets of editable icons