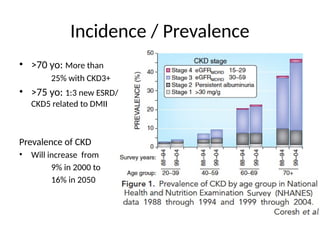
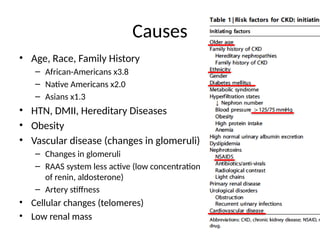
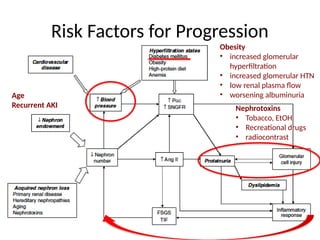
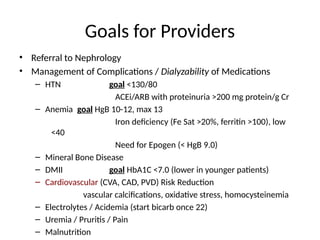
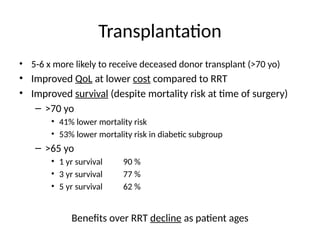
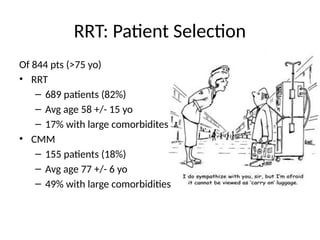
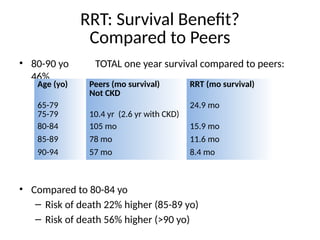
CKD5/ESRD
Geriatric Population
26 Feb 2013
Amy Yau, MD
Definition / Measurement
• Proteinuria
• Serum Cystatin C
– Better prediction of mortality and
CV disease
• Cockcroft-Gault
– Overestimates GFR more than
MDRD
75% calculations within 30% of
measured GFR
• MDRD
– Better with diabetic kidney
disease (GFR <60)
90% calculations within 30%
measured GFR
Falsely Low GFR
- Vegetarian diet
- Unilateral kidney
- Low ECF (heart failure, cirrhosis)
Incidence / Prevalence
• >70 yo: More than
25% with CKD3+
• >75 yo: 1:3 new ESRD/
CKD5 related to DMII
Prevalence of CKD
• Will increase from
9% in 2000 to
16% in 2050
Causes
• Age, Race, Family History
– African-Americans x3.8
– Native Americans x2.0
– Asians x1.3
• HTN, DMII, Hereditary Diseases
• Obesity
• Vascular disease (changes in glomeruli)
– Changes in glomeruli
– RAAS system less active (low concentration
of renin, aldosterone)
– Artery stiffness
• Cellular changes (telomeres)
• Low renal mass
Risk Factors for Progression
Obesity
• increased glomerular
hyperfiltration
• increased glomerular HTN
• low renal plasma flow
• worsening albuminuria
Nephrotoxins
• Tobacco, EtOH
• Recreational drugs
• radiocontrast
Age
Recurrent AKI
Progression
• Natural Rate of Decline (mean)
0.75-1 mL/min/1.73 m2 per year
• 30% adults >70 yo with GFR <60 cc/min will stabilize
Risk Factors for Progression:
Age (GFR when risk of progression > risk of death)
– 18-44 yo GFR 45
– 65-84 yo GFR 15
– > 85 yo GFR n/a risk of death >>>> risk of progression to ESRD
Goals for Providers
• Referral to Nephrology
• Management of Complications / Dialyzability of Medications
– HTN goal <130/80
ACEi/ARB with proteinuria >200 mg protein/g Cr
– Anemia goal HgB 10-12, max 13
Iron deficiency (Fe Sat >20%, ferritin >100), low
<40
Need for Epogen (< HgB 9.0)
– Mineral Bone Disease
– DMII goal HbA1C <7.0 (lower in younger patients)
– Cardiovascular (CVA, CAD, PVD) Risk Reduction
vascular calcifications, oxidative stress, homocysteinemia
– Electrolytes / Acidemia (start bicarb once 22)
– Uremia / Pruritis / Pain
– Malnutrition
RRT
• 1996 – 2003: adjusting to population growth….in 80-90 yo adults…
– Initiation of dialysis rate increased by 57%
• Related to earlier initiation
• More services/access
• Referral:
– (Australia) 8.8% patients with CKD (any stage) referred
mean GFR 27 +/- 14.2 cc/min
– (United States, 2007) 43% new ESRD patients had NOT seen
Nephrologist prior to initiation
• Peritoneal Dialysis
• Hemodialysis (home or at center)
– Nocturnal
– Intermittent (daily or three times a week)
Transplantation
• 5-6 x more likely to receive deceased donor transplant (>70 yo)
• Improved QoL at lower cost compared to RRT
• Improved survival (despite mortality risk at time of surgery)
– >70 yo
• 41% lower mortality risk
• 53% lower mortality risk in diabetic subgroup
– >65 yo
• 1 yr survival 90 %
• 3 yr survival 77 %
• 5 yr survival 62 %
Benefits over RRT decline as patient ages
RRT: Patient Selection
Of 844 pts (>75 yo)
• RRT
– 689 patients (82%)
– Avg age 58 +/- 15 yo
– 17% with large comorbidites
• CMM
– 155 patients (18%)
– Avg age 77 +/- 6 yo
– 49% with large comorbidities
• 80-90 yo TOTAL one year survival compared to peers:
46%
• Compared to 80-84 yo
– Risk of death 22% higher (85-89 yo)
– Risk of death 56% higher (>90 yo)
Age (yo) Peers (mo survival)
Not CKD
RRT (mo survival)
65-79
75-79 10.4 yr (2.6 yr with CKD)
24.9 mo
80-84 105 mo 15.9 mo
85-89 78 mo 11.6 mo
90-94 57 mo 8.4 mo
RRT: Survival Benefit?
Compared to Peers
RRT: Survival Benefit?
Compared to CMM
• >80 yo Compared to CCM*
– 28.9 mo survival (RRT)
– 8.9 mo survival (CCM)
Wong et al. Renal Failure 2007
RRT: Survival Benefit?
With Comorbidities
Comorbidity Score (Charleston, Davies): http://touchcalc.com/calculators/cci_js
• Compared to 0-1 Comorbidities Charleston
– 2-3 31% increased r/o death
– 4 68% increased r/o death
• >75 yo Davies
– >2 comorbidities no change in survival
– <2 comorbidities improvement in mortality by half
RRT (mo survival) CMM (mo survival)
<75 yo >75 yo <75 yo >75 yo
69.6 25.1 33.0 15.5
Low comorbidity
non DMII
72.5
74.4
36.8
24.4
33.0
52.8
29.4
18.1
High comorbidity *
(not significant)
26.0 17.4
Fig. 3. Cox proportional
model survival curve of
patients aged >75 years -
CM vs RRT - adjusted for
age, gender, ethnicity, the
presence of diabetes and
the presence of high
comorbidity. Median
survival in RRT patients is
better by <4 mo, which is
not statistically significant
(P=0.43)
RRT: QoL
CMM: 10-16 days per year
RRT: 20-35 days per year
Less than General Population
Similar to CMM
CMM: QoL
References
• Munikrishnappa. Chronic Kidney Disease in the Elderly - a Geriatrician's Perspective. 2007
• Williams et al. Kidney Disease in Elderly Diabetic Patients. ASN. 2009
• Jenette. Geriatric Nephrology: Research, Policy, & Practice. UNC Kidney Center PPT. 2011.
• Verma. Kidney Disease and Hypertension in Geriatric Population. Penn STate Hershey Medical Center PPT.
• O'Hare. Hypertension, Chronic Kidney Disease, and the Elderly. ASN. 2009
• Murtagh et al. Symptoms in the Month Before Death for Stage 5 Chronic Kidney Disease Patients Managed
Without Dialysis. Journal of Pain and Symptom Management. 2010.
• Murtagh et al. Dialysis or not? A comparative survival study of patients over 75 years with chronic kidney disease
stage 5. NDT. 2007
• Kurella et al. Octogenarians and Nonageneraians Starting Dialysis in the United States. Ann Intern Med. 2007.
• Foote. Outcomes of dialysis in the elderly. The George Institute for Global Health PPT. 2011
• Eriksen et al. The Progression of chronic kidney disease: A 10 year population based study of the effects of
gender and age. ISN. 2006
• Chandna et al. Survival of elderly patients with stage 5 CKD: comparison of conservative management and renal
replacement therapy. NDT. 2010
• Boudville et al. Limited referral to nephrologists from a tertiary geriatric outpatient clinic despite a high
prevalence of chronic kidney disease and anaemia. BMC Geriatrics 2012.
• Anderson et al. Predision, Progression, and Outcomes of Chronic Kidney Disease in Older Adults. JASN. 2009
• Taal et al. Predicting initiation and progression of chronic kidney disease: Developing renal risk scores. ISN. 2006
CKD and ESRD in Geriatric Patients

CKD and ESRD in Geriatric Patients

  • 1.
  • 2.
    Definition / Measurement •Proteinuria • Serum Cystatin C – Better prediction of mortality and CV disease • Cockcroft-Gault – Overestimates GFR more than MDRD 75% calculations within 30% of measured GFR • MDRD – Better with diabetic kidney disease (GFR <60) 90% calculations within 30% measured GFR Falsely Low GFR - Vegetarian diet - Unilateral kidney - Low ECF (heart failure, cirrhosis)
  • 3.
    Incidence / Prevalence •>70 yo: More than 25% with CKD3+ • >75 yo: 1:3 new ESRD/ CKD5 related to DMII Prevalence of CKD • Will increase from 9% in 2000 to 16% in 2050
  • 4.
    Causes • Age, Race,Family History – African-Americans x3.8 – Native Americans x2.0 – Asians x1.3 • HTN, DMII, Hereditary Diseases • Obesity • Vascular disease (changes in glomeruli) – Changes in glomeruli – RAAS system less active (low concentration of renin, aldosterone) – Artery stiffness • Cellular changes (telomeres) • Low renal mass
  • 5.
    Risk Factors forProgression Obesity • increased glomerular hyperfiltration • increased glomerular HTN • low renal plasma flow • worsening albuminuria Nephrotoxins • Tobacco, EtOH • Recreational drugs • radiocontrast Age Recurrent AKI
  • 6.
    Progression • Natural Rateof Decline (mean) 0.75-1 mL/min/1.73 m2 per year • 30% adults >70 yo with GFR <60 cc/min will stabilize Risk Factors for Progression: Age (GFR when risk of progression > risk of death) – 18-44 yo GFR 45 – 65-84 yo GFR 15 – > 85 yo GFR n/a risk of death >>>> risk of progression to ESRD
  • 7.
    Goals for Providers •Referral to Nephrology • Management of Complications / Dialyzability of Medications – HTN goal <130/80 ACEi/ARB with proteinuria >200 mg protein/g Cr – Anemia goal HgB 10-12, max 13 Iron deficiency (Fe Sat >20%, ferritin >100), low <40 Need for Epogen (< HgB 9.0) – Mineral Bone Disease – DMII goal HbA1C <7.0 (lower in younger patients) – Cardiovascular (CVA, CAD, PVD) Risk Reduction vascular calcifications, oxidative stress, homocysteinemia – Electrolytes / Acidemia (start bicarb once 22) – Uremia / Pruritis / Pain – Malnutrition
  • 8.
    RRT • 1996 –2003: adjusting to population growth….in 80-90 yo adults… – Initiation of dialysis rate increased by 57% • Related to earlier initiation • More services/access • Referral: – (Australia) 8.8% patients with CKD (any stage) referred mean GFR 27 +/- 14.2 cc/min – (United States, 2007) 43% new ESRD patients had NOT seen Nephrologist prior to initiation • Peritoneal Dialysis • Hemodialysis (home or at center) – Nocturnal – Intermittent (daily or three times a week)
  • 9.
    Transplantation • 5-6 xmore likely to receive deceased donor transplant (>70 yo) • Improved QoL at lower cost compared to RRT • Improved survival (despite mortality risk at time of surgery) – >70 yo • 41% lower mortality risk • 53% lower mortality risk in diabetic subgroup – >65 yo • 1 yr survival 90 % • 3 yr survival 77 % • 5 yr survival 62 % Benefits over RRT decline as patient ages
  • 10.
    RRT: Patient Selection Of844 pts (>75 yo) • RRT – 689 patients (82%) – Avg age 58 +/- 15 yo – 17% with large comorbidites • CMM – 155 patients (18%) – Avg age 77 +/- 6 yo – 49% with large comorbidities
  • 11.
    • 80-90 yoTOTAL one year survival compared to peers: 46% • Compared to 80-84 yo – Risk of death 22% higher (85-89 yo) – Risk of death 56% higher (>90 yo) Age (yo) Peers (mo survival) Not CKD RRT (mo survival) 65-79 75-79 10.4 yr (2.6 yr with CKD) 24.9 mo 80-84 105 mo 15.9 mo 85-89 78 mo 11.6 mo 90-94 57 mo 8.4 mo RRT: Survival Benefit? Compared to Peers
  • 12.
    RRT: Survival Benefit? Comparedto CMM • >80 yo Compared to CCM* – 28.9 mo survival (RRT) – 8.9 mo survival (CCM) Wong et al. Renal Failure 2007
  • 14.
    RRT: Survival Benefit? WithComorbidities Comorbidity Score (Charleston, Davies): http://touchcalc.com/calculators/cci_js • Compared to 0-1 Comorbidities Charleston – 2-3 31% increased r/o death – 4 68% increased r/o death • >75 yo Davies – >2 comorbidities no change in survival – <2 comorbidities improvement in mortality by half RRT (mo survival) CMM (mo survival) <75 yo >75 yo <75 yo >75 yo 69.6 25.1 33.0 15.5 Low comorbidity non DMII 72.5 74.4 36.8 24.4 33.0 52.8 29.4 18.1 High comorbidity * (not significant) 26.0 17.4
  • 16.
    Fig. 3. Coxproportional model survival curve of patients aged >75 years - CM vs RRT - adjusted for age, gender, ethnicity, the presence of diabetes and the presence of high comorbidity. Median survival in RRT patients is better by <4 mo, which is not statistically significant (P=0.43)
  • 17.
    RRT: QoL CMM: 10-16days per year RRT: 20-35 days per year Less than General Population Similar to CMM
  • 18.
  • 19.
    References • Munikrishnappa. ChronicKidney Disease in the Elderly - a Geriatrician's Perspective. 2007 • Williams et al. Kidney Disease in Elderly Diabetic Patients. ASN. 2009 • Jenette. Geriatric Nephrology: Research, Policy, & Practice. UNC Kidney Center PPT. 2011. • Verma. Kidney Disease and Hypertension in Geriatric Population. Penn STate Hershey Medical Center PPT. • O'Hare. Hypertension, Chronic Kidney Disease, and the Elderly. ASN. 2009 • Murtagh et al. Symptoms in the Month Before Death for Stage 5 Chronic Kidney Disease Patients Managed Without Dialysis. Journal of Pain and Symptom Management. 2010. • Murtagh et al. Dialysis or not? A comparative survival study of patients over 75 years with chronic kidney disease stage 5. NDT. 2007 • Kurella et al. Octogenarians and Nonageneraians Starting Dialysis in the United States. Ann Intern Med. 2007. • Foote. Outcomes of dialysis in the elderly. The George Institute for Global Health PPT. 2011 • Eriksen et al. The Progression of chronic kidney disease: A 10 year population based study of the effects of gender and age. ISN. 2006 • Chandna et al. Survival of elderly patients with stage 5 CKD: comparison of conservative management and renal replacement therapy. NDT. 2010 • Boudville et al. Limited referral to nephrologists from a tertiary geriatric outpatient clinic despite a high prevalence of chronic kidney disease and anaemia. BMC Geriatrics 2012. • Anderson et al. Predision, Progression, and Outcomes of Chronic Kidney Disease in Older Adults. JASN. 2009 • Taal et al. Predicting initiation and progression of chronic kidney disease: Developing renal risk scores. ISN. 2006

Editor's Notes

  • #2 Overestimate ie looks better than it is (ie underestimate extent of CKD) MDRD – better DMII CG – more underestimation GFR 3 mo or more
  • #5 HTN DMII Proteinuria (ACEi/ARB) Biggest (above 3) Obesity increased glomerular hyperfiltration increased glomerular HTN low renal plasma flow worsening albuminuria Nephrotoxins (tobacco, EtOH, recreational drugs, Pb, radiocontrast)
  • #6 Comorbidities
  • #7 HTN BP goal <130/80 ACEi/ARB with proteinuria >200 mg/g macro – DMII ARB, DMI ACEi micro – ACEi or ARB Diuretic, nonDHP CCB (Dilt/verapamil) Dialyzability of meds (50-70% atenolol, 50% lisinopril) DMII Tight glucose control (nocturia, incontinence, high fluid overload) Glucose control decreases microvascular changes, but not macro (ie CV) Unreliable HbA1C – if on RRT Cardiovascular Traditional RF Accelerated vascular calcifications – poorer outcomes with PCI/CABG Oxidative stress Fe deficiency (may need IV)
  • #8 Exclusion criteria: advanced metastatic cancer more liberal acceptance like “preventative”: earlier initiation, more services/access
  • #11 * (dpd on date of decision, late referral, etc)
  • #14 25% less survival benefit for diabetics compared to non-diabetic P 0.12 *
  • #17 Benefits: Improv’t blood pressure Improv’t LV mass
  • #18 Last month of life Only 25% with palliative care consults (need to discuss palliative options prior to initiation as well) Fassett et al. 14% ESRD deaths occurred in hospice 40% ESRD from withdrawal of dialysis entered hospice