Downloaded 12 times


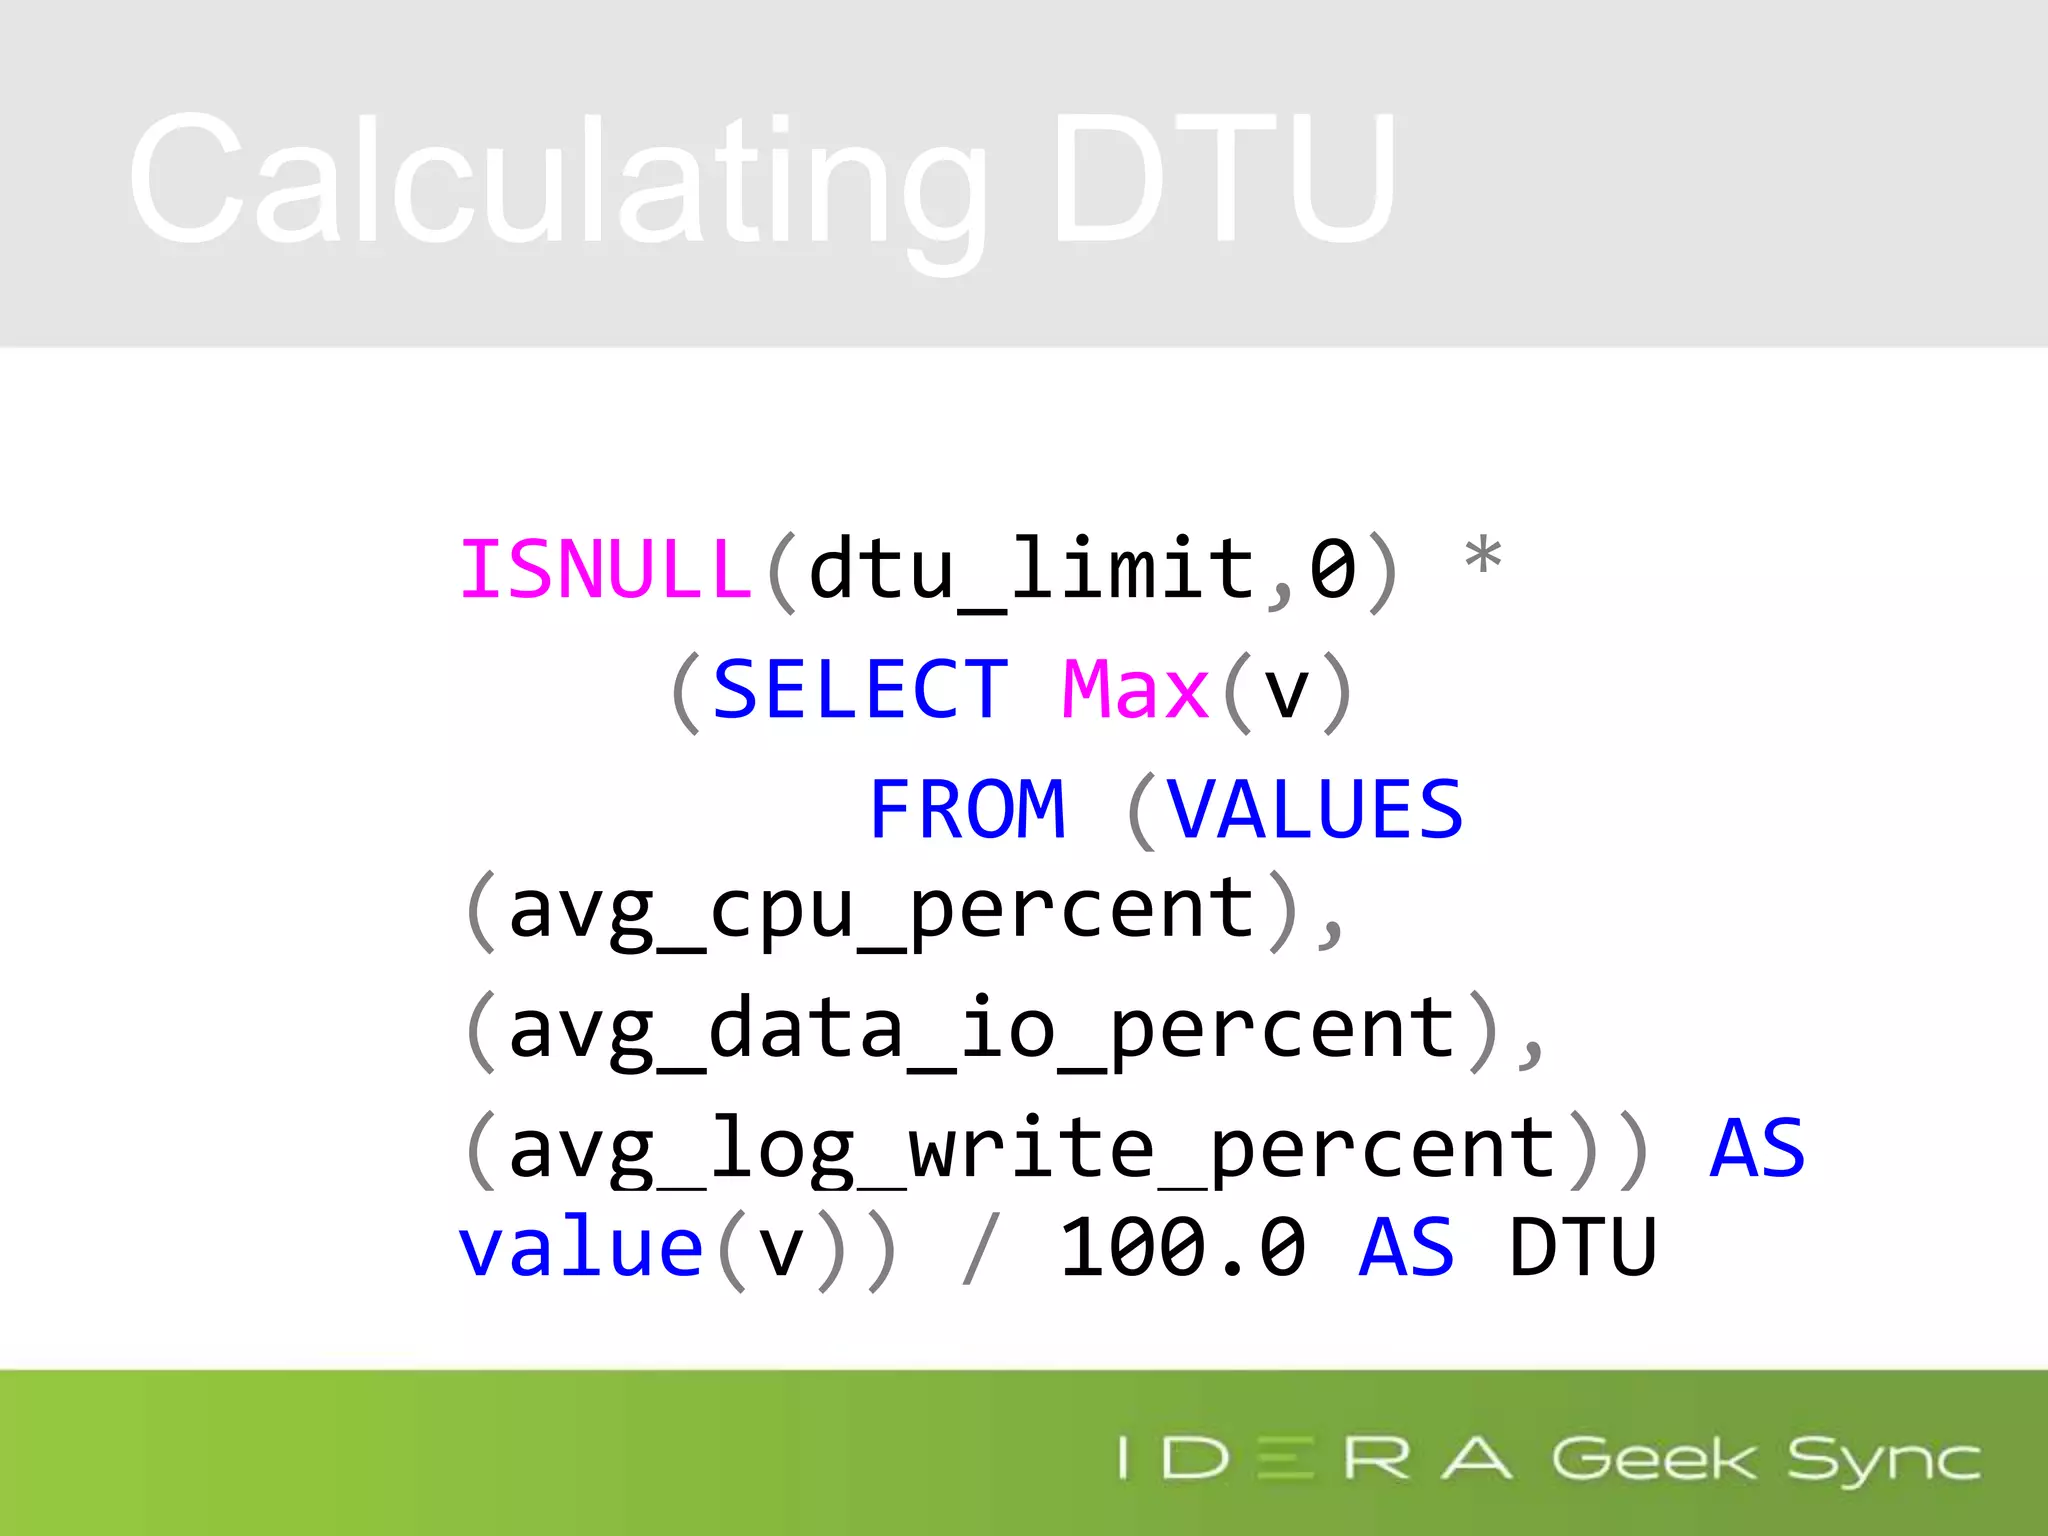
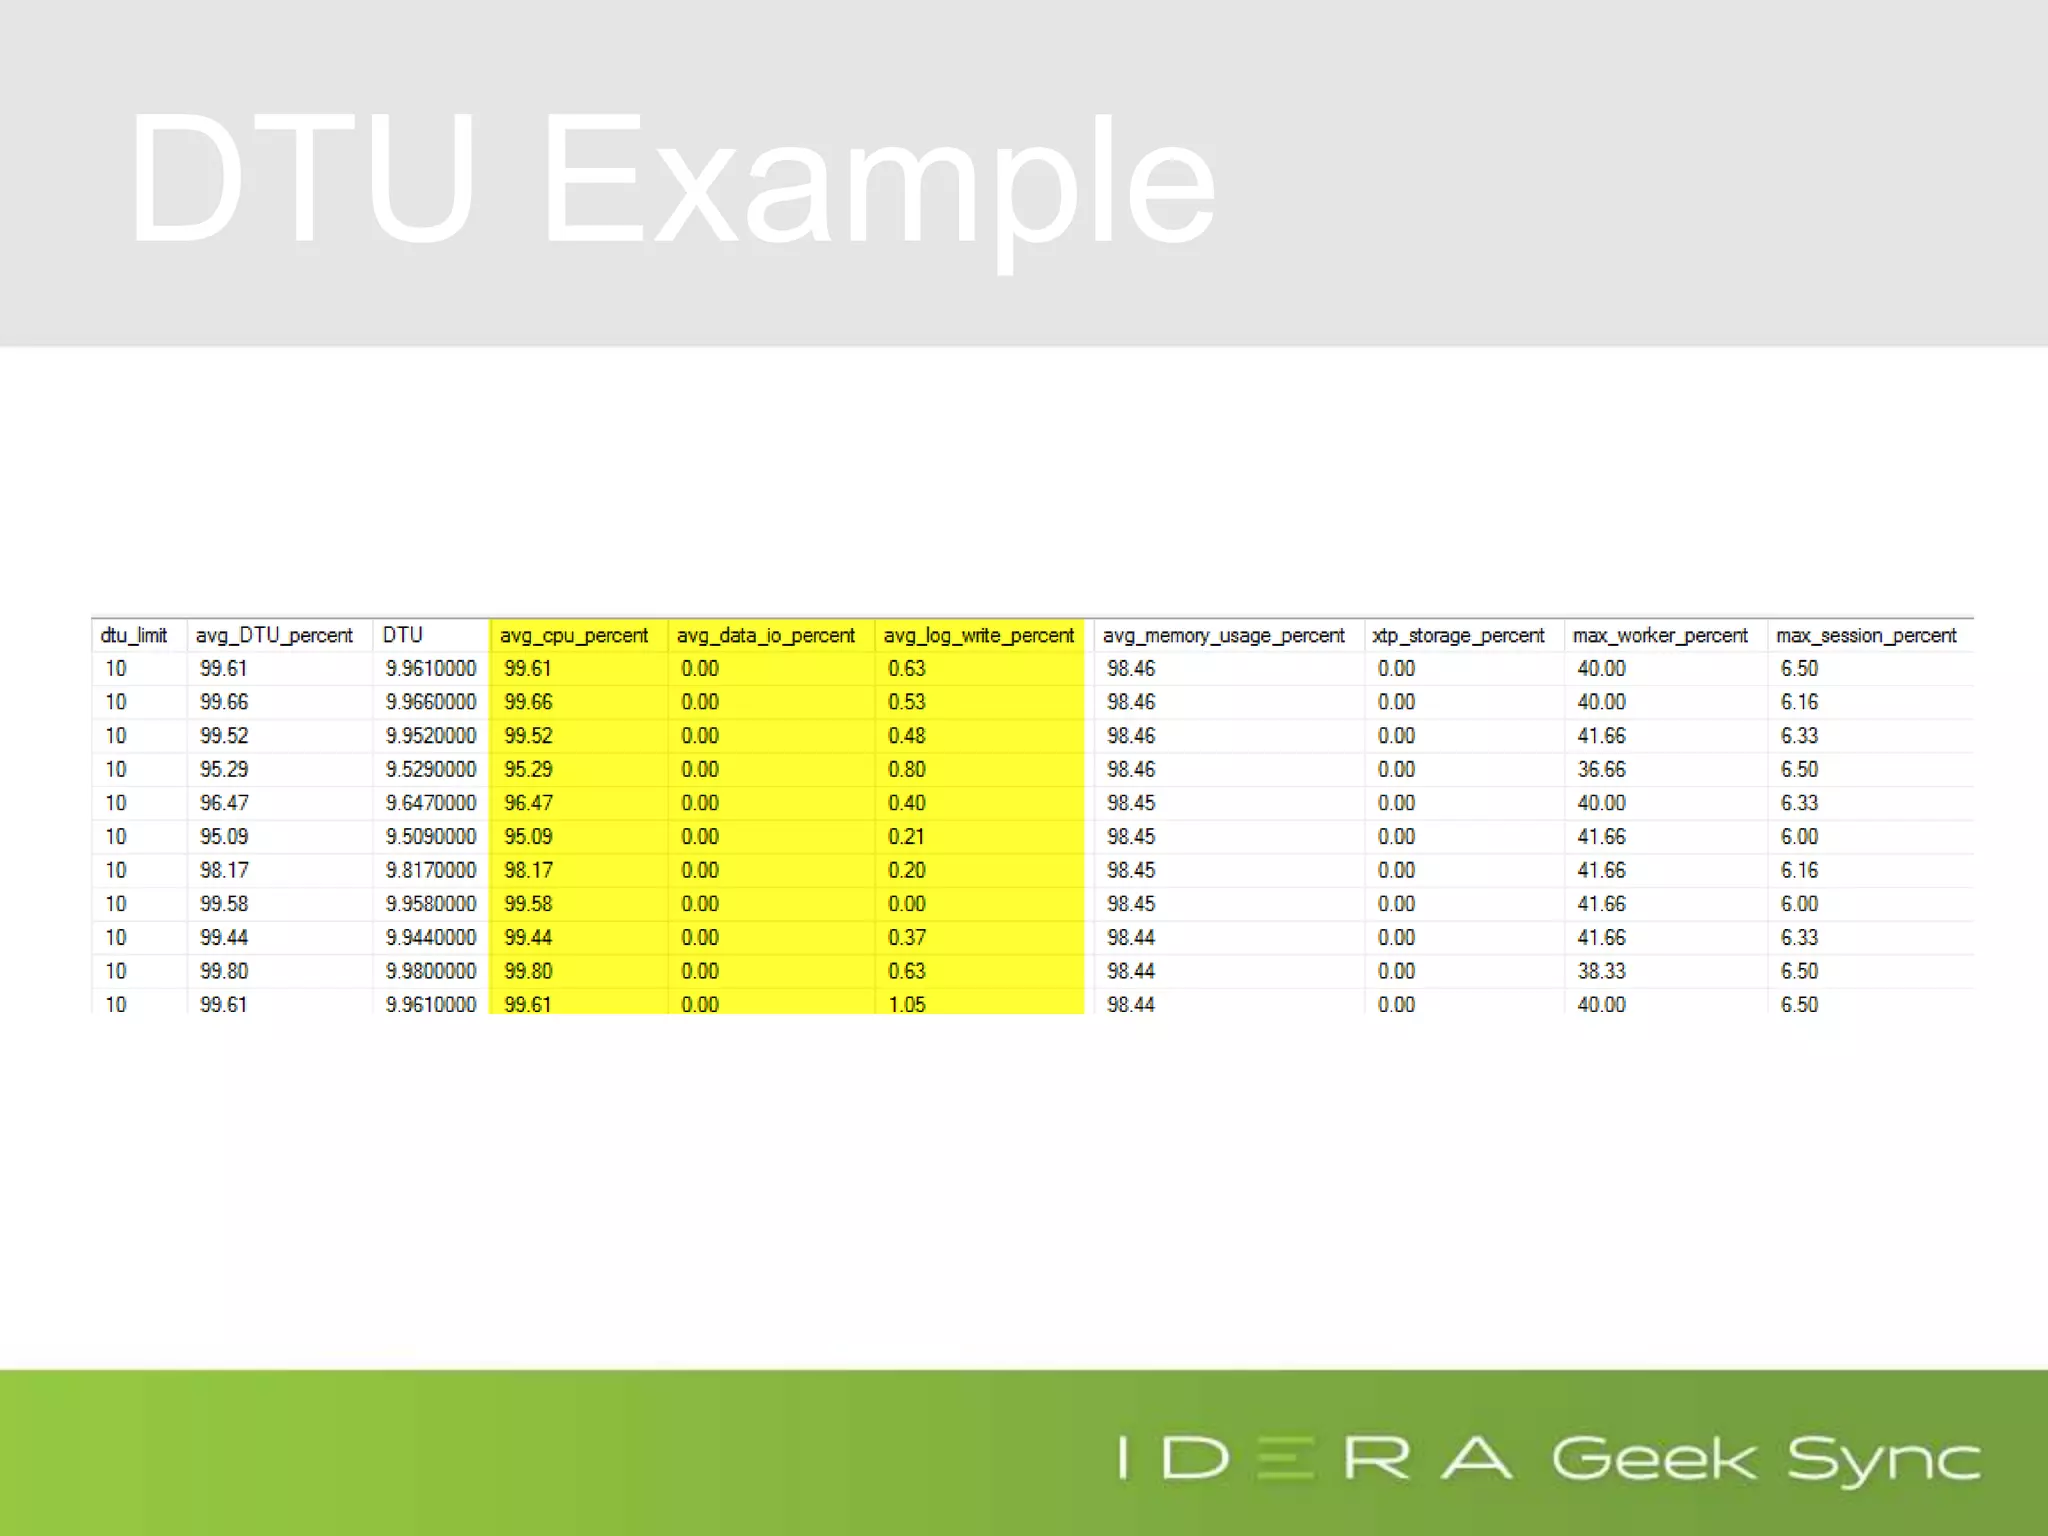
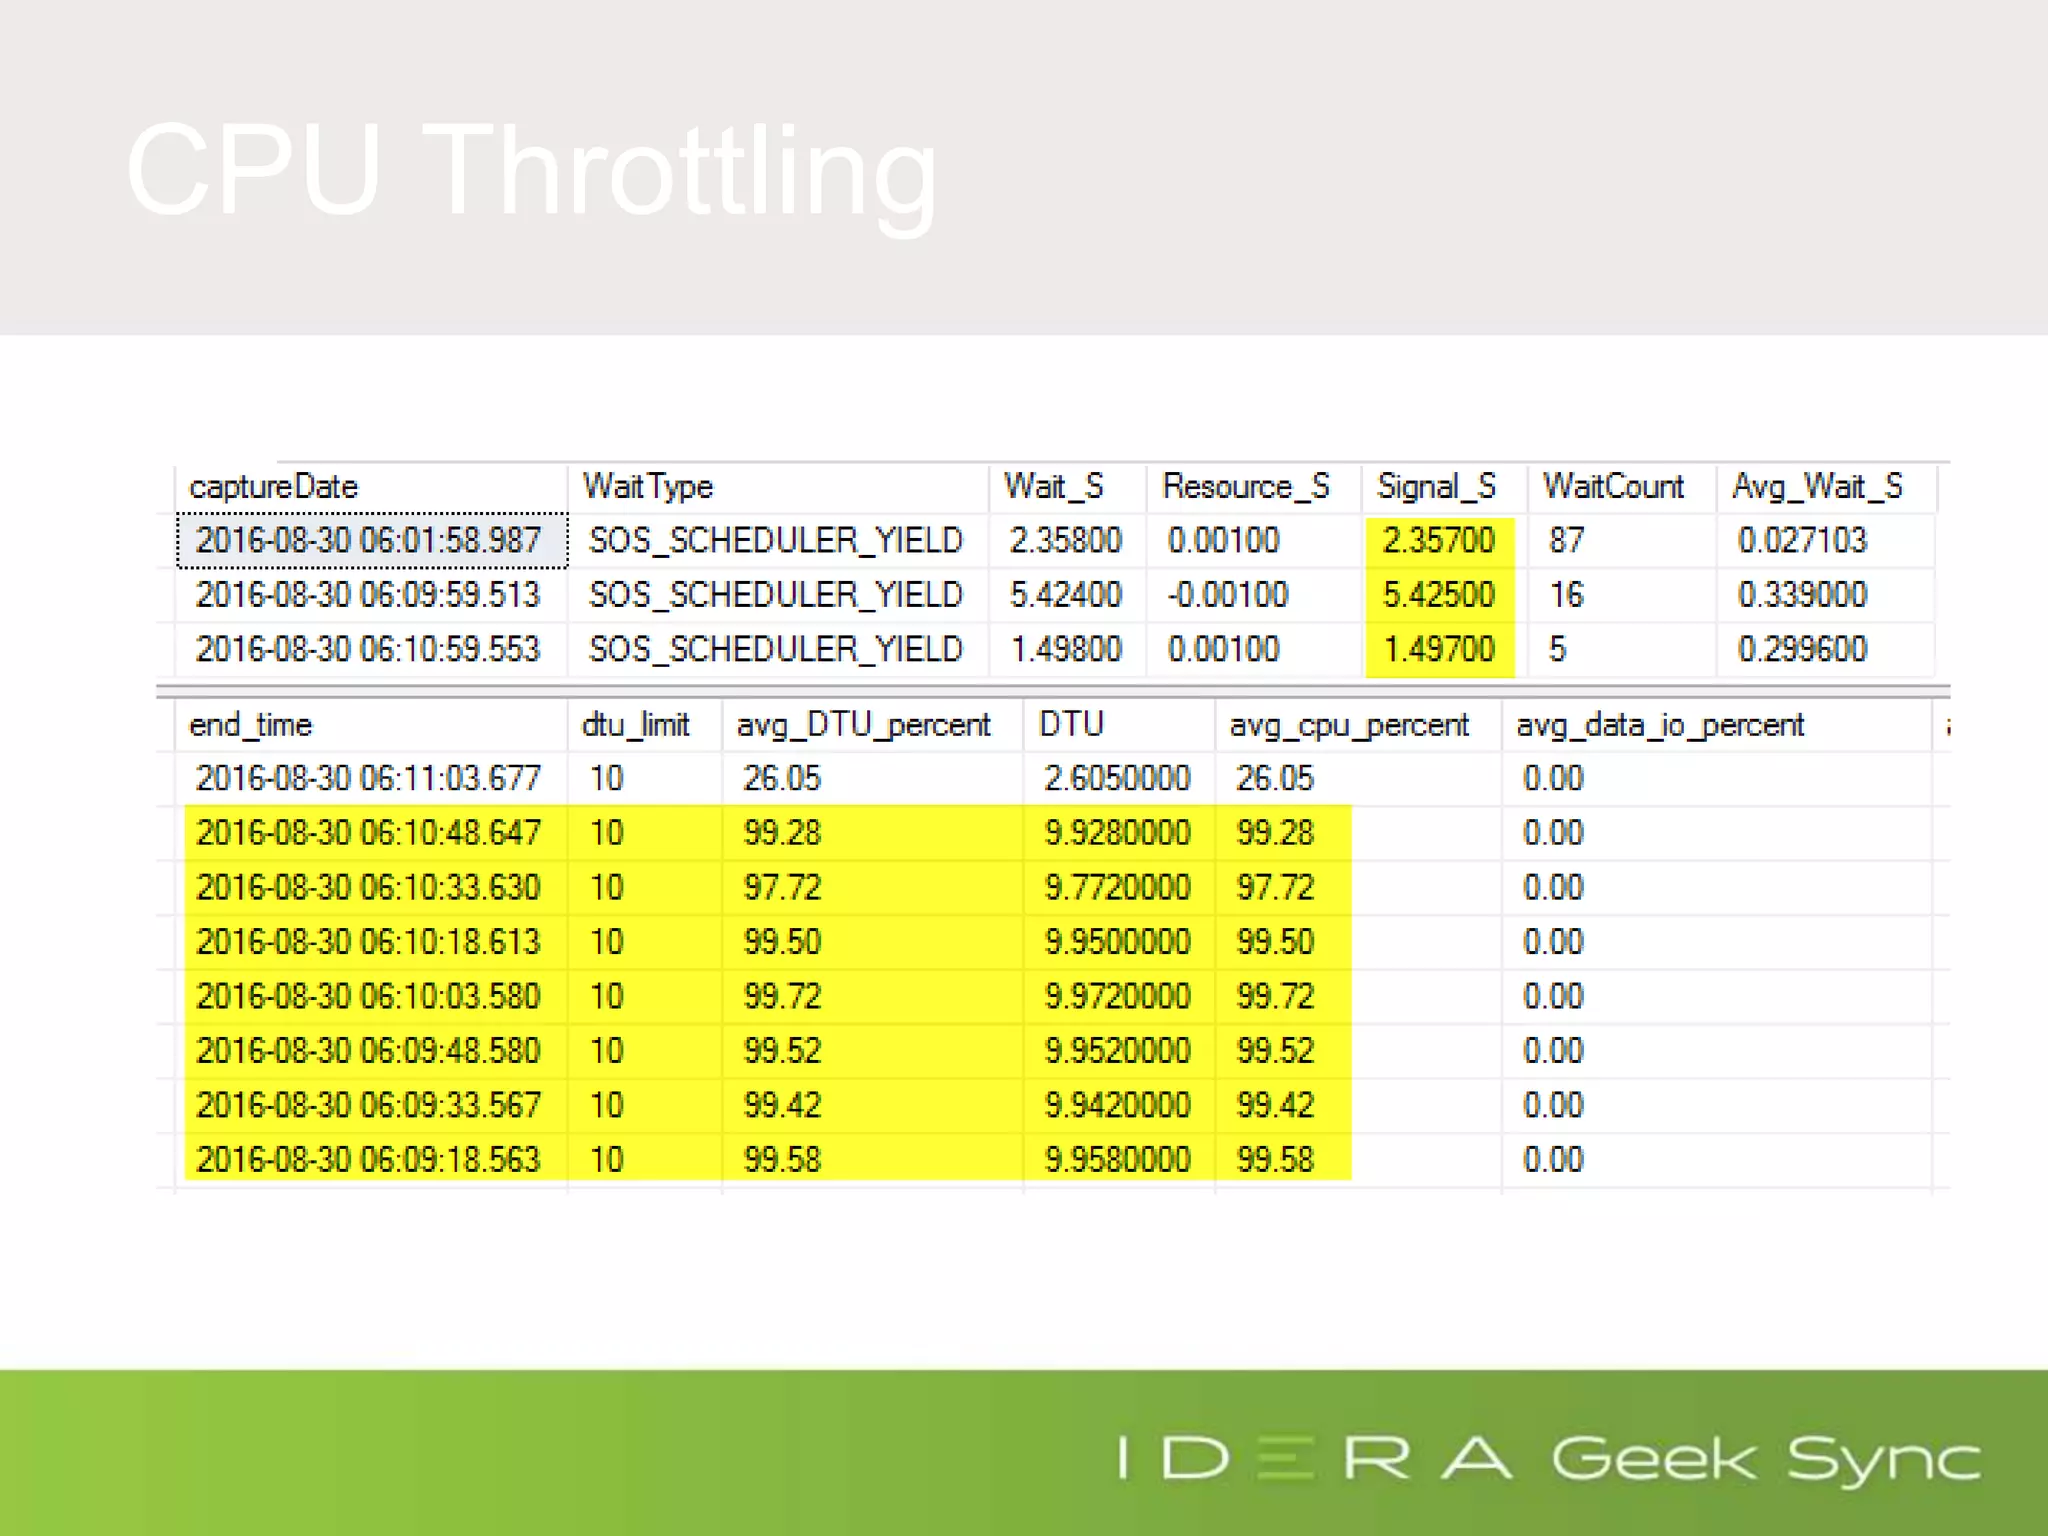
![DTU Percent
(SELECT Max(v)
FROM (VALUES (avg_cpu_percent),
(avg_data_io_percent),
(avg_log_write_percent)) AS
value(v)) AS [avg_DTU_percent]](https://image.slidesharecdn.com/azuresqldatabaseperformancetuning-iderageeksync-april262017-2-170426182409/75/Geek-Sync-Azure-SQL-Database-Performance-Tuning-20-2048.jpg)


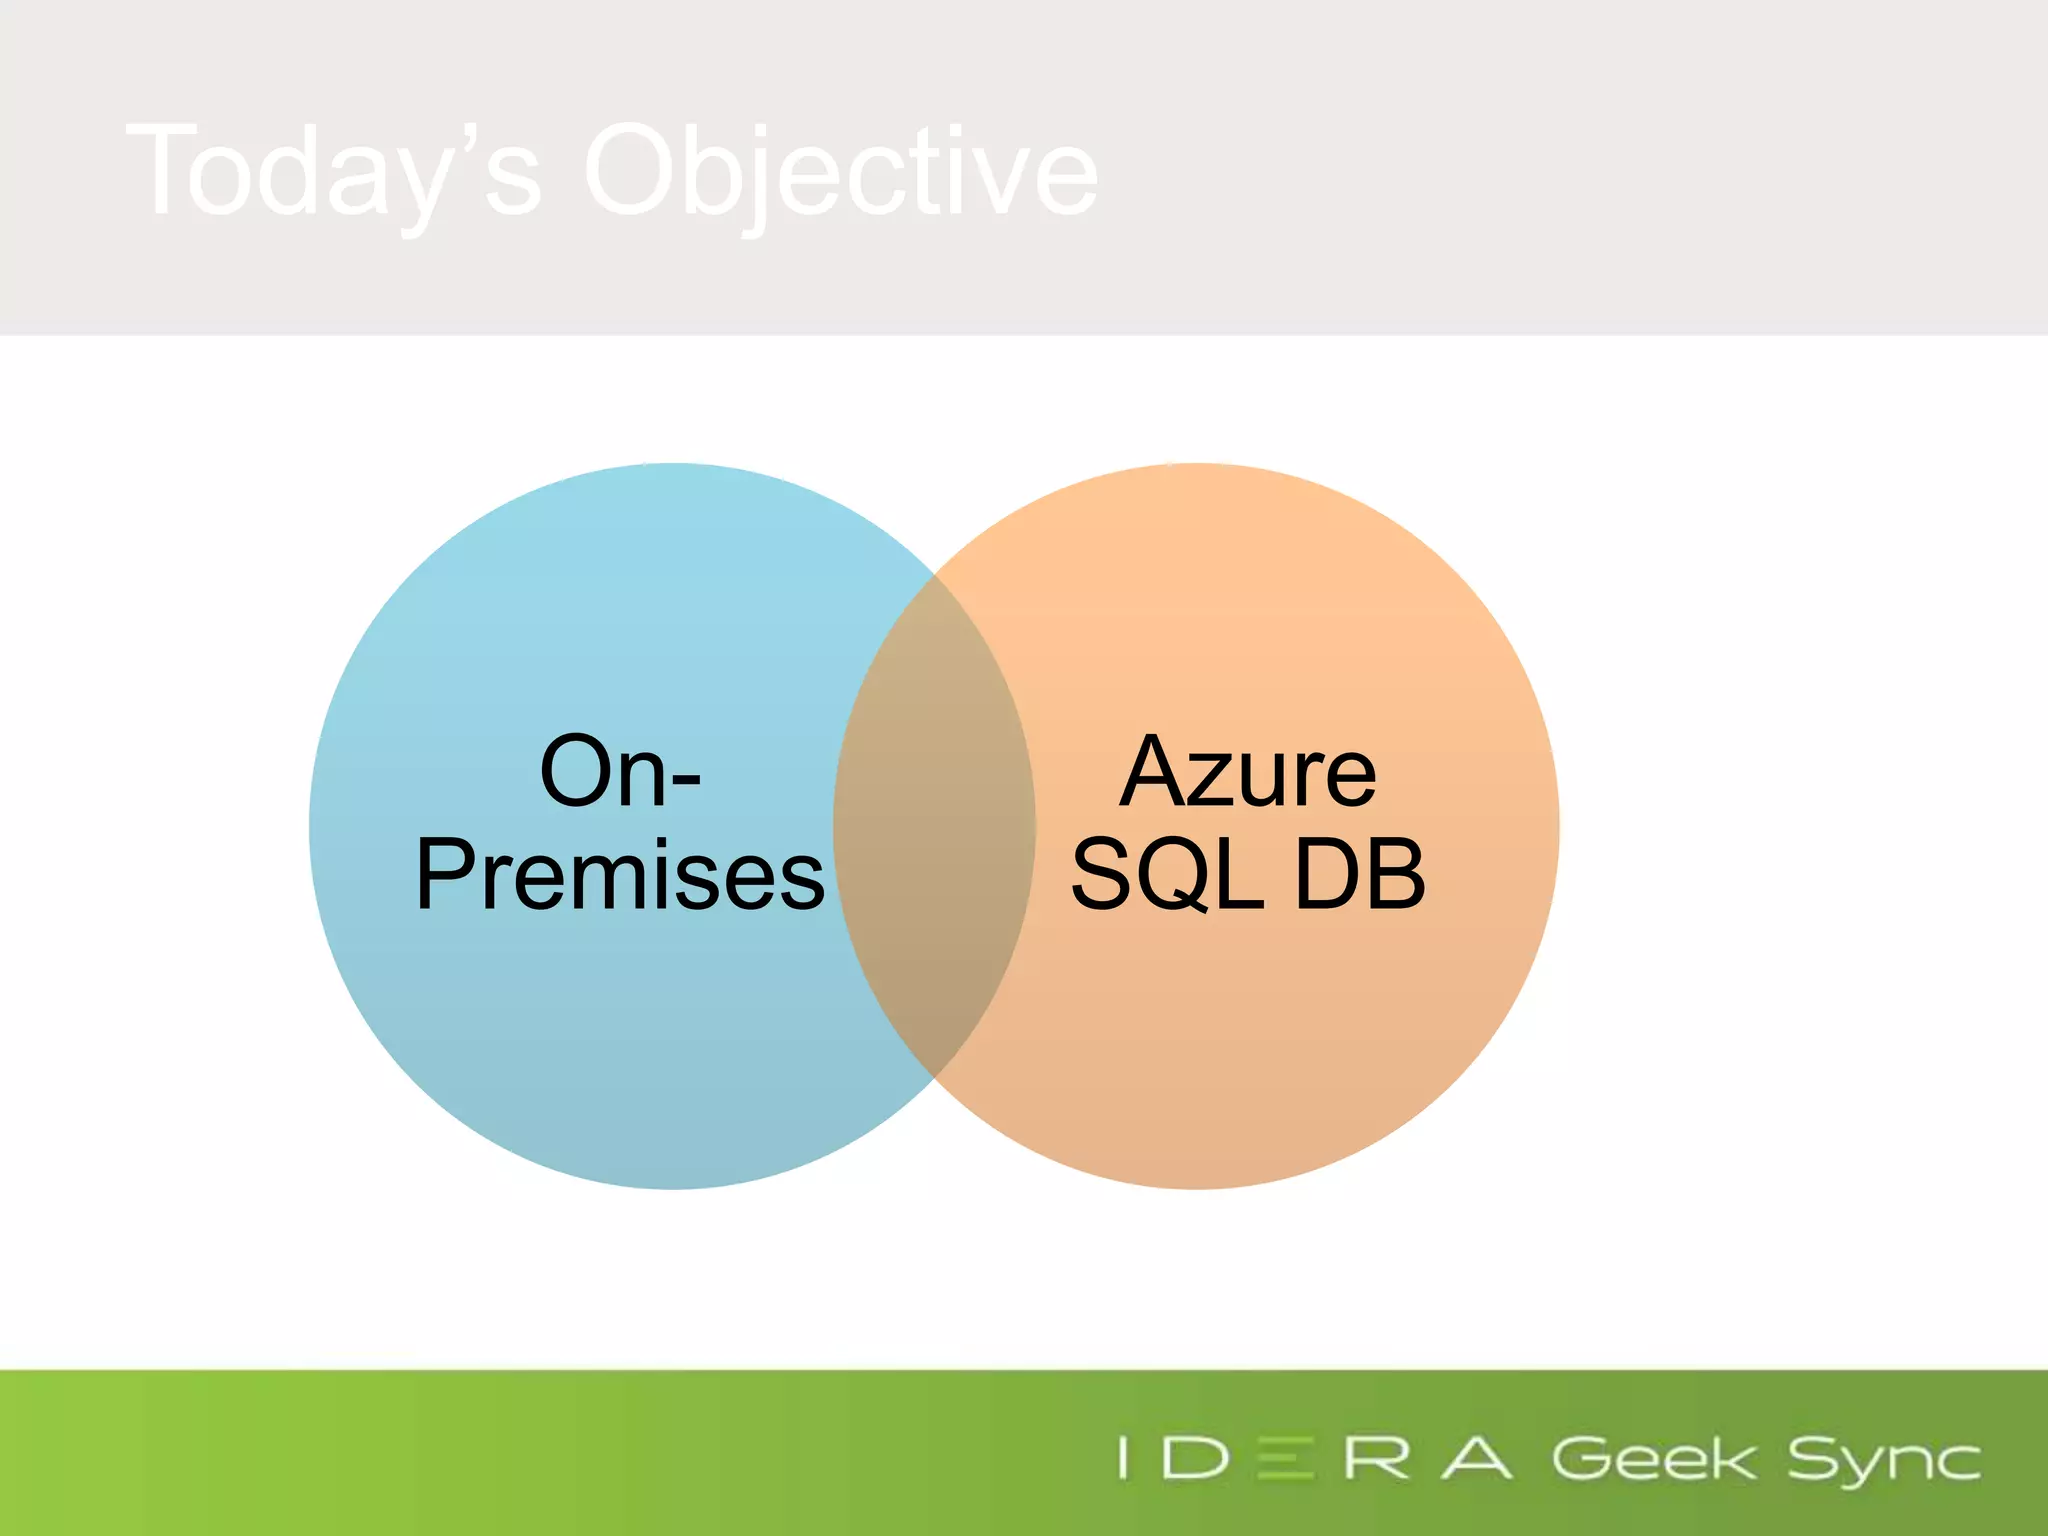
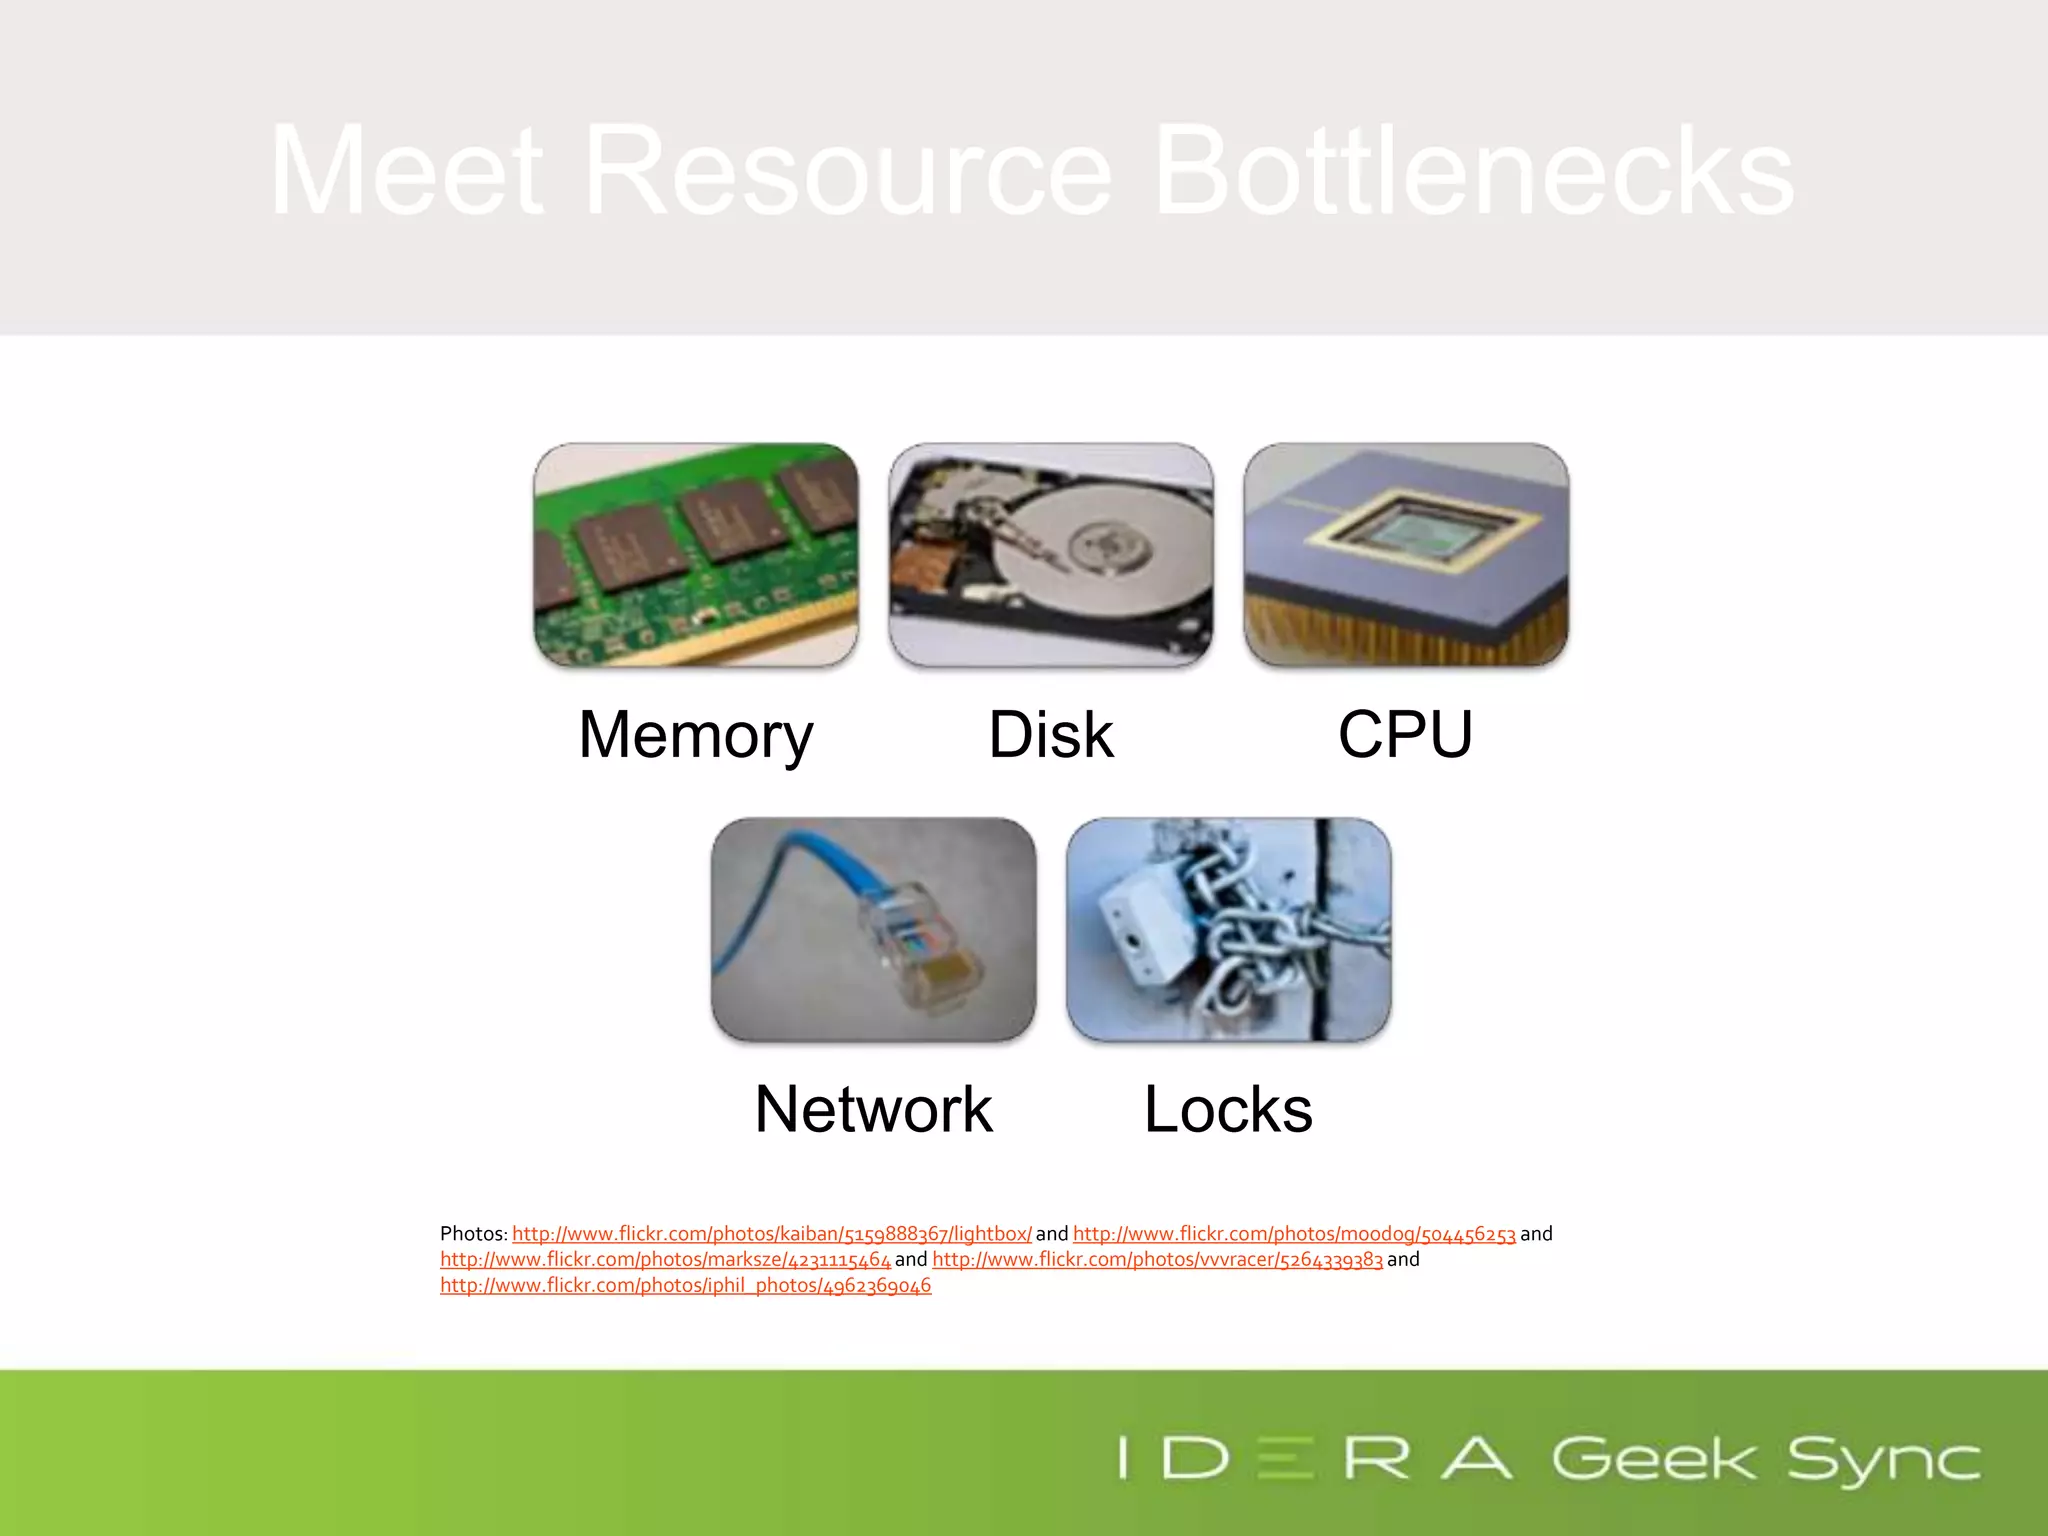
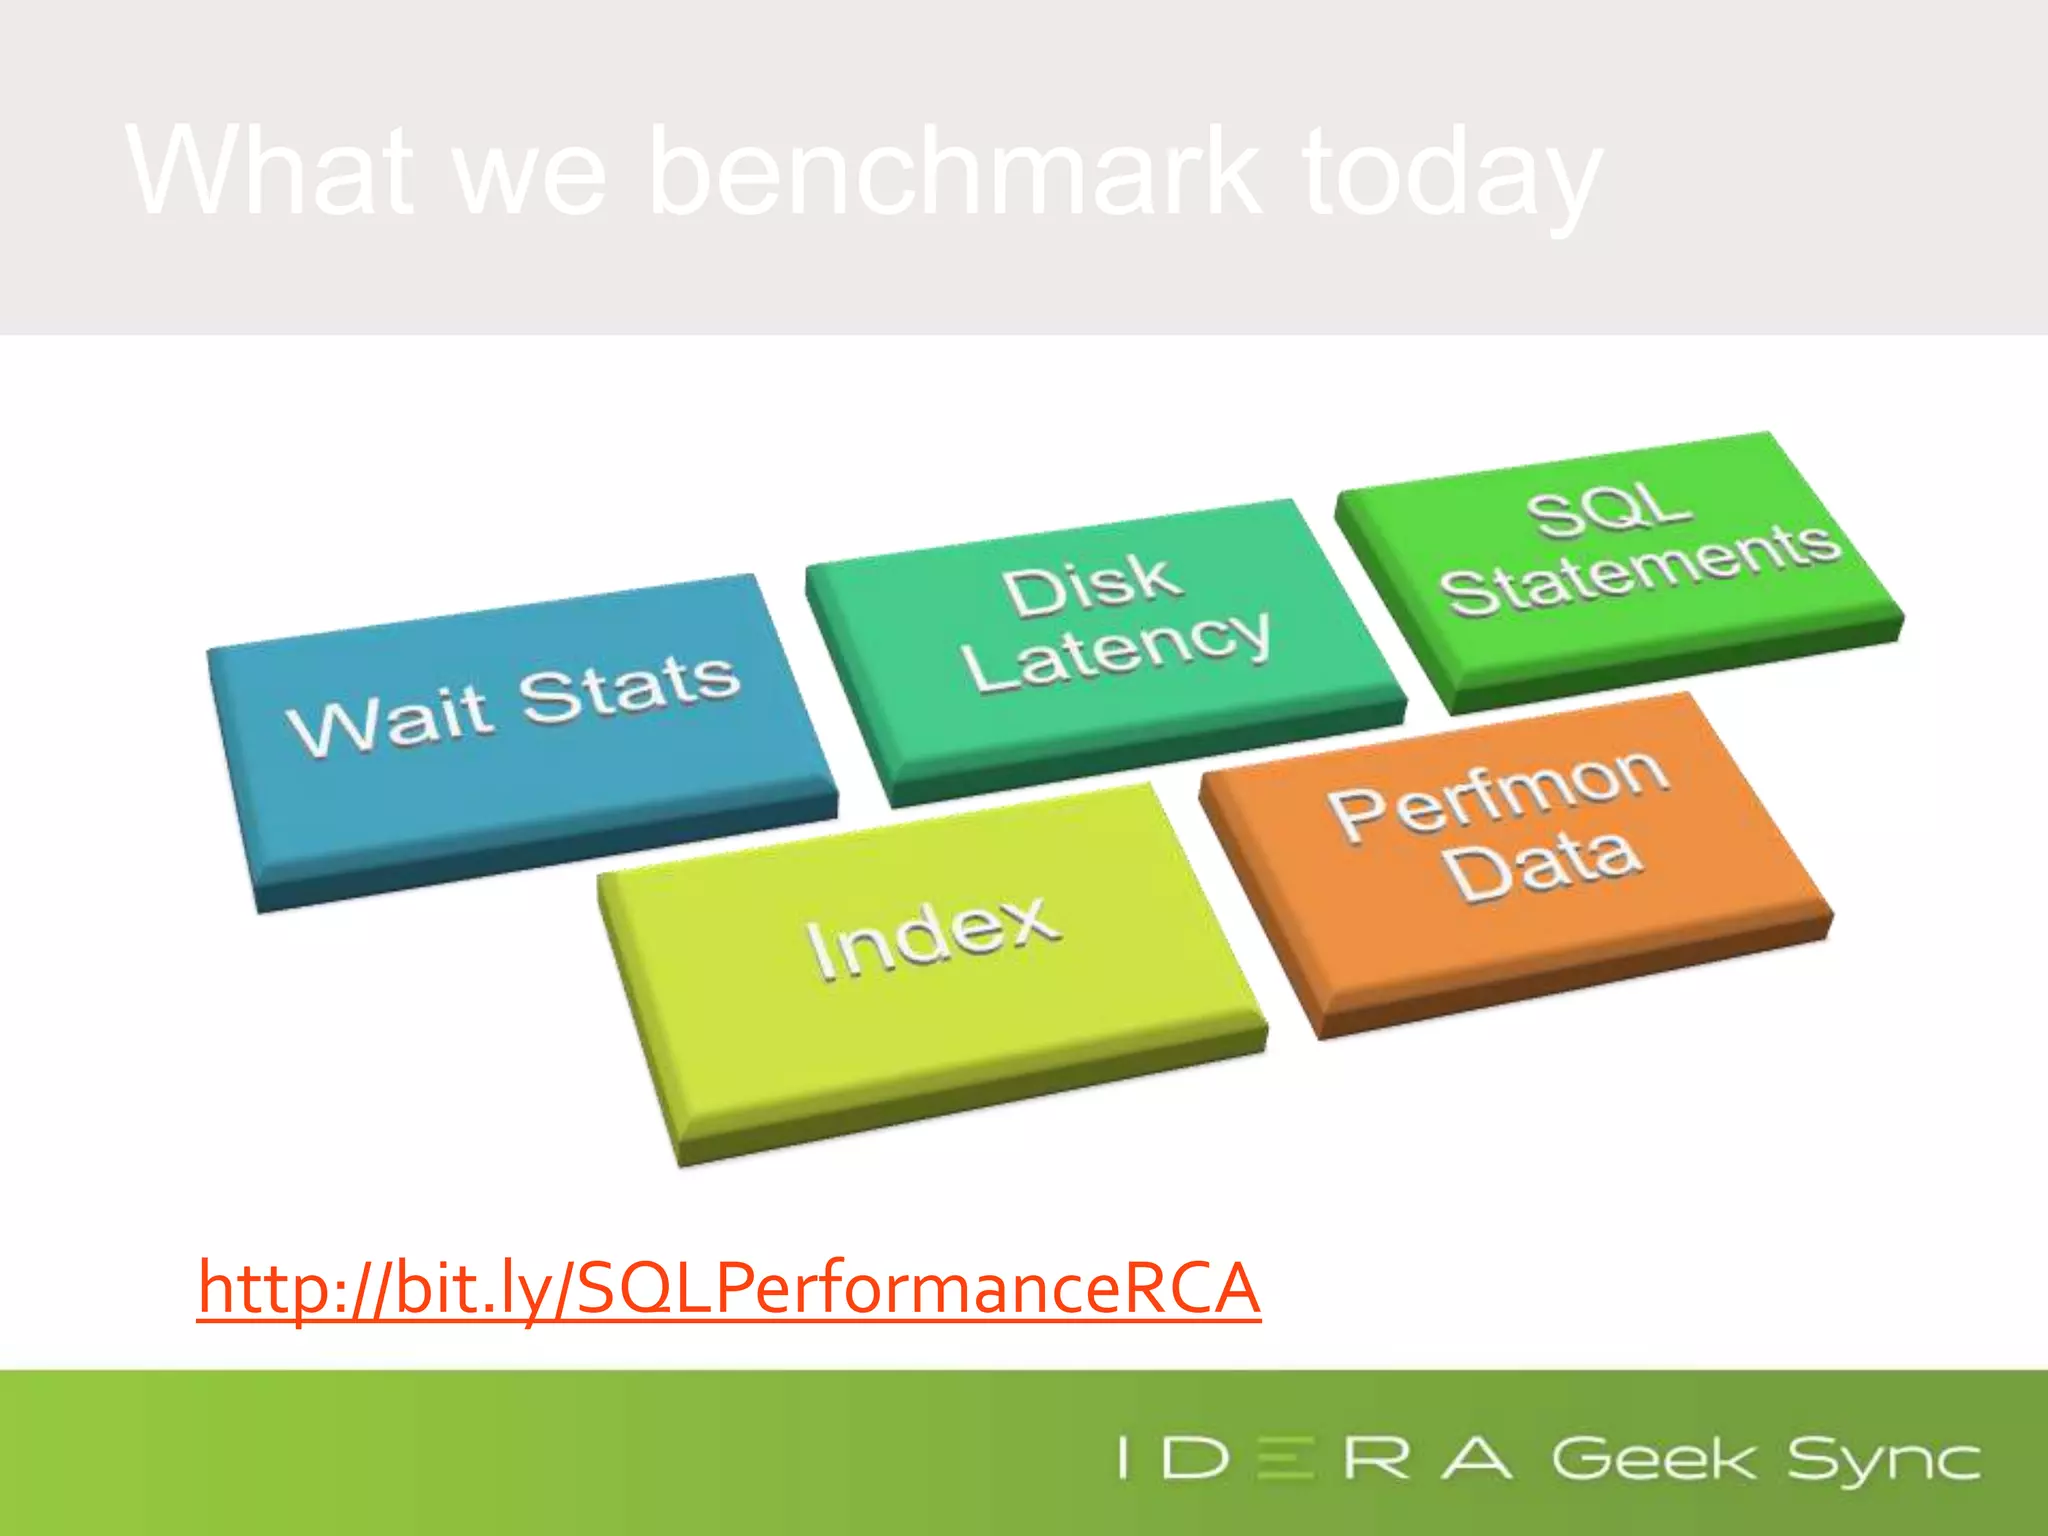
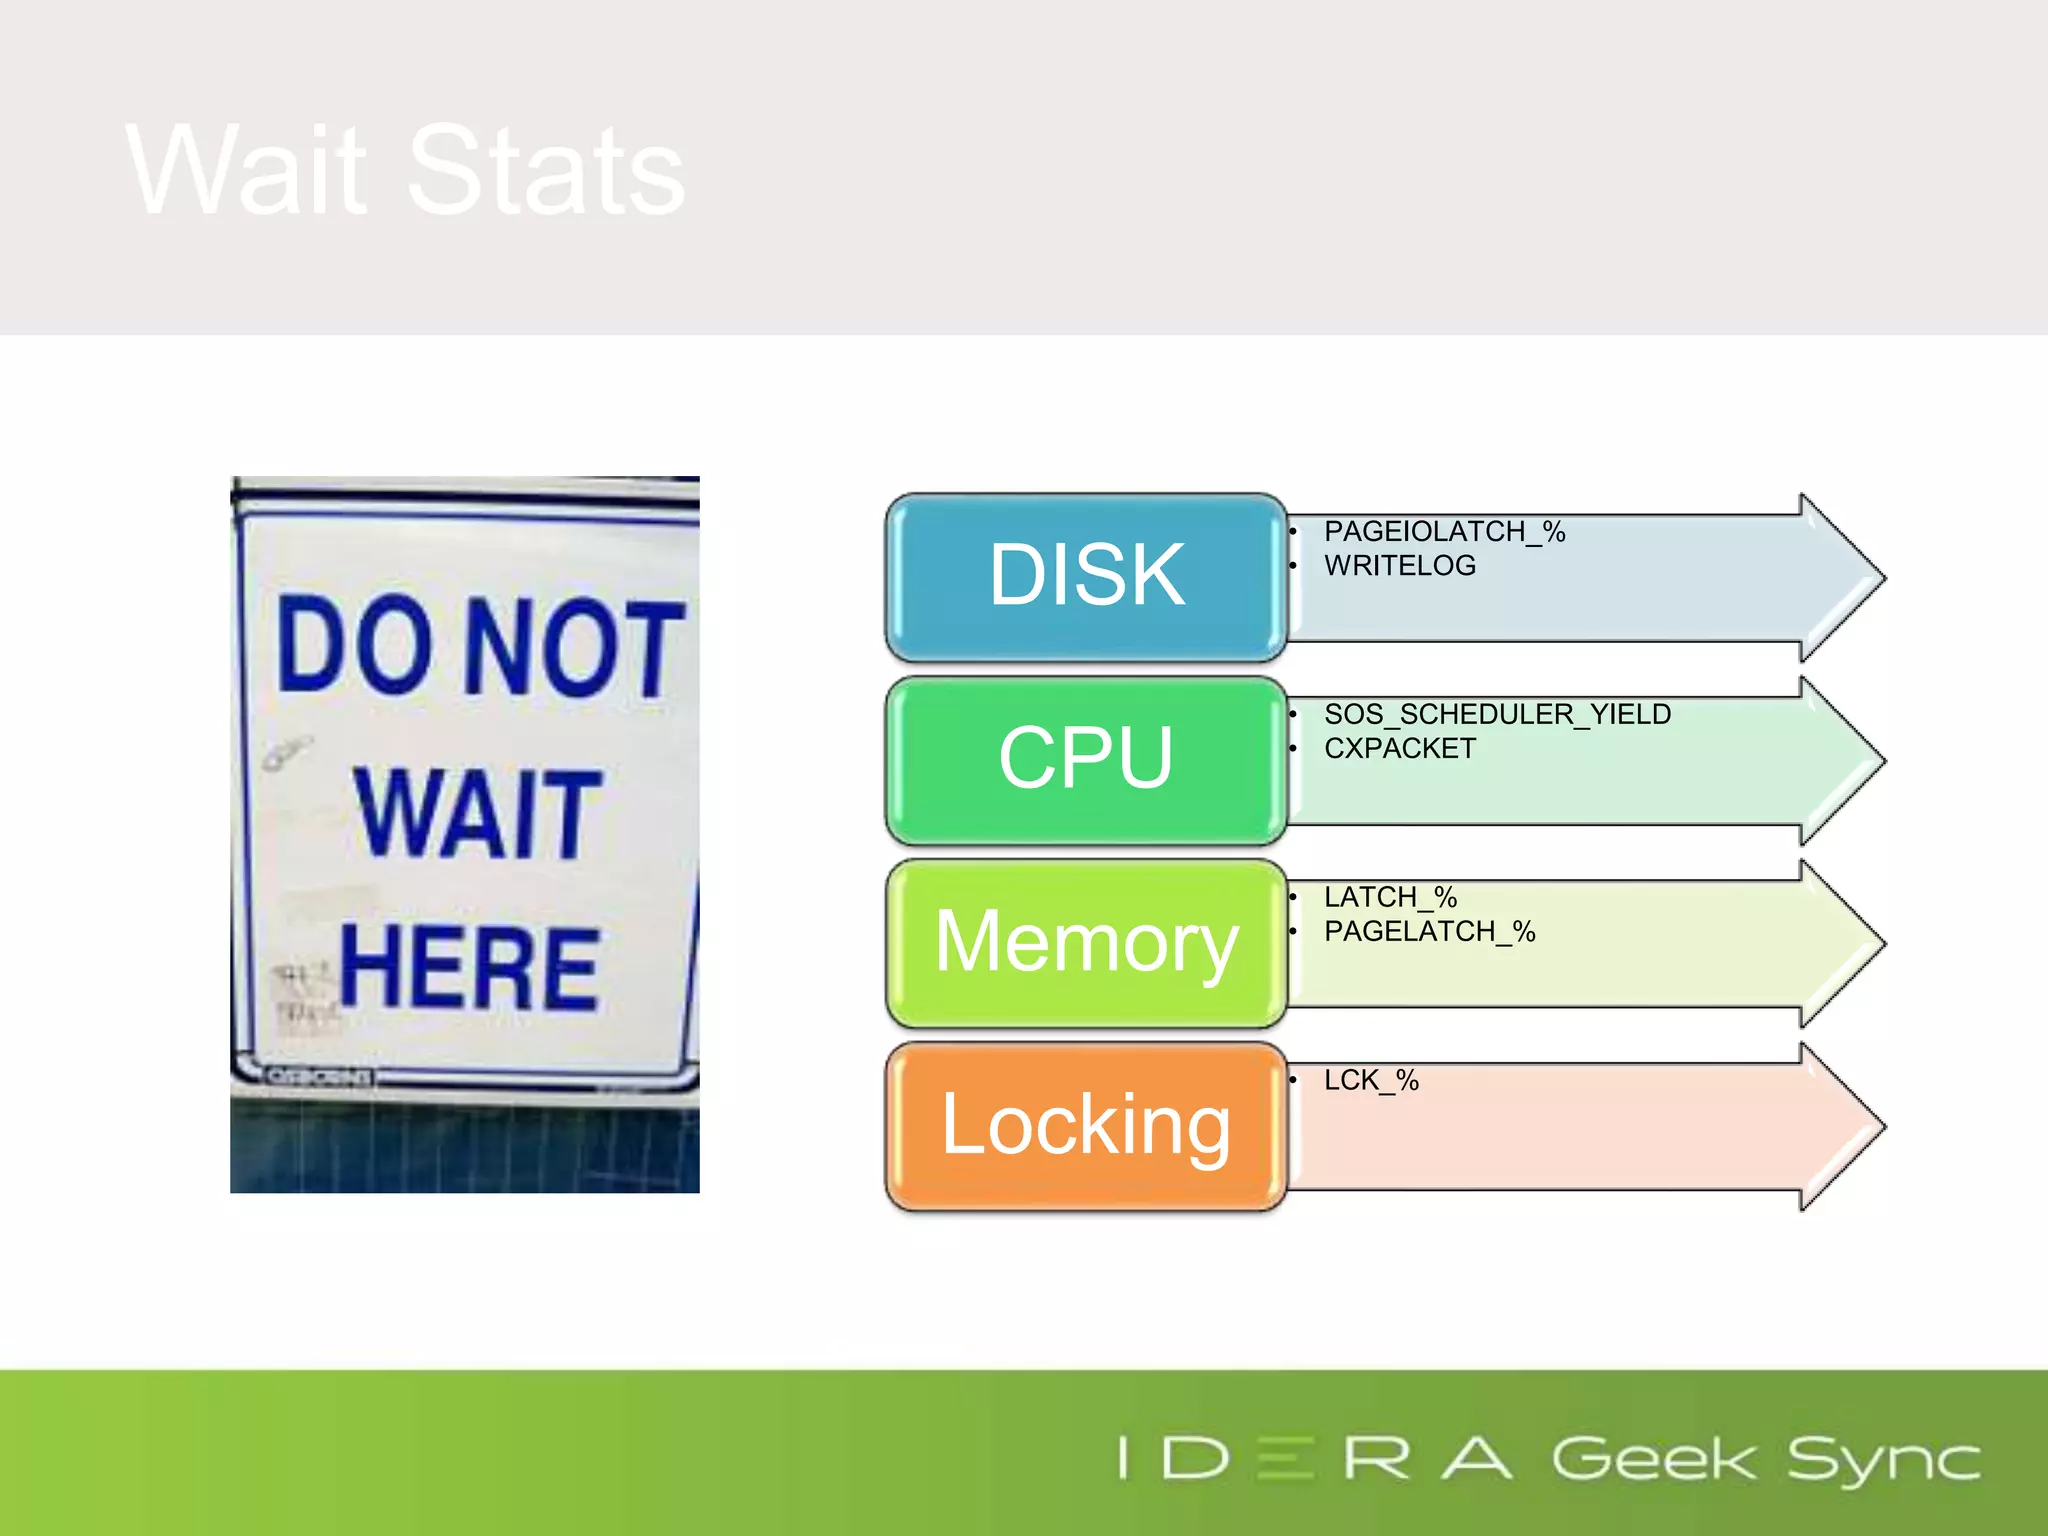
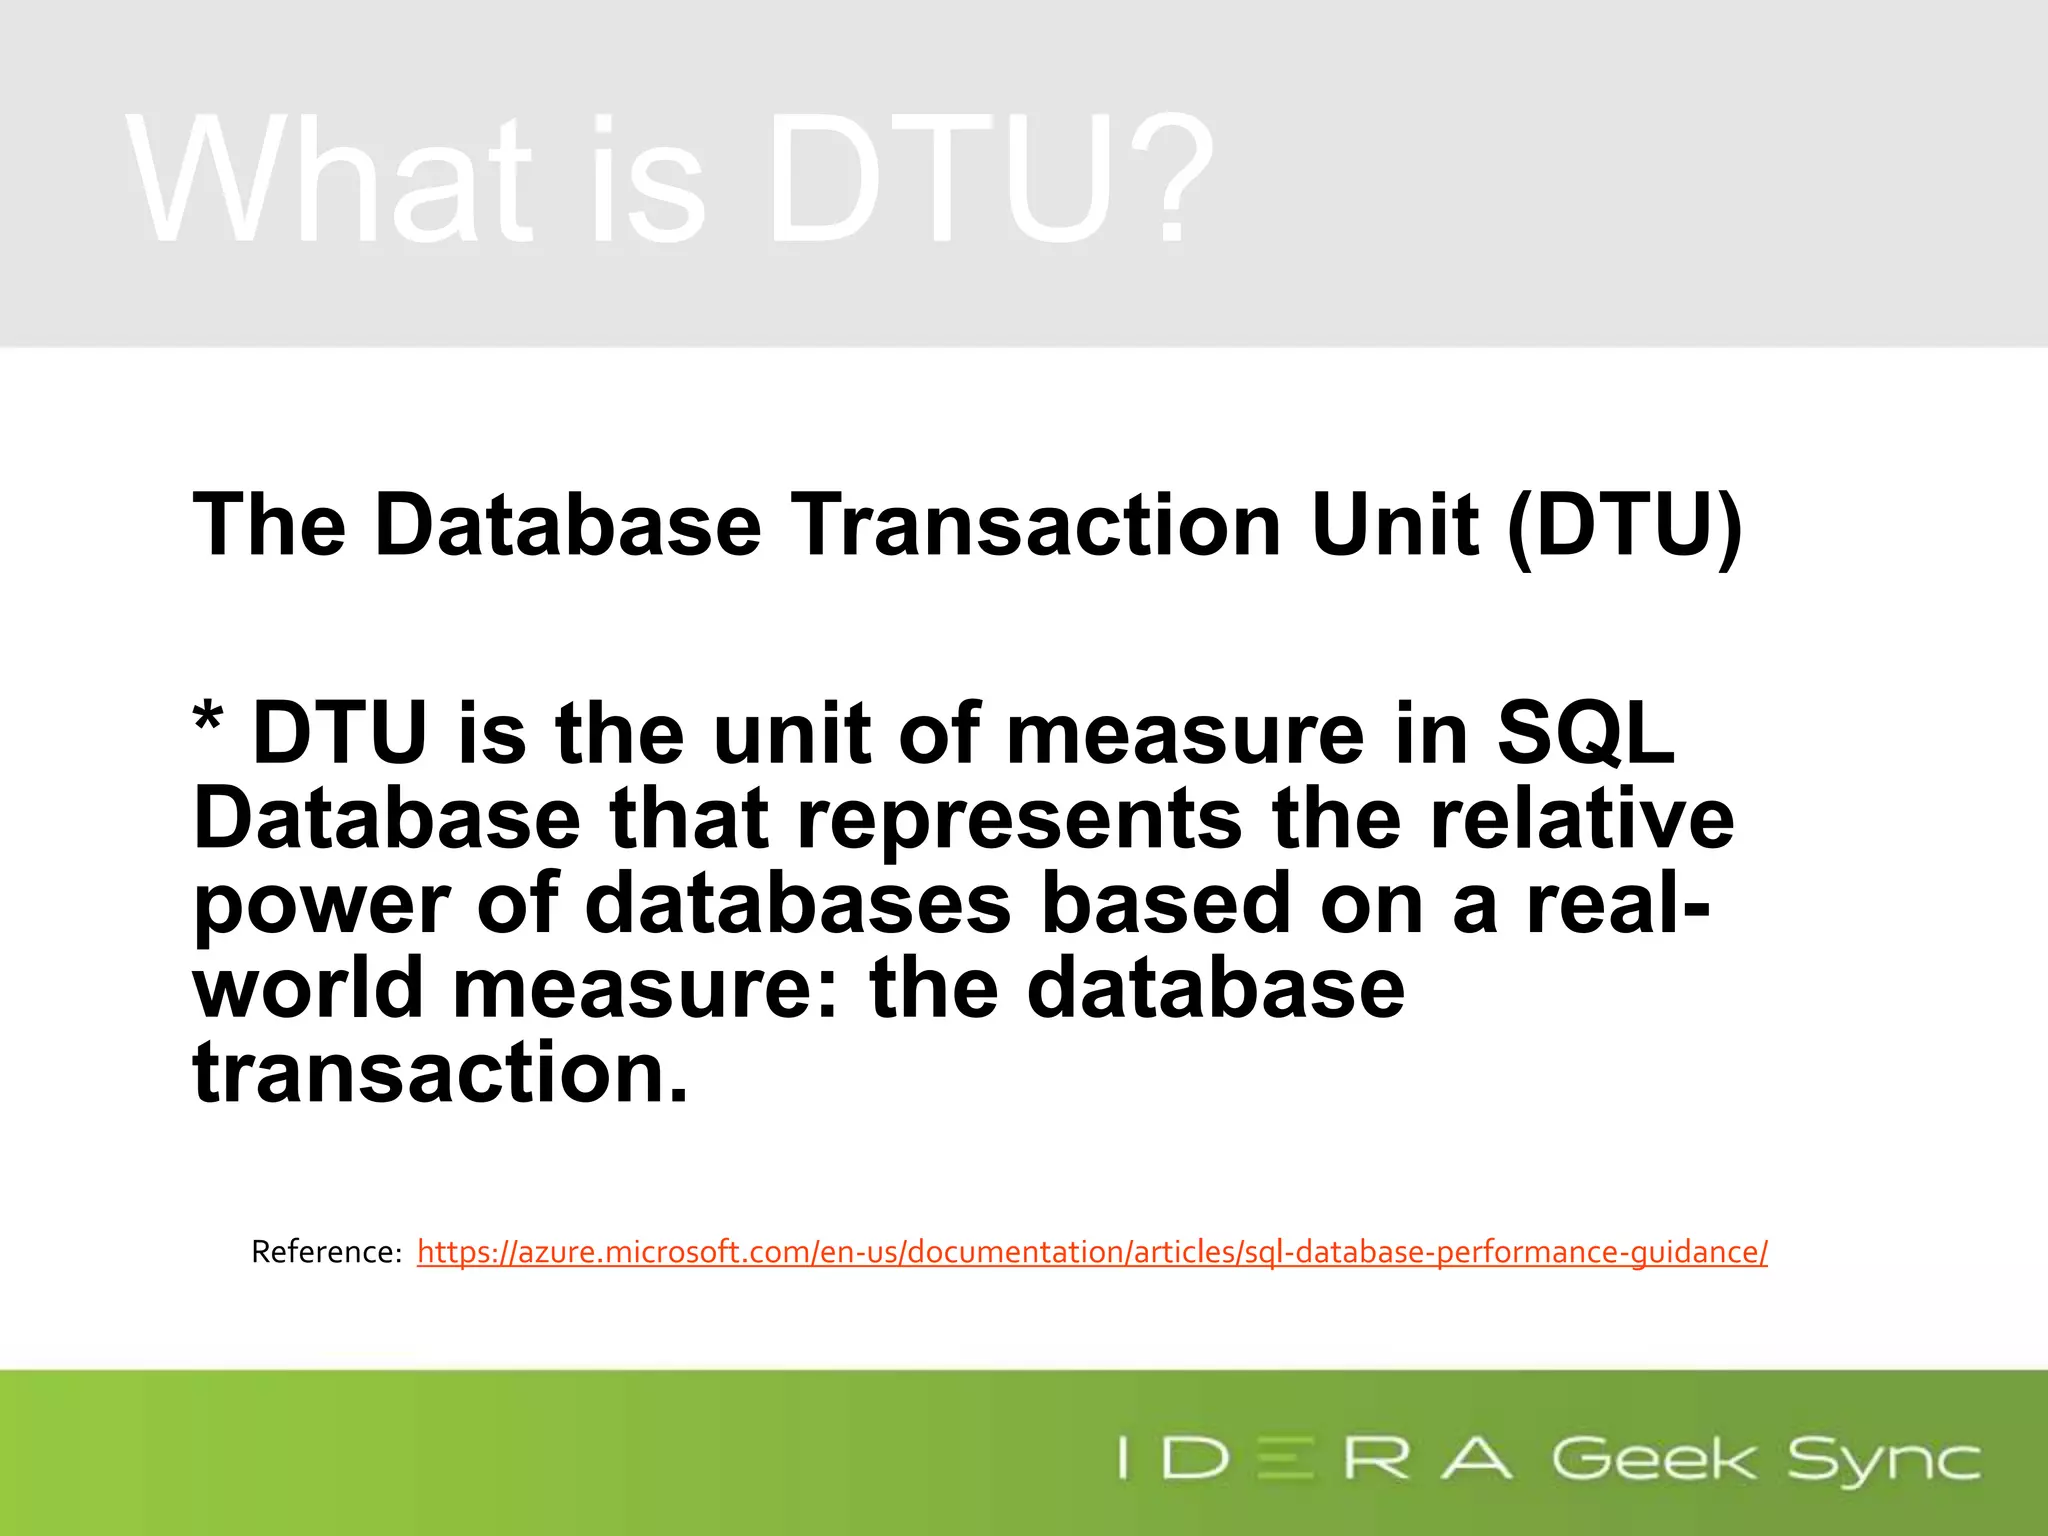
The document serves as an introduction to performance tuning for Azure SQL Database, focusing on identifying and resolving resource bottlenecks such as memory, CPU, and disk usage. It discusses the Database Transaction Unit (DTU) as a measure of database performance and provides various strategies for monitoring and improving performance, including tools like Query Store and DMVs. Additionally, it covers indexing, workload adjustments, and provides resources for further reference.