1. 1
Abstract
An investigation into the aerodynamics of an open-wheel racing car has been conducted using
computational fluid dynamics (CFD) to visualize the complex flowfield generated by this type of
vehicle. The baseline model was a single-seater hill-climb car, which had been designed and wind
tunnel tested at the RJ Mitchell wind tunnel in Southampton University by the 2010 MEng GDP
project.Inthe presentwork,steadyRANSformulationswere employedtoassessthe performance of
the major componentsof the car withthe intentionof usingbasicaerodynamicanddesignprinciples
to improve the overall aerodynamiccharacteristicsof the vehicle.First, an extensive CFD analysis of
the baseline car, including domain and mesh dependency studies was performed to obtain
component-wisenumerical resultsforthe liftanddrag.Thisanalysisrevealedsignificantdeficiencies
inthe designof the sidepoduppersurface andthe car underbody.These deficits were addressed by
redesigningthe carusinga commercial CADpackage inthree separate optimisation cycles. A total of
42 full carswere simulated. The design was done in accordance with the flow physics observed via
pressure,velocityandvorticitycontours,Q-criterionandcoefficients of pressure. The main areas of
improvement included the front wing through the redesign of a complete new endplate, the
underbodyof the car by creatingtwodistinctchannels that separated the sidepod underbody from
the diffuser, which has been redesigned to be a double expansion diffuser. As a result of a precise
designchoice,the wingsremainedunchangedthroughoutthe entire process.Inadditiontothis, two
optimisationcycleswereconductedusingaKrigingalgorithmwithtwovariablesinthe frontand rear
sectionsof the car. The optimisationinthe frontsectionemployedthe gapandoverlap between the
wheel and the front wing while the optimisation in the rear section used the throat and the exit
angle of the diffuser.Bothcyclesyieldedimprovedresultswiththe final carbeingthe outcome of the
secondoptimisationprocess.Final valuesforthe carresultin a downforce coefficient of 2.94, a drag
coefficientof 0.85,resultinginanefficiencyof 3.46. These values show an increase in downforce of
30%, a reductionindragof 2% andan efficiencyincreaseof 33% withrespectthe baseline car. These
improvements show the key importance the interaction between the wheel and the front wing as
well as the diffuser performance play in race
2. 2
Acknowledgments
The 2012-13 MSc in Race Car Aerodynamics Team wants to thank for the contribution of the
following people to the current work without whom the achievements of the current project
wouldn’t be so far reaching.
To Prof. Richard Sandberg, the project supervisor, for the guidance throughout the project
To CD-Adapcocompanyinthe personof KonstantinosKaratonisandMaxwell Star forthe STAR-CCM+
training provided to the team members
To Prof.Neil W.Bressloff,the secondsupervisor,forthe reamarksandorientationinthe optimization
of the car.
To Mr. Manan Thakkar, as a member of the 2011-12 Class of MSc in Race Car Aerodynamics, for
helping us to get started in several areas and for all the day to day help and incentive.
3. 3
Table of Contents
Abstract.......................................................................................................................................1
Acknowledgments........................................................................................................................ 2
Table of Contents ......................................................................................................................... 3
Nomenclature.............................................................................................................................. 7
List of Figures............................................................................................................................... 8
List of Tables .............................................................................................................................. 12
1. Introduction........................................................................................................................ 13
1.1. Objectives ................................................................................................................... 15
1.2. Assumptions................................................................................................................ 16
1.2.1. CAD related assumptions...................................................................................... 16
1.2.2. CFD related assumptions....................................................................................... 17
1.2.3. Turbulence modelling........................................................................................... 18
1.3. Management and Project Fundamentals....................................................................... 20
1.3.1. Methodology........................................................................................................ 21
2. Bibliographical Review......................................................................................................... 26
2.1. Previous Years Reports................................................................................................. 26
2.1.1. MSc in Race Car Aerodynamics GDP Report 2010-11 .............................................. 26
2.1.2. MSc in Race Car Aerodynamics GDP Report 2011-12 .............................................. 31
2.2. Race Car Aerodynamics Research ................................................................................. 39
2.2.1. Ground Effect Aerodynamics of Race Cars.............................................................. 39
2.2.2. Race Car Aerodynamics: Designing For Speed......................................................... 41
2.2.3. Aerodynamics of the complete vehicle................................................................... 44
2.2.4. Race Car Wings..................................................................................................... 47
2.3. Wing Research............................................................................................................. 50
2.3.1. Ali Wings.............................................................................................................. 51
2.3.2. High Lift Aerodynamics ......................................................................................... 52
4. 4
2.3.3. High-Lift Low Reynolds Number Airfoil Design........................................................ 56
2.3.4. Design of High Lift Airfoils for Low Aspect Ratio Wings with Endplates..................... 57
2.3.5. Design of Subsonic Airfoils for High Lift.................................................................. 60
2.3.6. Numerical Optimization of Airfoils in Low Reynolds Number Flows.......................... 63
2.4. Diffuser Research......................................................................................................... 64
2.4.1. Aerodynamic Interactions..................................................................................... 67
3. First Semester Work............................................................................................................ 71
3.1. Objectives ................................................................................................................... 71
3.2. Baseline Car Front Wing............................................................................................... 71
3.2.1. Introduction......................................................................................................... 71
3.2.2. Approach............................................................................................................. 73
3.2.3. Results................................................................................................................. 74
3.3. Baseline Car Wheel...................................................................................................... 78
3.4. Baseline Car Simulations .............................................................................................. 84
3.4.1. Geometry and Domain.......................................................................................... 84
3.4.2. Wall y+
Approach.................................................................................................. 90
3.4.3. Boundary Conditions ............................................................................................ 91
3.4.4. Dependency Tests ................................................................................................ 93
3.4.5. Other Physics Conditions....................................................................................... 95
3.4.6. Numerical Results................................................................................................. 96
3.4.7. Post Processing Baseline Car................................................................................. 98
4. Second Semester Work.......................................................................................................112
4.1. Airfoil Study................................................................................................................112
4.2. Wing Study.................................................................................................................116
4.3. Meshing Settings........................................................................................................123
4.4. First Design Cycle – IterationA.....................................................................................129
4.4.1. A01 Car Introduction............................................................................................129
5. 5
4.4.2. A01 Car Conclusion..............................................................................................131
4.4.3. A02 Car Introduction............................................................................................132
4.4.4. A02 Conclusion....................................................................................................136
4.4.5. A03 Car Introduction............................................................................................137
4.4.6. Analysis and Discussion of Results of the A03 Car ..................................................138
4.4.7. Post-processing of Results....................................................................................141
4.4.8. A03 Car Conclusion..............................................................................................146
4.5. Optimisation Methodology..........................................................................................147
4.5.1. Introduction........................................................................................................147
4.5.2. Optimisation Procedure.......................................................................................148
4.5.3. SamplingPlans ....................................................................................................149
4.5.4. Surrogate Model .................................................................................................149
4.5.5. Kriging................................................................................................................150
4.5.6. Infill Criteria........................................................................................................151
4.6. Second Design Cycle – B Iteration ................................................................................151
4.6.1. Optimisation Variables and Initial Sampling...........................................................151
4.6.2. Results................................................................................................................153
4.7. Third Design Cycle –C Iteration....................................................................................157
4.7.1. Optimisation Variables and Initial Sample .............................................................157
4.7.2. Results................................................................................................................159
4.7.3. Additional comments...........................................................................................163
4.8. FINAL CAR INTRODUCTION..........................................................................................163
4.8.1. Analysis and Discussion of Results (C07-Final DESIGN) ...........................................165
4.8.2. Post-processing of Results....................................................................................168
4.9. B and C Interaction Conclusion ....................................................................................176
5. Summary and Conclusions..................................................................................................178
6. Further Work .....................................................................................................................187
7. 7
Nomenclature
Cl Airfoil liftcoefficient
CL Wingliftcoefficient
AR Aspectratioof a wing
CFD Computational FluidDynamics
CAD ComputerAidedDesign
Cd Airfoil dragcoefficient
CD WingDrag Coefficient
y+ Nondimensionalheight
y1+ Nondimensionalheightof the firstcell close tothe wall
h Ride height
ρ Airdensity
Re ReynoldsNumber
RANS Reynolds-AveragedNavier-Stokes
k-ω k-omegaturbulence model
k-ε k-epsilon turbulence model
c Wingchord
Q
V∞ Free-streamvelocity
Γ Circulation
Sij
Ωij
8. 8
List of Figures
Figure 1: Baseline car with coordinate system.............................................................................. 17
Figure 2: Sketch of the workflow adopted in the project. .............................................................. 22
Figure 3: Drag coefficient by component for 1st and 2nd iterations............................................... 31
Figure 4: Lift coefficient by component for 1st and 2nd iteration................................................... 31
Figure 5: Split of drag (left) and downforce (right) (ignoring sources of lift). ................................... 34
Figure 6: Underbody downforce dependence on diffuser edge thickness. ...................................... 35
Figure 7: Iteration history of force coefficients, efficiency and aerodynamic balance. ..................... 38
Figure 8: The use of the Gurney flap on the rear wing andendplates of a race car. ......................... 44
Figure 9: The effect of the height of the side skirt on the body downforce generation. ................... 45
Figure 10: The use of a flatplate nearthe highpressure regiontogenerate extradownforce (left)
and Channellingthe flow fromthe frontwingtothe rearof the wheel canbe usedto reduce wheels
drag (right)................................................................................................................................. 46
Figure 11: Different wing configurations tested in an openwheeled race car. ................................ 48
Figure 12: The effect of number of rear wing on lift and aerodynamic efficiency. ........................... 49
Figure 13: The losson the downforce of the central part of the frontal wingdue to the nose and
different nose arrangements....................................................................................................... 50
Figure 14: Canonical Pressure Distribution from A.M.O Smith. ...................................................... 54
Figure 15: Change of the incidence velocityvector angle due to downwash. .................................. 58
Figure 16: (Left) airfoilgeneratedwiththe conventional methodology.(Right)airfoilgeneratedwith
the new methodology................................................................................................................. 58
Figure 17: Variationof the angle of the winginside the regulationsbox andrespectivevelocity
distribution and CL for each case................................................................................................. 59
Figure 18: Variation of the flap to main chord ratio, velocity distribution and CL foreach case........ 59
Figure 19: Variation of the gap, velocity distribution and CL for each case...................................... 60
Figure 20: Optimumvelocitydistributionoveranairfoil andmodificationstomake the airfoil
feasible...................................................................................................................................... 61
Figure 21: examplesof single andmulti-elementairfoilsanditsCpdistributionplottedinside a
maximum possible Cp box........................................................................................................... 63
Figure 22: Pressure coefficientfordiffusermid-plane,experimental andLESresults.From:
(PuglisevichS.,Page G., Large eddysimulationof the flow aroundadiffuser-equippedbluff bodyin
ground effect, J. Automobile, Proceedings of the ASME 2011 International................................... 65
Figure 23: Influenceof diffuserangle onliftcoefficient,differentride heights.(From:Ruhrmann,A.
and Zhang,X. Influenceof diffuserangle onabluff bodyingroundeffect.Trans.ASME,J. FluidsEng,
2003, 125(2), 332–338). .............................................................................................................. 67
Figure 24: Liftcoefficientforthe frontwing,inisolation(red) andwiththe wheel (grey).Hysteresis
effect shown. ............................................................................................................................. 69
Figure 25: Drag coefficient for the wheel, different overlap........................................................... 70
Figure 26: Geometry of the testedwing....................................................................................... 73
Figure 27: Approach for the front wing test.................................................................................. 74
Figure 28: Domain size study....................................................................................................... 75
Figure 29: Wall y+ distribution for the frontwing with no prism layer............................................ 76
Figure 30: Side view of the mesh for the frontwing...................................................................... 76
9. 9
Figure 31: Results for the front wing with prism layer................................................................... 77
Figure 32: Comparison of results for meshes with and without prism layer. ................................... 78
Figure 33: Example of a trimmer mesh for the wheel.................................................................... 81
Figure 34: Pressure countours around the wheel compared with Axon (above).............................. 83
Figure 35: Tangential velocityvectors compared with Saddington’s theory (above). ....................... 84
Figure 36: The model after import into STAR-CCM+...................................................................... 85
Figure 37: The car after splitting it into different parts (Upper side)............................................... 86
Figure 38: The car after splitting it into different parts (Lower side)............................................... 86
Figure 39: The computational domain after Subtract operation..................................................... 87
Figure 40: The Computational Domain showing some of the volumetric controls. .......................... 89
Figure 41: Mesh detail in the front wing....................................................................................... 89
Figure 42: Mesh at the near area of the car.................................................................................. 90
Figure 43: The wall y+ distribution around the car. ....................................................................... 91
Figure 44: Variation of CL and CD with number of elementsin the mesh........................................ 93
Figure 45: Residuals after 4000 Iterations .................................................................................... 96
Figure 46: Component Wise CL Split up for 2011 and 2012 baseline cars........................................ 97
Figure 47: Component wise split up for CD................................................................................... 98
Figure 48: Tri-dimensional views of the Baseline Car..................................................................... 99
Figure 49: Comparison between Baseline car and the Benetton B190. ..........................................101
Figure 50: Downforce Breakdown for Each Component of Baseline Car. .......................................102
Figure 51: Drag breakdown for Baseline Car................................................................................103
Figure 52: Mid-Plane Coefficientof PressureforBaselinecar(top),Middle section(topcentre),Rear
section (bottom centre) Sidepod Coefficient of Pressure (bottom). ..............................................105
Figure 53: SidepodVelocity for Baseline......................................................................................105
Figure 54: Streamlines for Baseline:from the top (top image) and from the bottom......................107
Figure 55: Streamlines for Baseline:Particular of the Venturi contraction zone. ............................107
Figure 56: Streamlines for Baseline:Particular of the helmet........................................................107
Figure 57: Vorticity and Velocity Vectors for the wake of the rear wheel (x=1.54)..........................108
Figure 58: Q-criterionColoredbyVorticityinStream-wise DirectionforLowerSurface of the Car
(top) and Isometric View (bottom) – Q = 10,000. .........................................................................110
Figure 59: Q-criterionColoredbyVorticityinStream-wise DirectionforLowerSurface of the Car
(top) and Isometric View (bottom) – Q = 200,000. .......................................................................110
Figure 60: Maximum Coefficient of Lift versus camber.................................................................114
Figure 61: Coefficient of Lift against Angle of Attack. ...................................................................115
Figure 62: Pressure Coefficient of Different Wings Tested in CFD..................................................120
Figure 63: Wake Survey Velocity Profiles for the Wings................................................................120
Figure 64: Contoursof Velocity onStreamwise DirectionforBaseline Wing(top),Firstwing(center)
and Second Wing(bottom).........................................................................................................122
Figure 65: Skin Friction Coefficientfor the Wing Configurations....................................................123
Figure 66: Wing-endplate prism layersinteraction.......................................................................125
Figure 67: flowincidence angle (9 cm upstream of main element leadingedge). ...........................126
Figure 68: FrontWingsimulatedboundarylayers(fromtoptobottom:baseline,new setupwith10
points in gap, new setup with 5 pointsin gap).............................................................................127
Figure 69: RearWing simulatedboundarylayers(fromtoptobottom:baseline,new setupwith10
points in gap, new setup with 5 pointsin gap).............................................................................128
10. 10
Figure 70: Flow incidence angle with 5 pointsin gap (left) and 10 points in gap (right)...................128
Figure 71: Tri-dimensional views of the A01 Car. .........................................................................130
Figure 72: The nosecone of A01, with the ideal channel created by repositioning the struts...........131
Figure 73: Nosecone anddiffuserforA01.Highlightedinred,the contraction-expansionzone
createdin the central part of the underbody...............................................................................131
Figure 74: Middle sectionof the A01,colouredinblue.Highlightedingreen,the windshield.The
splitter is circled in black............................................................................................................131
Figure 75: Tri-dimensional views of the A02-1 car........................................................................133
Figure 76: Viewsof the endplate:onthe left,the channel ishighlightedinred.Inthe middle,a
sectionof the endplate showingthe rampispresented.Onthe right,the rampiscircledinblue,and
the particular shape of the endplate at the edgesis circledin green.............................................134
Figure 77: SidepodsforA02cars. Highlighted:inredthe sideplate,inorange the sidepodinlet,in
blue the ramp. In the bottom figure, the aerofoil-like shape can be appreciated...........................135
Figure 78: Isometric view of the A02-3 car...................................................................................135
Figure 79: Middle sectionof the A02 cars, colouredinblue.Highlightedingreen,the new
windshield. In the red oval, the prolonged engine cover and the new diffuser can be seen. ...........136
Figure 80: Newrearwingendplates(A02),withlouvres(blue) andcutson the upperedge toreduce
drag (red)..................................................................................................................................136
Figure 81: Nosecone anddiffuserforA03.Highlightedinred,the improvedcontraction-expansion
zone created in the underbody.......................................................... Error! Bookmark not defined.
Figure 82: Bargeboards for A02-1 (left) and A02-3 (right).............................................................136
Figure 83: Tri-dimensional views of the A03 Car. .........................................................................137
Figure 84: Particular of the windshield and the engine cover........................................................138
Figure 85: Downforce Breakdown for Each Component of A03 and Comparison with A02-3...........140
Figure 86: Drag Breakdown for A03. ...........................................................................................140
Figure 87: Mid-Plane Coefficientof PressureforA03 Frontsection(top) andRear section(centre).
Sidepod Coefficient of Pressure (bottom)....................................................................................142
Figure 88: Streamlines for A03: from the top (topimage) and from the bottom. ...........................143
Figure 89: Velocity vectors and contours at sidepod inlet.............................................................143
Figure 90: VorticityandVelocityVectorsforthe wake of the front(top,x=0.48) and rear (bottom,
x=1.54) wheel............................................................................................................................144
Figure 91: Skin Frictionfor A03...................................................................................................144
Figure 92: Q-criterionColoredbyVorticityinStream-wise DirectionforLowerSurface of the Car
(top) and Isometric View (bottom) – Q = 10,000. .........................................................................145
Figure 93: Turbulent Kinetic Energy for A03, x=1.24.....................................................................146
Figure 94: Turbulent Kinetic Energy for A03, x=1.54.....................................................................146
Figure 95: Optimisation process..................................................................................................148
Figure 96: Krigingpredictionforthe Braninfunctionwith20 sample points(left) comparedwiththe
true Branin function (right).........................................................................................................150
Figure 97: Gap and Overlap between the front wing andwheel....................................................152
Figure 98: Initial sample for iteration B. ......................................................................................153
Figure 99: Surrogate model prediction (20 samples). ...................................................................154
Figure 100: Surrogate model prediction (20 samples + 3 updates)................................................154
Figure 101: Surrogate model prediction (20 samples + 4 updates)................................................155
Figure 102: Width of throat and diffuser exit...............................................................................158
11. 11
Figure 103: Initial sample for iteration C......................................................................................159
Figure 104: Surrogate model prediction (11 samples). .................................................................160
Figure 105: Surrogate model prediction (11 samples + 3 updates)................................................160
Figure 106: surrogate model prediction for drag (Iteration B left, Iteration C right)........................163
Figure 107: Tri-dimensional views of the Final car........................................................................164
Figure 108: Downforce BreakdownforEachComponentof C07 andComparisonwithother
iterations. .................................................................................................................................166
Figure 109: Drag Breakdown for C07...........................................................................................168
Figure 110: Coefficientof PressureforC07, fromtop to bottom:mid-plane,bottom, sidepod and
rear wheel, top..........................................................................................................................170
Figure 111: VorticityandVelocityVectorsforendplate (top,x=0.28),sidepod(middle,x=1.02),wake
of the rear wheel (bottom, x=1.54).............................................................................................171
Figure 112: Vorticityforrearsectionof the car (top),VorticityandVelocityVectorsfor rearendplate
(bottom). ..................................................................................................................................172
Figure 113: Wall-shear stress,x-component, for C07. ..................................................................172
Figure 114: Q-criterionColoredbyVorticityinStream-wiseDirectionforLowerSurface of the Car
(top) and Isometric View (bottom) – Q = 10,000. .........................................................................174
Figure 115: 2D Pressure Coefficient Plots for different components..............................................175
Figure 116: Design population plotted with lift on the abscissa and drag on the ordinates. ............176
Figure 117: Diagram of PreMeshPost.java...................................................................................198
Figure 118: A03 Car reversed flowfacesin engine intake (left) and sidepodinlet(right). ...............201
Figure 119: Streamlines aroundintakes A03................................................................................203
Figure 120: Streamlines aroundintakes A03-6.............................................................................204
Figure 121: streamlinesaroundengine covertoshow pressure recoveryinA03(top) and A03-6
(bottom). ..................................................................................................................................206
Figure 122: pressure distribution around sidepod at z = 0.1m.......................................................207
Figure 123: A03, A03-6 and A03-7 from topto bottom:streamlinesreleasedupstreamfromthe
sidepod inlet and wall shear stressin x-direction.........................................................................208
12. 12
List of Tables
Table 1: Aerodynamic coefficientselement-wise.......................................................................... 27
Table 2: Mesh dependency study................................................................................................. 32
Table 3: Physical Models............................................................................................................. 33
Table 4: Relevantexperimental data............................................................................................ 80
Table 5: Aerodynamic coefficients obtainedin simulations............................................................ 81
Table 6: Final mesh parameters................................................................................................... 90
Table 7: Boundary conditions and Settings used for the Simulations.............................................. 92
Table 8: Mesh Dependency tests................................................................................................. 94
Table 9: Domain Dependency Test............................................................................................... 95
Table 10: Rear wing CL showing the lift generated by the beam wing............................................. 97
Table 11: Comparison of CFD and Panel Method Results..............................................................116
Table 12: Wing Configurationsfor CFD study...............................................................................117
Table 13: Iteration B data and results..........................................................................................157
Table 14: Optimisation Evolution....................................................... Error! Bookmark not defined.
Table 15: Iteration C data and results..........................................................................................161
Table 16: Airfoil Database with Maximum Camber and Thickness Values......................................196
Table 17: Summary of the engine intake and sidepods inlet study iterations.................................202
Table 18: Lift coefficient by part comparison between A03, A03-6 and A03-7................................205
13. 13
1. Introduction
The well-known Merriam-Webster dictionary provides its readers with a definition of the
word engineering: “a field of study or activity concerned with modification or development in a
particulararea”. Thisprecise andconcise statementcould be further complemented by introducing
the Japanese word ‘Kaizen’, literally meaning “change for the better.” This word, which is often
translatedas “continuousimprovement”isperfecttoputintowordsthe conceptbehindengineering
and the purpose of the workpresentedinthisreport.Asamatter of fact, other prominent branches
of science,like mathematicsandphysics,oftenevolve as a result of leaps and bounds; engineering,
instead, is an unstoppable process of adding little pieces of knowledge to the bulk of what has
already been discovered. It is now manifest how significant, for an engineer, is the capability of
building upon what is present in order to improve. This involves both the knowledge required to
understandpreviousresults,andthe practical sense and ability to put something new on the table.
Often underrated, it is this second characteristic that is the hardest to acquire as experience and
maturityare veryimportantfactors shaping the abilities of professionals within this field. It can be
now seen how important it is to work on this aspect, and in this light, the possibility of having a
design project integrated in a Master's degree is invaluable.
This Group Design Project (GDP) provides students with an opportunity to tackle a real
engineeringproblemusingstate-of-the-artcomputational tools. It is the only annual-based module
of the MSc in Race Car Aerodynamics. During the 2012-2013 academic year, six students composed
the aforementioned MSc program and formed a single team that was proposed to undertake a
designprojectinasix-monthtimeframe.The main purpose of the GDP was to apply the knowledge
of the students in aerodynamics and combine team work to face a real engineering problem:
specifically, to improve the aerodynamics of a hill climb race car through detailed aerodynamic
design,bymeansof ComputationalFluidDynamics(CFD) simulations only. The primary objective of
the project was to improve the aerodynamic performance of a given baseline car, which was
developedbythe 2010 MEng GDP Team1
,bycarryingout a complete studyof the relevant flowfield
using CFD, and subsequently by introducing new design to improve the flow characteristics of the
major components of the car following a custom methodology that was devised for the project at
hand.To broadenthisperspective,however, a wider collection of detailed objectives is outlined in
the Objectivessectionof thisintroduction.Totackle this problem given its complexity, a number of
assumptionswere made,andtheyare listedandexplainedinthe assumptionssectionof this report.
It is now stressed that the group had freedom to choose the directions of the project, and in the
current 2012-2013 GDP work this led to a different methodology and project management with
respect to previous years groups. In the management section the pathway that was taken is
explained in more detail.
1 Howe, B., Leppan, W., Mulvaney, D., Owen, E., “Aerodynamic Development of a One Third Scale OpenWheel Racing Car
Model”
14. 14
Hill climbracingisa motorsportcompetitionwhere drivers race against the chronometer in
narrow and short courses ranging from 800 m up to 2000 m in length. In the United Kingdom the
governingbodyof thismotorsportbranchisthe HillclimbandSprintAssociation,andthe regulations
are yearlyreleasedbythe MotorSportsAssociation(MSA).There are differentcategories within this
championship,butthe racingcarthat has beenanalysedpertainstothe ‘Sports Libre Cars’ Category,
whose technical specifications can be found on page 325 of the MSA regulations2
. Section 15.1.1 of
this document stipulates the dimensions of the racing car. The regulations that have been used as
constraints for this project can be found in the appendix. A key aspect of this racing series, from a
design stand point, is that the designer has a lot of freedom to alter the car design in order to
optimise itsperformance asthe regulationsthatgovernthissportare notas stringentastheytendto
be in other racing series (e.g. Formula One, Indycar Series and others). This in turn, implies that
different approaches can be taken to maximise the performance of a given car. It is believed that
actual Hillclimb teams usually do not employ the computational resources that are presented and
usedinthisstudyto researchaerodynamicdesigns,derivinginthe freedom that the group had with
respect to the decision making. The racing car used as a baseline has previously undergone some
aerodynamictestingatthe R.J.Mitchell windtunnel atthe Universityof Southampton. On the other
side,all the designwascarriedoutinthisprojectwaspurelyconceptual,i.e.involvingcomputational
simulationsonly;thisstage wasnotfollowedbythe usual validation with wind tunnel scale testing,
thiswasnot in the goalsof the investigation. The simulations aid the visualization of the main flow
fieldfeaturesthatcannototherwise be analysed in detail; it is this specific aspect which comprises
one of the main outcomes of this project: to understand the flow patterns involving a racing car
making use of CFD. A CAD model of the baseline car, the 2010 MEng GDP actual tested model, was
obtained and the flow was simulated using a commercial CFD package: STAR-CCM+.
The project was divided into two main stages: during the first stage of the work, the main
objective wastoobtainsuitable meshsettingsthatwould generate grid independent results and to
solve the flowaroundthe baseline car to assess its aerodynamic characteristics. After outlining the
possible improvementsthatcouldbe introducedintothe baseline car,the second stage consisted of
three different design cycles where the design of the car was modified progressively aiming to
improve its aerodynamics performance. One of these design cycles included the optimization of
specificcomponentsof the car withthe intention to investigate the potential gains stemming from
single component optimization and the impact on the overall design of the car.
2 Motor Sport Association – United Kingdom– MSA, [online], available: http://www.msauk.org[accessed01/11/2012]
15. 15
1.1.Objectives
It has been reiterated that the paramount objective of this project was to increase the
performance of aracing car exclusivelyintermsof aerodynamics.Inthissection of the introduction,
a collection of the objectives is listed and explained.
Optimise the aerodynamic design of an open wheeled hill climb racing car.
Understand and have a better appreciation for the complexity of the aerodynamic
flow field generated by the racing car.
Learn howto workeffectivelywithacommercial CFDpackage anddevelopgoodCFD
practice skills.
Learn the challenges and benefits of working as a team.
Develop good communication skills.
Gain familiarisation with decision and definition of the managerial aspects of a
project.
Learn howto implementanactual optimisation methodology in the design process
to improve the performance of the car.
Bring the theoretical disciplines learned throughout the MSc programme into
practice to solve a challenging engineering problem.
Develop an awareness of the fundamentals of a design process.
Bearing in mind the objectives and purpose of the project the group had to find a way to
obtainthe bestresultspossible whilsthandlingatthe same time the rest of the course tasks, duties
and responsibilities.In addition, since none of the team members had any previous experience on
car design,itwasimportantto acquire a set of initial skills being these, a general understanding of
the mainflowfeaturesthatcharacterise the flow overacompetitioncarand the inherentchallenges
associatedwiththistype of problem.Thenitwas deemed important to acquire familiarisation with
general understanding of the software employed in the project and at least learning how to
efficientlyoperate the computational resourcesavailable.Havingthissetof skillswouldthenprovide
the ability to propose different means for improving specific areas of the car, always basing the
modificationsonthe physical insightsandgoodengineeringpractice.Furthermore,itwasconsidered
very important that the vast majority of the work was done as a team instead of a summation of
individual works. This also fulfilled the objective of understanding the importance that good
communications skills and information sharing play on a large team-based project, where to
accomplishthe definedgoalsafluentandclearcommunicationstrategyisparamount.Regarding the
computational approach, since the problem was to be solved by using state-of-the-art computer
software,itwasdeemedimportant to learn the good practices of CFD so as to work effectively and
with a methodology similar to that used in industry.
16. 16
The foundation of the 2012-2013 project was based upon working as a team on the entire
car, insteadof splittingthe carin parts: the workload was divided in an attempt to give all the team
membersthe opportunitytoworkineveryaspectof the projectasopposedtospecialising on a very
particular area of the problem. The initial aim was to improve the car progressively rather than
implementinglarge changesbetweeniterations, in order to differentiate where the gains or losses
came from andsurelyenhance the performance of a complex system such as an open wheeled car.
Ideally,acurve tendingasymptoticallytoatheoretical maximum value was sought for. In addition, a
veryimportantconsiderationforthis project was the ability to implement the knowledge acquired
on the individual classes in the project. This lead to the inclusion of an optimisation cycle onto the
design process to explore some of the learning outcomes from the design course during the first
semester of the MSc programme.
1.2.Assumptions
In orderto tackle sucha challengingprojectanumberof assumptionsoughttobe taken into
consideration.Justlike inanyengineeringproblem, once the problemhasbeenidentified, a number
of assumptions that do not compromise the validity of the decided approach but that somehow
simplifies it, or makes the process of finding a suitable solution less complex are given. This is a
common practice both, in the academic and industry environments. It is also important that these
assumptions somewhat adhere to the prescribed objectives of the project. Because these
assumptionsaffectdifferentpartsof the projectentity,theyhave beenclassified in different groups
to clarify the original intention of the simplifications and clearly identify the part of the project
where these assumptions have relevance.
1.2.1. CAD related assumptions
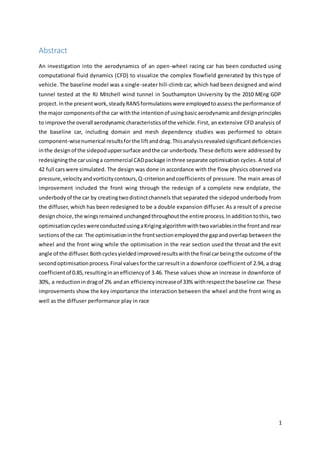
• Forthe entiretyof the project,the x-coordinateisthe streamwise direction(positive going
from the nose of the car to the rear wing). The z-coordinate is the spanwise direction, as shown in
Figure 1. The positive z-coordinatesare inthe directionfromthe centre plane of the car towards the
wheels.Finallythe y-coordinateisthe vertical directionbeingpositive fromthe groundup.This incur
inthe downforce beingreportedaspositive inthe downwarddirection(-ydirection).Itistobe noted
that thisreference systemiscompletelyopposite towhatisdescribedinthe SAEJ670 recommended
practice.However,the choice made insaidpaperclearlydidnottake intoaccountanyaerodynamics,
therefore it was decided to change the coordinate system to something more appropriate for this
case.
• The car is simulated without the suspension wishbones so that in the virtual model the
wheels are not connected to the car. It is obvious that the suspension would disturb the flow and
would change the flow conditions, but this simplification is made to ease the grid generation
process,alsohelpingtojustfocusthe flow analysistothe majoraerodynamiccomponentsof the car.
17. 17
• The simulated car is assumed to include the driver weight and the geometrical changes
implementedare supposedtonotaffector vary the weight of the vehicle. This allows to model the
car at the limit of the ride height prescribed in the regulations.
Figure 1: Baseline car with coordinate system.
• Interiorcavityof the cockpitisnotsimulated.The helmetandupperchestof the driver are
includedasexteriorsurfaces,beingontopof a flat plate located at a small depth into the cockpit. It
was considered that modelling the interior part of the cockpit and the driver inside would not be
efficient from CAD generation point of view, since any changes in the nose shape would infer in
readjustingthe driverlegspositionandmodellingtoomanyelementsthat would not affect crucially
the aerodynamics of the car.
• Materials or roughness are ignored on the problem. Although geometrical volume of
mechanismssuch asengine,gearbox andradiatorswasqualitativelyrespected,structural designwas
not takenintoaccount.The surfaceswere assumedtobe smoothandmaterialswere notconsidered
as it is beyond the scope of the project.
• Interactions in downstream direction are stronger than upstream. It was assumed that
elementsplaceddownstreamwouldnothave suchstronginfluence inupstreamcomponents, whilst
verystrongeffectswereobservedvice versa.Thisassumption allows to study the car from the front
to the rear.
1.2.2. CFD related assumptions
• Aeroelasticity is not being considered in the design process, even though fluid-structure
interactionsmightbe relevant.Inareal case, aerodynamic forces can cause deflection in structures
causinggeometrical variations,sothe aerodynamicforceswouldchange;however only rigid models
of the car were simulated, not taking into account the structural effects.
18. 18
• The car is simulated facing directly the flow. Crosswinds, turning or yaw angles are not
considered. Hence the numerical domain simulates the car at 30 m/s in straight line with air in
complete rest in the surroundings.
• Compressibilityeffectsare notconsidered.Asageneral rule inaerodynamics,compressible
effects can be neglected without any loss of accuracy when the Mach number is below 0.3.3
In the
current project the free stream Mach number in all simulations was approximately below 0.1,
therefore constant density in the simulations is assumed.
• The flowisassumed to be symmetric with respect to the plane that crosses the car in the
middle from the nose to the rear wing, therefore only half of the car is simulated reducing the
numerical costtogenerate the meshandsolve the flow field over an entire car. It was assumed that
by prescribingasymmetry boundary condition at the mid-plane, the car could be mirrored with no
detrimental effects to the solved flow field.
• The contact patch of the wheels was approximated by a block of 1 mm height in contact
with the ground overlapping the wheel geometry. Other approaches are available to model the
wheel-roadcontactinCFD,howeverthisapproachwaschosen based on the ease in grid generation
whilst still delivering accurate physical behaviour.
• Inner flows within the overhead intake ducts or the sidepods are not simulated. This
assumption simplifies in great deal the analysis, as the internal flow in these components is not
simulatedandlesseffortisrequiredalso in CAD work, meshing and solving different regions in the
numerical domain.Theyweremodelledas“outlets”, aboundaryconditionthat considers that when
the air reaches these locations it exits the domain.
• The exhaust gases and temperature variations within the domain are not taken into
account.Exhaustgasesfromthe engine couldbe used to enhance the aerodynamic performance of
the car, and the heated air expelled from the radiators might change the flow field. These aspects
were considered to fall out of the scope of this project. Discarding energy balance equations to be
solved in the simulations would speed up the process.
• Finally,the aerodynamic balance is computed as the ratio of the front wing downforce to
the total downforce,insteadthanemployingthe ratioof frontaxle downforce tototal.The difference
between the two methods was calculated to be within 5% of the initial value, and therefore the
former method was adopted as a consequence of its intrinsic rapidity.
1.2.3. Turbulence modelling
The simulations were run in steady state. Even though the problem being solved presents
very unsteady features, to simplify the problem the flow field was assumed to be steady. Being
aware of the nature of the physicsinvolved,withseparation and vortex shedding as a common flow
3 AndersonJr., J. D., “Fundamentalsof Aerodynamics”, 2ndEdition, Mc Graw Hill, Inc.
19. 19
pattern,unsteady simulations were not used since they are more complicated to solve in terms of
computational effort, adding convergence uncertainties with respect to the simpler steady
simulations. Ultimately this would reduce greatly the times to solve the simulations and help to
accomplish the tasks within deadlines.
Reynolds-AveragedNavier-Stokes(RANS) are usedforthe simulations.The setof momentum
equations in 3D plus continuity equation that comprise RANS are implemented in steady state
(SRANS) to resolve the simulations. SRANS solves an averaged flow field in space which has been
assumed to be steady in time. Accordingly to the requirements of the project and the intended
qualitycomputational gridsto be obtained, SRANS was assumed to give the main characteristics of
large structures of the flow that can be used in the conceptual design stage to improve the
aerodynamicdesign.Furthermore,RANSischosenbecause the detailsof the small scale turbulence
are in a sense not practical for the conceptual design stage where the focus is generally in the
approximate drag and downforce generated by the car.
High wall y+ was the selected approach to treat the boundary layer in the current project.
Field functions were used to approximate the boundary layer profile described by the logarithmic
law and it was considered to give trustful results (as it will be shown in section XX). Even if the
approachof a more refinedy+couldbe more precise,the size of the meshedfiles(approximately 40
millioncells for a half car) when using y1
+
<1, and difficulties using a hybrid y1+<1 and y1+>30 mesh
(further explained in the Section 4.3) prevented its use.
Unless stated otherwise, the turbulence model used on the simulations was the κ-ε 2-
equation model (one for transport and rate of dissipation and one for turbulent kinetic energy).
Being a RANS model, it models the entire energy spectrum of the turbulent flow. The solutions
obtainedare arepresentationof the average flow field in steady state and it is important to notice
that spatial small scales cannot be handled properly by the simulations and that structures such as
vortex generators,serratedtrailingedges, small scale vortices, flapping wakes or vortices shedding
cannot be preciselyrepresented.Itwasassumed that the κ-ε turbulence model would give reliable
enoughsolutions.More complex simulations like URANS, DES or LES (in order of complexity) could
give bettersnapshotsof the flowfield, however this was not attempted because still with SRANS a
deep understanding of the flow around a racing car can be met and numerous design solutions
found.
Finally, it is stressed that the race car that has been analysed is a hill climb car, the most
importantgoal isto improve the aerodynamicperformance of the vehicle. It is understood that one
of the most important variables that make a successful hill climb car is acceleration and cornering
manoeuvrability.One keyassumptionisthatthe car will likely have a predefined engine that would
not change fromthe baseline cartothe modifiedcar. As mentioned before the racing tracks are not
longerthan2000m, top speedsrarelyreach120mph.Therefore dragforce isnotthe mainconcern of
the project, although it is taken into account. On sight of these assumptions the objective is to
increase asmuch as possible the downforce generation,howeveritwill alsobe optimisedintermsof
20. 20
aerodynamicefficiency(L/D),so drag is also considered. Based on the previous assumptions, it can
be statedthatthe solutionswereintendedtobe asclose as possible toreality according to the tools
available andthe timeframe giventodevelopthe project.Havinglargelysimplified the problem, the
trendsgive the mostrelevant information; if all runs are simulated with the same aforementioned
assumptions,whenaninput modification presents better performance than previous designs, it is
likely that it would also present an improvement in real life behaviour.
1.3.Management and Project Fundamentals
The team management was found to be a critical and fundamental aspect to ensure the
goals the team set at the initial stages of the project were accomplished. A clear management
strategythatstipulateda“work-like-a-company”methodologywasestablishedatthe verybeginning
of the project,andsharedbyall the team.This strategyaimedtomaximise the amount of work that
could be completed in the time frame that was given and also to ensure that the team members’
capabilities and learning process were maximised.
The group thatundertookthisprojectwascomposedof six MSc students, each with diverse
backgroundsinengineering.Three of the team members had aeronautical backgrounds, while two
of the students were mechanical engineers and one member had previously completed an
automotive engineering degree. The execution of a design project of this kind demands a
considerableamountof workusingdesigntools,thusagoodknowledgeof CADandCFD principlesis
very important and the fact that some of the team members had previous experience using them,
proved to be very valuable.
The team received a hard disk with the CAD files of previous years Group Design Projects
(GDP).Thiscar isreferredasthe baseline car, which was tested in the R.J. Mitchell wind tunnel and
forwhichexperimental dataexists.The CADfileswere usedinconjunctionwithSTAR-CCM+tocreate
a suitable meshandtosimulate the flow aroundthe car.The CAD software used for this project was
Solid Works, mainly because the baseline geometry had already been created with this software.
STAR-CCM+was selectedas the CFDsoftware because of its user-friendly structure that merges the
geometrymanipulation,meshingandsolverenvironments into one unique software. In addition to
this,the automatedmesher and the powerful post-processing tools that it includes were the main
reasonsforselectingitoverother commercial packages. More precisely, race cars present complex
geometries and an unstructured mesh seemed more adequate to deal with this type of problem
efficiently. STAR-CCM+ offers a robust meshing algorithm to generate unstructured meshes, which
with a choice of user defined settings, eases the mesh tuning process for a specific problem. For
instance,the prismlayergeneratorisanimportantfeature forsolvingthe flow inthe regionsclose to
the solid surfaces and STAR-CCM+ generates it automatically, if the mesher model is selected.
Furthermore,the abilityof STAR-CCM+torepairCAD-importedsurfacesandtooptimallyprepare the
geometry for the CFD analysis was essential for obtaining high quality results. It is important to
mention that the team members received a one-week course of the fundamentals of STAR-CCM+,
courtesyof CD-Adapco.The course providedafirst contact with the software and allowed the team
21. 21
to address some of the initial problems encountered in the execution of the project directly with
people fromCD-Adapco.Another important factor that was critical in the gradual understanding of
the CFD package and the fundamental principlesof CFDwas obtained by attending the Applications
of CFD(SESS6021) module,whichtookplace fromOctober2012 until January2013 at the University
of Southampton.
The available computational tools to perform the flow calculations of the car are also an
aspectof the workthat was defined early in the project. The team used the Lyceum Linux Teaching
Cluster Service throughout the project. The use of Lyceum allowed the team to obtain results for
computationally demanding grids in a shorter amount of time than it would have otherwise been
possible inalocal workstation. During the first semester of work (October to December), the team
worked on Lyceum 1, which was equipped with 21 compute nodes (16 nodes with 2.3 GHz AMD
quad core processors and 5 nodes with 3 GHz Intel processors) with a peak performance of 2
Teraflops. Lyceum 1 was decommissioned in December so Lyceum 2 was used from January to the
completionof the project.Lyceum2 supposed a high improvement in the computational resources
available sinceit increased the number of compute nodes to 32, with 16 processor cores and 32GM
of memory (8 of the compute nodes have 64GB of memory). In addition, the theoretical peak
performance of Lyceum 2 is 9 Teraflops. It is noted that a significant amount of time was spent into
learningthe basicsof the Unix operational systemandthe required procedures to perform the bulk
of the computational work with this supercomputer.
1.3.1. Methodology
The Start of the project was the first meeting with Professor Sandberg on October 2nd
in
2012. Weekly meetings were held throughout the duration of the project to present the progress
that had beenachievedwithinadefinedperiodof time.Inaddition,the grouphadinternalmeetings
in order to define weekly objectives and to assess the progress made during the previous week.
Based on the initial team meeting, it was decided that good communication between the team
memberswasapriority.Several toolswere used to fulfil this objective. Initially a common Internet
file managementsite wasusedtoshare files,subsequentlycommonfile storage withinthe University
of SouthamptoncomputerserverswasobtainedfromiSolutions.Furthermore,electronicmailswere
used extensively and the considerable amount of classes that all the group members attended
together also contributed to a good group communication.
The most importanttool used,however,wasthe “work-like-a-company”methodology,which
consistedincompulsoryweeklyworkinghoursinwhichall membersof the groupworkedtogetherin
the computersatthe TizardBuildingDesignStudio.Duringthe first semester an average of 16 hours
perweekwere achievedwhereasduringthe second semester the average working hours per week
increased to25 inorderto complete the project objectives. This methodology allowed the team to
exploitthe individualexpertise of eachof the members,tohave frequent brainstorming sessions to
devise a plan of action for specific problems that needed to be solved or to bolster the
communication skills between team members.
22. 22
The chart in Figure 2, presentsthe workflow adoptedtodevelop the project. The group was
dividedinthree maindepartments(Design/CAD,GridGeneration/MeshingandCFD/Postprocessing),
similar to divisions in a company Engineering department. Since none of the team members had
previousexperience inmotorracingdesign,the inputstothe projectcame fromaconsensusfromall
of the team members emulating the input from the Head of the Engineering Department in a
company). These inputs came in after the group post-processing sessions, which occurred after
finishing the numerical simulation of each new design. The inputs were listed by the group with
specific tasks determining which parts of the design had to be altered. Modifications on the CAD
modelswere executedbythe Design/CADdivision;once the drawingswere approved by the project
manager,the GridGeneration/Meshdivisionproceeded with the mesh generation for the car. Once
the meshwasapproved,the CFD division started the computation and presented a post processed
file tobe analysedbythe entire team.Uponthe analysisof results,new inputswere generated and a
new cycle started. Finally, Version and document control was carried on to ensure that the correct
designwasbeingsubmittedtoMeshandCFD.The filesanddirectoriesgeneratedbyeach one of the
divisionshadaspecificformat to maintain the files organised and deal with the amount of designs
generated.
Figure 2: Sketch of the workflow adopted in the project.
Anothertool thathas beenusedextensivelyisaGantt chart that details the major tasks that
were performed during the project. The Gantt chart of the first semester is presented in the
Appendix 2- Gantt. Asit can be seen,the firstpartof the projecthada shortduration,approximately
of twomonthsfromthe date of the initial meeting(October4th
and the day of the first presentation
4th
of December).Mostof the firstmonthwasdedicatedtobibliographical review; training and CAD
23. 23
work.A greatpart of the bibliographicalreview consistedinreadingthe reports from previous years
and to researchpossible resourcesthatcouldaidwiththe designof the car(e.g.booksandjournals).
The trainingperiodconsistedincompletingsome fundamental SolidWorks and STAR-CCM+ tutorials
inthe TizardDesignStudiocomputersanditalsoincludedthe STAR-CCM+course attendance.Half of
the group attendedanonlinecourse atthe end of October while the other half travelled to the CD-
AdapcoHeadquarters in London to complete the training. A great effort was made in the CAD files
that were facilitatedassome of the car surfaces presented numerous imperfections, such as screw
holes and rivets and therefore a considerable amount of time was implemented in cleaning the
geometry to make it ready for CFD.
The month of November was exclusively employed to complete the meshing and the
simulations of the baseline car. The meshing process proved to be more time consuming than
anticipated,sincenone of the groupmembershadprevious experience with Star-CCM+, and it took
some time to get acquainted with the way that the software worked. It was also necessary to get
familiarised withthe geometrical parametersof the model the teamwasanalysing. Differentdomain
sizes, cell types, grid refinement and turbulence models were tested. The inclusion of volumetric
regions for grid refinement was also tested. Separate work on the front wing of the car and the
wheelsinisolationwasundertakenwhile the meshing of the car was being attempted. Some of the
resultsthatwere obtained for the components in isolation were used in the baseline meshing and
simulationprocedures.After the presentation in December there was approximately a one-month
and a half hiatusduringthe Christmasvacationandthe examinationperiod.The workforthe second
semester resumed on the 28th
of January of 2013.
The work on the second semester consisted in: performing a group of preliminary studies,
executing an extensive revision and post-processing of the results obtained in the baseline car
simulation; implementing the design methodology into three optimisation cycles and writing the
report. The Gantt for the second semester is also presented on Appendix 2 - Gantt.
The preliminary studies were made to answer practical questions proposed by the group
duringthe developmentof the project.Toensure thatthe selectionof airfoils made for the wings of
the baseline car was a good for the application, a study on current and potential airfoils and wings
that could be implemented in the car was performed. To verify if the meshing setup used on the
baseline car could be improved a study on meshing settings testing different values of y+
was
performed. And finally, to verify if the boundary conditions adopted on the sidepods and engine
intakes was correct a study on these parts was performed.
Since one of the objectivesof the currentprojectwastooptimise the aerodynamicdesign of
the baseline car, the revision and post-processing of the baseline car was intended to give an
understanding of the flow over that car so that modifications to improve the design could be
proposed. The other objective of the task was to get used to the post processing tools of the Star
CCM+ software; a set of commonly used views and geometrical entities to visualise flow patterns
24. 24
were savedandthencopiedintothe solutionfilesof subsequent designs. The task was executed in
group, since the design modifications were proposed in consensus by the group members.
The design methodology presented previously was intended to be used into three
optimisationcycles.Basedonthe time for calculating the solution of the full car simulations on the
baseline car in the Lyceum 2 Cluster (approximately 16 hours) the group proposed that a new
approach for the design of the car should be attempted: instead of testing modifications and
optimising individual components of the car as it was implemented in previous years, the
modificationson the car parts would be tested in the full car simulations to see their impact in the
whole flowfield.The groupmembersalsorealisedthatthe GDPcouldbe usedtoimplementsome of
the knowledge obtained in the modules attended in the previous semester, such as the concepts
learned in the Race Car Aerodynamics (SESA6039), Turbulence (SESA6028) and Design and Search
Optimisation (SESG6018) modules.
1.3.1.1. First Design Cycle – “A” Iteration
In the First Design Cycle, changes in the design were proposed based on the group
knowledge. A total of 5 cars were simulated in the cycle, and the process took approximately four
weekstime.The first input for modifications was the results obtained in the postprocessing of the
baseline. The car was analysed based on what was learned in Race Car Aerodynamics (SESA6039)
module andfromthe bibliographical review.The main idea was to identify geometrical aspects and
flow patterns that could prevent the car from performing at its maximum, and propose changes to
improve the flowinthe region.Suggestionswere proposed, and the work was executed in the form
of the cycle from Figure 2 startedbymodelling, meshing and simulating. The results obtained were
once againpost-processedingroupandnew inputswere suggested,restartingthe cycle. All the cars
createdinthe FirstDesignCycle,alsocalled “A”Iteration,werenamedwiththe letter A followed by
number characters. It is to be noted how, from this moment on, all the new parts that were
producedbythe CAD departmentwere givenaprecise andunivocalfilename, so that the evolution
of a single part, or assembly, could be traced back at every point in time.
The methodology of the first iteration proved to be efficient and allowed a good version
control based on the generated documentation. As new designs were being tested the tasks were
being learned by the group members and an acceleration of the process was obtained. The group
alsoinvestedsome time inlearninghowtotake advantage of automatingtaskswith macros in STAR-
CCM+; this work that started as an unpretentious search became a very useful tool to meshing,
solvingandpost-processing.Asthe numberof designsincreased,the macros ensured that the same
meshingparametersandsolutionsetupswere maintained whilst boosting the throughput. The use
of Javamacroswas a pillartoimplementing the optimisation methodology of the second and third
iterations.The time to implement modifications and test a new car took approximately one week,
but itwas a consensusthatwiththe developmentof the automatedmacrosprocess, this time could
be reduced further.
25. 25
It was noticed that the ad-hoc approach used on the first cycle led to inputs on the design
that sometimes generatedabetterperformanceandsometimesaninferiorperformance,however it
will be shown in the following sections that the final design from “A” iteration, presented a solid
improvement from the baseline car. This cycle demonstrated that previous knowledge and
experience in race car design are beneficial on this type of approach; an experienced engineering
manager could point the right direction to be followed, saving a lot of time by avoiding the
implementation of poor design solutions.
1.3.1.2. Second and Third Design Cycles – “B” and “C” Iterations.
The idea behind the Second and Third Design Cycles was to implement a more systematic
and scientific approach to the optimisation problem, therefore a procedure based on a surrogate
model wasadopted.The learningprocessof the firstcycle combinedwiththe automationtool above
mentioned,gave the groupthe confidencetoattemptthis approach. A considerable number of cars
would have to be simulated and the group knew that time could be a real constraint. Two critical
parts of the car were investigated, based upon the idea of moving from upstream to downstream
areas of the car, since the frontal parts of the vehicle tens to have a stronger influence in
downstreamcomponents.Inthe secondcycle the relativepositionbetweenthe wheelsandthe front
wings(gapand overlap) wasvaried.Inthe secondoptimisationcycle,geometrical parameters of the
diffuserwereinvestigated. All the cars created in the Second Design Cycle, also called “B” Iteration
were namedwiththe letterB followed by number characters; in the Third Design Cycle, also called
“C” Iteration were named with the letter C followed by number characters.
Starting from the best design of the first optimisation cycle, the variables for the second
optimisationcycle were defined and a population of 19 CAD designs were generated, meshed and
simulated.A response surfacewasgeneratedwiththe results suggesting the region where the best
combinationof variablesshouldbe;anew generationof designsinthe optimal regionwasdesigned,
meshedandsimulated.Onthe otherhand,the bestdesignfromthe second Optimisation Cycle was
the startingpointforthe ThirdOptimisationCycle,andthe same procedure describedforthe Second
Cycle was adopted. The process will be described in detail in further sections.
26. 26
2. Bibliographical Review
2.1.Previous Years Reports
Thispart of the bibliographical review isintendedtogive abrief overview of the main results
and designapproachesattempted by the 2010/2011 and 2011/2012 GDP groups.The main goal is to
summarise the majoritemsinvestigatedbythese twoteams and the most important conclusions of
each study. The aim is to use this information to understand the challenges associated with the
problembeinginvestigatedand also to gain useful knowledge of the potential areas of the car that
can be exploitedtogainaerodynamic performance, and to avoid those areas that have been found
problematic.
2.1.1. MSc in Race Car Aerodynamics GDP Report 2010-11
2.1.1.1. Methodology
The 2010/2011 GDP project was formed by 6 individuals. The approach was to split the car
intosevendifferentelements so that each member of the team could investigate the aerodynamic
performance of one major part of the full car in isolation. The car was split into the following
components:(1) Sidepod,(2) FrontWing,(3) Rear Wing, (4) Engine Cover, (5) Helmet, (6) Nosecone
and finally (7) Diffuser. In addition, the wheels were studied in isolation to gain a better
understanding of the flow behaviour around them. Furthermore, the most fundamental flow
featuresof the baseline carwere not analysed in great detail because this team decided to analyse
extensivelythe individual componentsof the baseline carinisolation.Hence,the methodology used
was to optimise every component by itself prior to combining all the different parts to study the
effect of the flow interactions between all the components in the full car. Two iterations were
performed. Furthermore, the frontal area of the full car was used to calculate the aerodynamic
coefficient of the components in isolation in an attempt to keep consistency when comparing the
parts in isolation and mounted on the car.
2.1.1.2. Baseline Car Analysis
The Baseline CADmodel usedwastakenfromthe 2009/2010 MEng GDP projectandmeshed
inSTAR-CCM+ usinga polyhedral meshwithaprismlayersurrounding the car. This prism layer had a
y+
value that was below 5 on both the front and rear wings whereas the rest of the car had a prism
layerwithay+
value above 30. Because twodifferentwall treatmentapproacheswere taken,the “All
y+
treatment”model wasselectedforthe walls.Inordertoachieve these y+
values,alocal estimation
of the firstwall distance wasdone usingthe flatplate approachwiththe characteristiclengthof each
part of the car (e.g. Wing element chord, Nosecone length, etc.)
Once the near wall treatment was fixed, two different dependency tests were carried out.
The meshdependencytestconsisted onrunningtwodifferent meshes of 7 and 14 million cells. The
resultsindicateda1% differenceinliftanddragcoefficientsbetweenthe two meshes. In addition, a
domainsize studywascarriedoutbychangingthe lengthof the domaininthe stream-wise direction.
Resultsof thistestyielded a 1% difference in lift and drag coefficient between the longest domain
27. 27
(inlet located 3.5 car lengths in front of the car and outlet located 6 car lengths behind it) and the
shortestdomain(inletpositioned at 2 car lengths in front and outlet at 4 car lengths behind it). The
longest domain was chosen for the simulations. Finally, a mesh of 8.5 million cells over a chosen
domain was used for the baseline flow analysis and subsequent iterations. In addition, the k-ε
turbulence model was the selected as the turbulence model throughout the project because of its
robustness. More specifically the Realizable k-ε Two-Layer turbulence model with all y+
treatment
wasused.The teamalso testedthe k-ωturbulence model butit wasfoundtobe too sensitive to the
initial and boundary conditions and it was discarded. A segregated solver was used. With these
settings Table 1 shows the results:
Table 1: Aerodynamic coefficients element-wise.
Component CD CL
FrontWing 0.08 0.9
Nosecone 0.02 -0.11
FrontWheel 0.15 -0.08
Splitter 0.05 -0.05
Cockpit& Driver 0.01 -0.02
Engine Cover 0.06 -0.09
Sidepod 0.13 0.49
RearWheel 0.17 -0.13
Diffuser 0.03 0.48
RearWing 0.30 1.13
Whole Car 1.02 2.52
It can be seen that the overall coefficient of lift was calculated to be 2.52 while the overall
drag coefficient was 1.02. The biggest contributors to lift were the rear wing, the front wing, the
sidepod and the diffuser. It can clearly be seen that the other components generated negative
downforce (lift). On the other hand, the components that generated the most downforce also
generatedthe highestlevelsof overall drag. It is noted that the front and rear wheels are also large
contributors to the drag of the car.
2.1.1.3. Iteration summary
As mentionedbefore,twooptimisationiterationswere completed.Duringthe first iteration,
the teammembersstruggledtoimprovethe downforce of the individual parts and only the Sidepod
and the Diffuserpresentedsome improvement.The seconditerationwasmore fruitful and the team
managed to improve the overall performance of the car.
28. 28
2.1.1.3.1. First Iteration
2.1.1.3.1.1. Front Wing
During the first iteration the front wing was modified quite extensively. First, the wing
profiles were changed from the LS413 of the baseline to the thicker NACA 9618 profiles.
Furthermore,abridge wingwasusedwithaSelig1223 airfoil shape.The gapandoverlapof the wing
elements were also changed according to Zhang and Zerihan4
in an attempt to maximise the
downforce,sinceitwasnoticedthatthe baseline gapandoverlapdistribution was aimed at a higher
efficiency rather than downforce. The endplate was also redesigned. It included a tyre ramp to
reduce the liftoverthe wheel,andsome curvature wasaddedtoguide more airtowardsthe sidepod
inlets.The resultsattainedinthisiterationwereworse thanthose obtainedforthe baseline car with
a 57% dropin efficiency.Inaddition,the tyre rampdirectedthe edge vortex towards the upper side
of the front wheel causing a large increase in the lift of the front wheel.
2.1.1.3.1.2. Sidepods
The approach used to generate higher downforce was to shape the bottom of the sidepod
with an aerodynamic profile. Three airfoils were taken into consideration: a LS413, an Eppler E423
and a MH32. The LS413 profile was selected because it exhibited the best performance in ground
effect.The sidepodslengthwas also increased, now extending beyond the rear wheel to avoid the
large effect the wheel had on the baseline sidepod exit. The last modification introduced in this
iterationstage wasthe flatplate onthe side of the sidepods.The flatplate hadtwopurposes:First,it
was aimed at creating high pressure on the upper surface near the rear wheel whilst low pressure
underneaththe plate wouldincrease the downforce.Secondly, the flat plate was postulated to seal
the channel that is formed under the diffuser targeting less flow spillage from the sidepod
underbody.Withall these modifications,the sidepod attained a 79% increase in downforce and the
overall efficiency of the sidepod was doubled.
2.1.1.3.1.3. Diffuser
The same airfoil asthe one usedinthe sidepodwasimplemented in the diffuser in order to
avoidflowspillage fromthe diffusertothe sidepodandvice versa.Furthermore,the sidepodandthe
diffuserweremergedintoasingle partsoonlyone channel wasseenunderthe car. The major effect
of thismodificationwastoenlarge the edge vortex so that it covered up to ¾ of the diffuser span at
the expansion section, which reduced some of the pressure recovery. Although the modifications
brought some issues, the overall performance of the undertray was increased.
2.1.1.3.1.4. Engine cover
The engine cover was rebuilt from scratch. The engine intakes were placed on the sides as
opposed to the baseline configuration. This allowed the engine cover to be lowered so that the
frontal area of the car was reduced. The modifications applied had a positive effect since the drag
4 Zhang, X., Zerihan, J., Aerodynamics ofa Double-element Wing in GroundEffect. AIAA Journal, Vol. 41, 2003 pp. 1007-
1015.
29. 29
and liftcoefficientswere reduced. However, the flow over the sidepods and near the engine cover
turnedoutto be more turbulent,whichcouldhave led to worse flow conditions arriving to the rear
wing. Additionally a roll-bar was added due to security restrictions.
2.1.1.3.1.5. Rear Wing
The rear wingwas completely changed from the baseline. The new rear wing had only two
elementswithlongerchords.The airfoil selectedforbothelementswasaChurchHollingerCH 10-48-
13, a high lift low Reynolds number airfoil. The airfoils were simply extruded up to an endplate
providedwithaninnerfoot.Animportantobservation is that the rear wing was not attached to the
car because the designwaslackingthe rear wing struts. Furthermore, the wing was perhaps placed
too low, because from the frontal view, the main element of the rear wing was not visible.
2.1.1.3.2. Second Iteration
2.1.1.3.2.1. Front Wing
In the seconditerationstage,the teamdecidedtocome backto the initial airfoil designused
by the MEng GDP, the LS413, forfirstand secondelement.Howeverthe airfoil was slightly modified
on the secondelement.Anextensionwasaddedtothe trailingedgeof the secondelementbasedon
previous experience of the team members in other race car competitions such as “Formula 3”.
Moreover the endplate was redesigned again using a straight shape at the bottom part having a
constant width, whilst the upper side was kept curved inwards. Further modifications were made
over the upper side of the endplate, to breakdown the vortex generated by the upper edge. In
addition,the edge plate of the endplatewasmodified,definingasemi-circularprofilethat enhanced
the edge vortex production.Finally,aturningvane wasaddedinthe proximitiesof the endplate with
the intention of enhancing the strength of the edge vortex.
The results for this second iteration were better than those obtained in the first iteration,
neverthelessthe teammembers agreed to maintain the bridge wing because of two main reasons.
First,the downforce increasedwiththe bridge wing and secondly the addition of this third element
supposedlymade the wingstifferallowingthe use of onlyasingle strutforstructural purposes. Even
thoughthe bridge wingproducedmore downforce onthe frontwing,itworkedinasense asa poorly
designedtyre rampsince itleadtoa significantincrease onthe frontwheel lift. Figure3and Figure 4,
show the drag and lift breakdown by component.
2.1.1.3.2.2. Sidepods
For the seconditeration,the sidepoddesignersdecidedfirst to try to increase the inlet area
inorderto increase the massflowrate incomingintothe channel, this being a trend in recent GDPs,
withthe difference thatturningvaneswere addedtocanaliseandstraighten the flow. However, the
results were observed to be worse than expected as the downforce dropped 50%. The design was
revisedandthe inletwentbacktoits original dimensionwith the addition of the turning vanes. The
channel underthe diffuserwasastraightchannel inwhich the only variable affecting the cross area
30. 30
wasthe ride height.The LS413 airfoil wasstill usedasthe aerodynamic profile for the lower surface
of the sidepod.
The sidepod performance after these modifications resulted in an increase of nearly 4% in
downforce and a decrease of 3.6% in drag so that the efficiency ended up to be almost 8% better
than in the previous iteration. Unfortunately the turning vanes encouraged flow spillage into the
central diffuser reducing the effectiveness of the sidepods in benefit of the former.
2.1.1.3.2.3. Bargeboard
A brandnewelementwasdesignedforthisseconditerationsince itwasrealised that the air
wasenteringthe sidepodthroughthe sidesdue tothe pressure differential between the outer flow
and the sidepod channel. A bargeboard was then created with two main purposes: Firstly to direct
the flowtowardsthe sidepodsinletsandsecondlytogenerate avortex aimedtoincrease the sealing
effect of the sidepod skirts, acting as the rubber skirts used in F1 in the late 70’s.
2.1.1.3.2.4. Diffuser
For thisseconditerationthe ideaof mergingthe diffuser and the sidepod into a single large
channel wasabandoned.Skirtswereplacedonthe sidesof the diffusersotwodifferenttunnelswere
used,one forthe sidepodandanotherforthe diffuser.Usingthe informationfrom the first iteration
it wasdiscoveredthatthe diffuser was operating too close to the ground so the minimum pressure
pointwasraised.Again,asithappenedinthe firstiterationthe modifications done in the undertray
slightly raised the value of the downforce generated by this element.
2.1.1.3.2.5. Engine cover
The analysisof the firstdesignresultsleadtothe conclusionthatthe flow featuresproduced
by the engine coverwere tooturbulentanddetrimental tothe rearwingperformance.A completely
new philosophy was then employed for the second engine cover model. The engine intake was
redesignedtoamore usual configuration with a single intake placed above the driver helmet. This
second design managed to direct the flow to the rear wing in a proper way with the subsequent
reduction in drag production. Moreover this design did not include the rolling bar.
2.1.1.3.2.6. Rear Wing
A gap and overlap study was made for the rear wing elements and finally the best
combination was used for the second iteration. The design was almost the same as for the first
attempt with the difference that the wing was moved allowing it to be in a more “free-stream”
conditionandtwostrutswere added as mounting elements. Although the performance of the first
design was significantly improved by the second design, it was still worse than the MEng results,
almost 25% worse. The drag was, however, 15% less than the MEng design.
31. 31
Figure 3: Drag coefficient by component for 1st and 2nd iterations.
Figure 4: Lift coefficient by component for 1st and 2nd iteration.
2.1.2. MSc in Race Car Aerodynamics GDP Report 2011-12
2.1.2.1. Methodology
The 2011-12 GDP team design approach was to split the car in four main sections (front
wing,diffuser,sidepodsandrearwing) that were distributed amongst the four-team members that
composedthe group.The intentionwastoimprove eachsection’sperformance by studying them in
isolation using CAD and CFD. Constraints were set for each individual part so as to account for the
interactionsbetweenthe differentcomponents.Eachof the individualcomponentstudies was given
a predetermined timeframe after which the full car was assembled and simulations of the entire
geometrywere attempted.Once the full carsimulationswere completed,the general procedure the
teamfollowedwastocompare these resultstowhatitcouldbe expectedfrom the isolation studies.
32. 32
The working pace was gradually accelerated as the academic year evolved as the team
membersgainedexperience withthe software used (Solidworks and STAR-CCM+) and were able to
build up a robust CFD practice (for which they employed guidelines to follow after the CD-Adapco
trainingcourses).Thispermitted,bythe final stages of the project, to run more simulations and the
teammemberswere able totestpermutationsof the different designs looking for the best choices.
2.1.2.2. Baseline Car Analysis
The firstpart of the projectinvolvedanalysing a baseline car, which they obtained from the
2010 MEng GDP car. The initial stage of the CFDprocesswasto seta propermeshingstrategy,carried
out in STAR-CCM+. Some attempts with polyhedral cells were run at an initial stage following the
conclusions from the 2010-2011 MSc Group Design Project, but because the cells in this particular
meshingconfigurationhave anaverage of twelvetofourteenfaces,ahighnumberof calculationsper
iterationandheavyfilestorage are required.Forthe complexgeometries dealt within this project it
was considered that a more efficient choice was to use a trimmer mesh, whose cells have only six
faces and are not as computationally demanding in terms of memory or time.
The workflow employed for the meshing approach was to import a parasolid file from
SolidWorks into STAR-CCM+, to then use a surface wrapper, surface remesher and finally generate
the mesh. The decision to use the surface wrapper stemmed from the poor CAD model that was
givenandthat required a significant amount of corrections prior to the meshing stage. The surface
wrapper virtually eliminates the need to repair manually the surfaces imported into STAR-CCM+
thereforemakingthe problemlesstimeconsuming.Howeveritisnot mentioned that this may incur
in slight modifications of the geometry which would not give correct solutions. Once the surface
issues are solved by the wrapper the procedure is straightforward with the remesher and volume
meshgeneration.The choice of y+
wasjustified in terms of computational cost affordability mainly,
stating that resolving the viscous sublayer (hence aiming to y+
< 5) was not feasible in terms of
computing time.
It was justified a selection of a base size of 5 mm after the mesh dependency study. The
resultsare seenin Table 2. Fromthe resultsit was concluded that aiming for a mesh coarser than 11
million cells was enough to obtain accurate results for the baseline car. It was assumed that the
designvariationswouldnotstronglyaffectthe convergence of the simulations of the full car. Hence
these settingswere employedconsistentlyandnomore mesh dependency studies were run for the
full car.
Table 2: Mesh dependency study.
Meshbase size [mm] Cell count CL
7 6,097,294 2.31
5 10,831,246 2.36
4.5 13,595,895 2.36
4 15,688,673 2.35
33. 33
The boundary conditions defined in the Physics continua for the surfaces of the domain
were: no slip wall for the car surfaces, moving wall for the ground, rotating tires, velocity domain
inlet, pressure outlet for the engine and sidepods intakes, pressure domain outlet and symmetry
planes on top, side and middle planes. The resolution of the problem is highly influenced by the
initial andboundaryconditions,butthe selectedconditionswere assumedto be appropriate for the
simulationscarriedout.Itwas statedthatthe airintakesof the engine andsidepod, being modelled
as pressure outlets, force the flow to exit the domain; in a real scenario the air would re-enter the
domain through the exhausts, however this was not included in the modelling mainly to not
complicate the problem with the addition of other phenomena such as heat transfer or Coanda
effect. Some of the main settings are shown in the Table 3 below.
Table 3: Physical Models.
Physical Model Description/Value
Spatial Model 3D
Material Gas – Air
Pressure-Velocitycoupling Segregated
Equationof state Constantdensity
Time modelling Steady
ViscousRegime Turbulent
RANSModel Realizable k-εTwo-LayerAll y+
treatment
Despite notpresentingthe results,afterthe domain study that was carried out, the settings
selectedforthe domainwere3 and 5 car lengths in front and behind the car, respectively. With the
outlinedsettingsthe baseline analysisgaveaCL of 2.363. Nospecificfigureswere explicitly listed for
drag, howeverpie chartswere shownforboththe lift and the drag as shown in Figure 5. In the final
stagesof the projecta comparisonof these chartsis commentedtoanalyse variationsin the balance
fromthe baseline tothe newdesigns.The wheelsand the body generated lift with CL of-0.184 and -
0.167 respectively.
Fromthe results that were obtained it is clear that the main contributors to downforce are
the rear wing,the frontwingandthe diffuser.The wheelsgenerate a significant positive lift and the
sidepoddoesnotappeartobe efficient.Moreover,the wheelsare the componentsthatgeneratethe
highest drag followed by the rear wing and the body. Lastly, the flow over the car was analysed by
flowvisualisationwith Q-criterion iso-surfaces coloured by vorticity in x-direction and TKE contour
plots on streamwise planes at different distances from the symmetry plane. From the flow
visualisation design strategy for subsequent designs was drafted. Moreover, from the baseline
simulationtheyalsocomparedand analysed the results obtained from the full car with each of the
simulationsperformedforthe isolated parts. The differences were critically analysed to justify the
isolation studies and to extract extrapolations that might be taken into account.
34. 34
Figure 5: Split of drag (left) and downforce (right) (ignoring sources of lift).
2.1.2.3. Iteration summary
A total of three iterationswere successfully completed. The clear objective was to improve
the car withthe new designs in each iteration. However they did not improve the baseline figures
until the last design iteration.
2.1.2.3.1. First Iteration
2.1.2.3.1.1. Front wing and nose
Two designswere createdforthe firstiteration. The first design only implemented changes
in the endplates, adding curvatures both inwards and outwards of the wheel and also enveloping
part of the wheel to try to deflect the upper edge vortex over the tire. The second design used a
widerfrontwing,withextendedendplatesthattriedtodirectthe flow intothe underbody of the car
passing into the wheels. As well as this, a new sharper nose was implemented whilst the wing
configuration was conserved from the baseline car. The first design resulted in an overall large
increase indrag(4200% forthe endplate) whilstreducingthe wheel dragby85%. Thisdesignwasnot
usedon the full car. The second design gave 20% increase in drag and 2% decrease in downforce in
the full car simulation, resulting in approximately 20% drop of efficiency.
2.1.2.3.1.2. Diffuser
Giventhe reciprocal influence between the sidepod and diffuser the sidepod performance
was also included in this part. Two objectives were pursued in the first iteration: to increase
downforce byincreasingthe surface areaof the diffuser and optimise the strength of the vortex by
varyingthe side-edge thickness.Forincreasingthe surface areachannel extensionswereaddedfrom
the exit of the sidepod downstream, called outboard diffuser tunnel. A total of three different
designs of outboard diffuser tunnel were tested. The best outboard diffuser tunnel was the third
one,witha gainindiffuserdownforce (11.9%) but decrease in sidepod under channel (16%). These
comparisonswere made betweenthe isolatedelementsanalysisfor the first iterations with respect
to their performance in the baseline full car. A simple graph shown in Figure 6 summarises the
conclusions from the side-edge thickness study, showing that the thinner the plate separating the
diffuser and sidepod the higher downforce generated by both elements.
35. 35
Figure 6: Underbody downforce dependence on diffuser edge thickness.
The firstdesignof the sidepods was based on actual F1 sidepod shapes and it also included
fins,vortex generatorsandaserratedside edge of the flat plate. A total of eight designs varying the
shapesof the serrated side edge,sizesof vertical finplacedatthe frontoutercorner of the flat plate
were produced.The resultsfromthisstudyshowsthatthe downforcewasdecreasedafter each new
design,goingfromCL = 0.92 fromthe baseline car to -0.125, even generating lift, for the last design
of the firstiteration.Howeverthe dragcoefficientwaseffectively reduced from 0.4584 to 0.09 in the
last two designs of this part.
2.1.2.3.1.3. Rear wing
A total of fourdesignversionswere runinthe first iteration of the rear wing study. The first
step was to set the endplates size and shape. Louvers were added, leading edge rounded to
accommodate the wheel andtoptrailingedgewassquare-cuttoaidthe louvers’performance. After
this,the aerofoilswere changed from the baseline profiles to S1223, although the baseline chords,
gapsand overlaps settings were kept intact. Then the mounting struts were also considered in the
isolationstudyandlastlyagurneyflapwasintroducedinthe thirdelementof the upper wing. It was
commented that the lift and drag estimations drop by 33% and 24%, respectively, between the
isolation study and the full car simulation with the new design.
2.1.2.3.1.4. Engine cover
For the engine cover isolated study, the cockpit and nose were also included. Only one
designof the engine coverwasworkedoutinthe firstiteration.Longerand smoother slope towards
the rear part was shaped to try to reduce drag. A successful decrease in drag of 11% was achieved,
however increasing lift by 54% in comparison to the baseline car.
2.1.2.3.2. Second Iteration
2.1.2.3.2.1. Front wing and nose
The seconditerationof the front wing and nose studied several aspects: 2D studies
of differentaerofoilsinmulti-elementandgroundeffectconfiguration, multi-deck wing designs and
a newnose shape.The aimof the 2D studieswastoguide the designdecisions about the front wing
setup. The aerofoil performance was judged using JavaFoil by monitoring the CL against angle of
36. 36
attack andCL againstCD plots. Once the profileswere selected(NACA 9618 forthe mainelementand
Eppler E423 for the flaps) three variables were studied in STAR-CCM+ with 2-D simulations step by
step: Angle of attack of the mainplane, gap and overlap of the two flaps and finally the angle of
attack of the second flap. The chord of each element was kept as in the baseline car. The first flap
elementangleof attackwaschosenvisuallysettingitasa tangentcontinuationof the mainplane.For
simplicitythe gapandoverlapbetween the main element and first flap and between the two flaps
were set to be the same at 5 mm, hence reducing the number of variables to analyse from four to
two.
A seconddeckwitha wingcomposedof twoelementswasadded,with dimensions,
vertical separationtothe mainwingand angles of attack selected based on visual judgement. They
were lateroptimisediniteration3.In additiontothis,agurneyflapwasincludedat the trailing edge
of the flapelement.Thisupperdeckhoweverwasimplemented only close to the endplate to leave
the middle sectionascleanas possible to lead more air into the diffuser inlet. Apart from this, two
other designs were experimented using single elements with long and short chords to test and
compare theirperformance.A newendplatewas shaped pretending to deflect the top edge vortex
over the top of the front wheel to diminish the drag produced. The nose and the splitter were
redesigned as well, with a sharper nose in arrow point but with rounded edges and a splitter
following the nose shape in top view.
The first of the three designs was the design that yielded better results in the full car
simulations, increasing by 45% both the lift and drag with respect to the baseline analysis. A
thoroughflowvisualisationpost-processing followed this section, showing separation in the upper
deck and how the top edge vortex went around the tire not over it. Still the modified wake of the
front wheel derived in a decrease of the wheel drag.
2.1.2.3.2.2. Diffuser
The seconditerationof the diffuserwascomposedof geometrical variations,lengtheningthe
diffuserdownstreamandwideningitsoutlettoincrease expansion and enhance downforce further.
Ten different designs were tested, and with the maximum lateral expansion configuration a 65%
increase in downforce for the diffuser and 16% for the sidepod were obtained. These figures
however were for the isolation study. Larger and stronger vortices are visualised in the post-
processingsectionand2Dplotsof pressure distributionwereincluded to show the suction increase
with respect to the baseline geometry.
2.1.2.3.2.3. Sidepod
Downforce generationwasthe mainfocusof the seconditerationstudyonthe sidepods. For
the lowerside of the sidepod,the NACA63(2)615and Eppler423 profileswerecompared,concluding
that the secondprofile wasmore desirable because of higher CL. Two more designs with the Eppler
423 lowerside wererunadding vanes at the inlet of the lower channel. A smaller air intake for the
radiator and winglets at the rear part of the sidepod were also added. The last resulted to be the
best design from the second iteration, which whilst increasing by 4% the baseline car drag