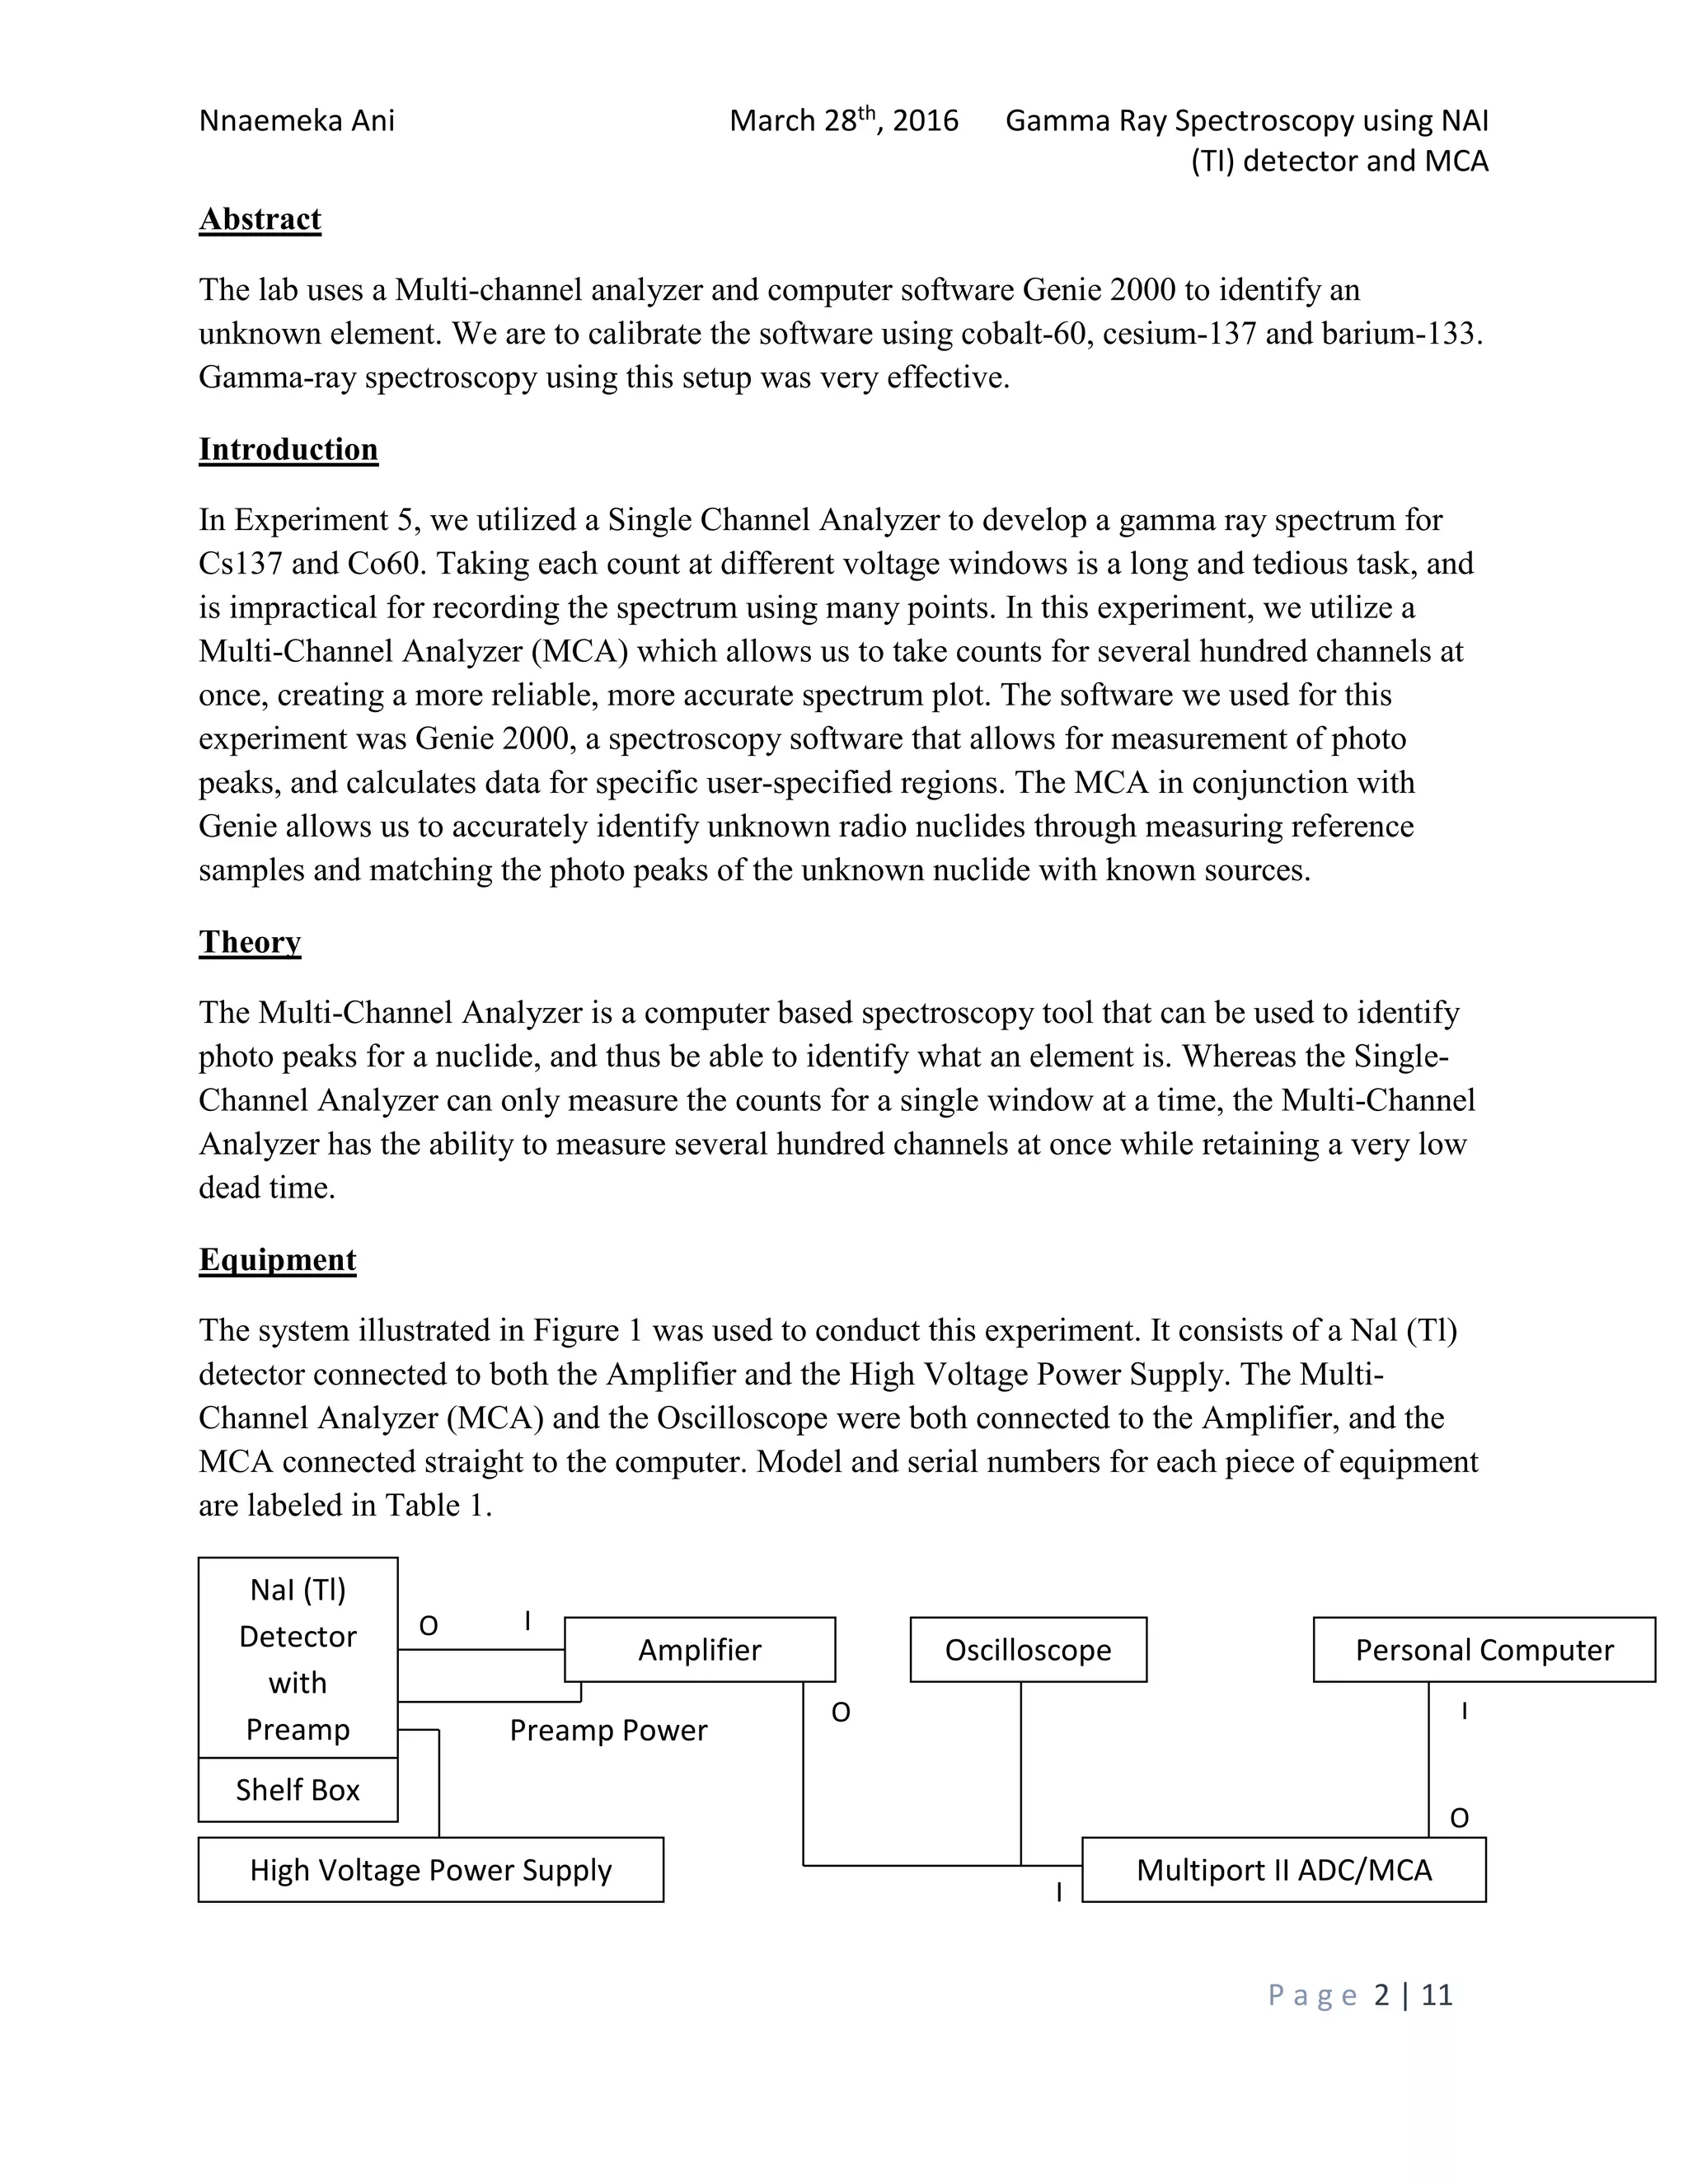
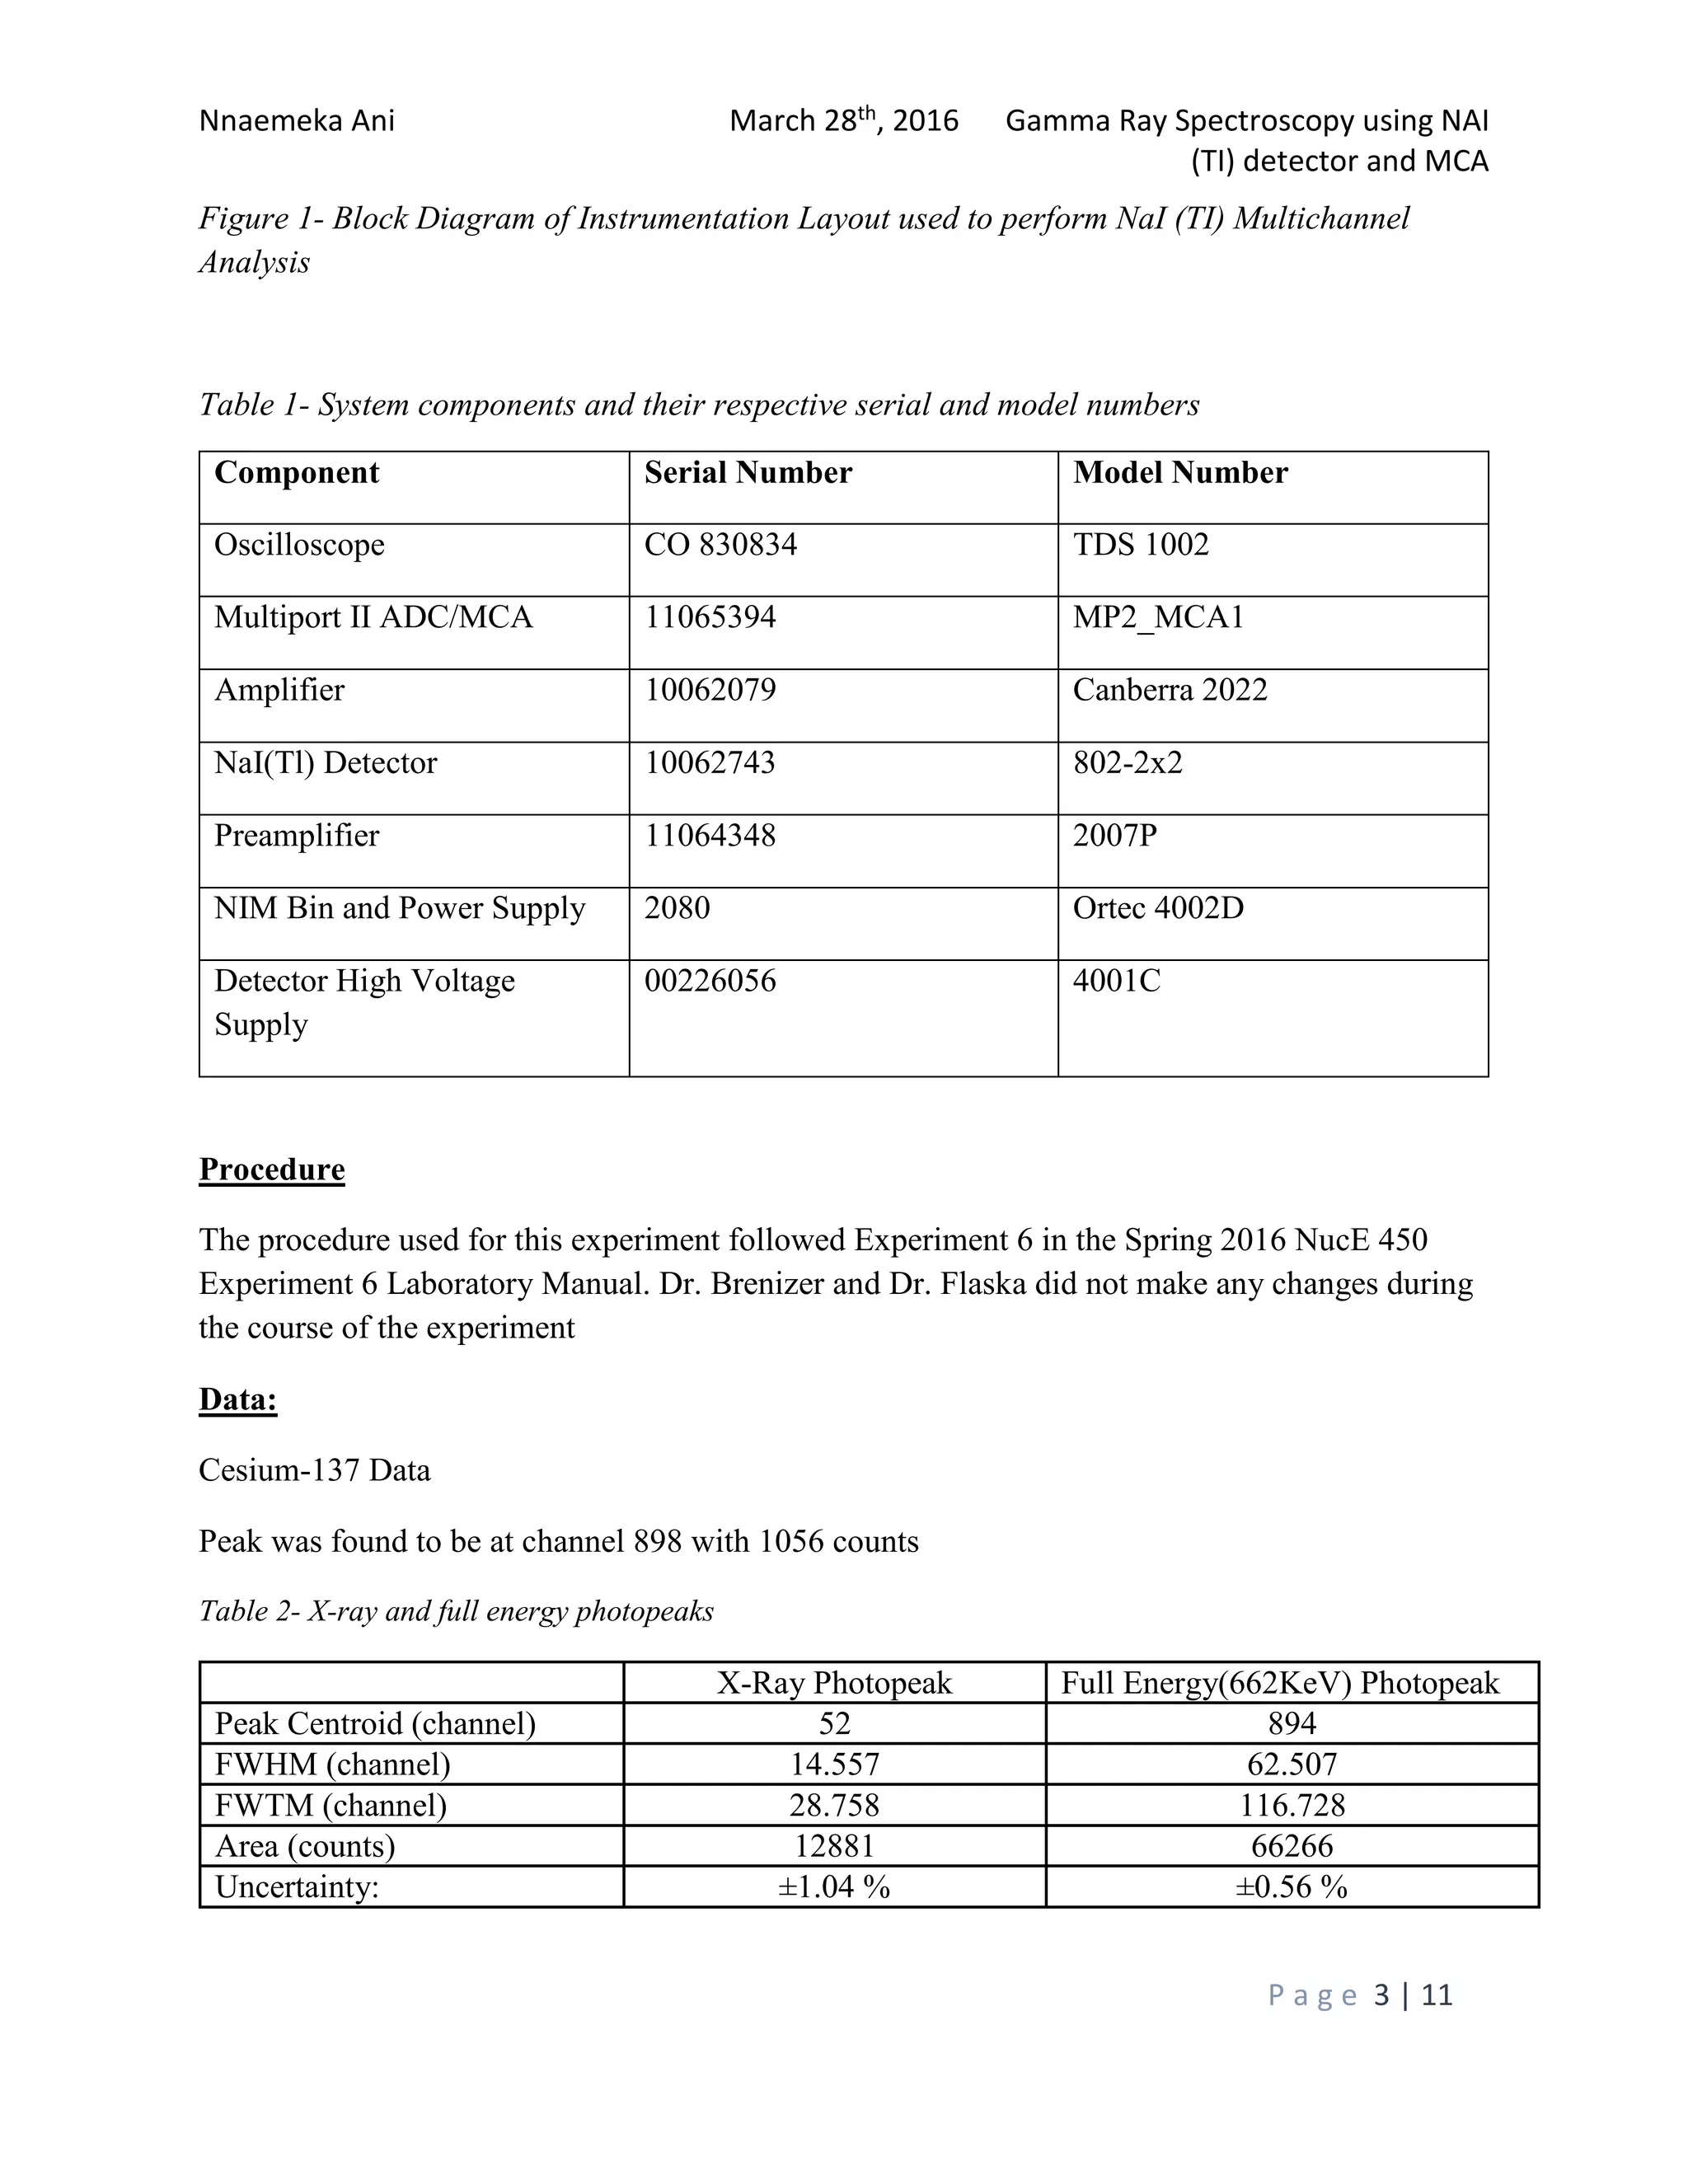
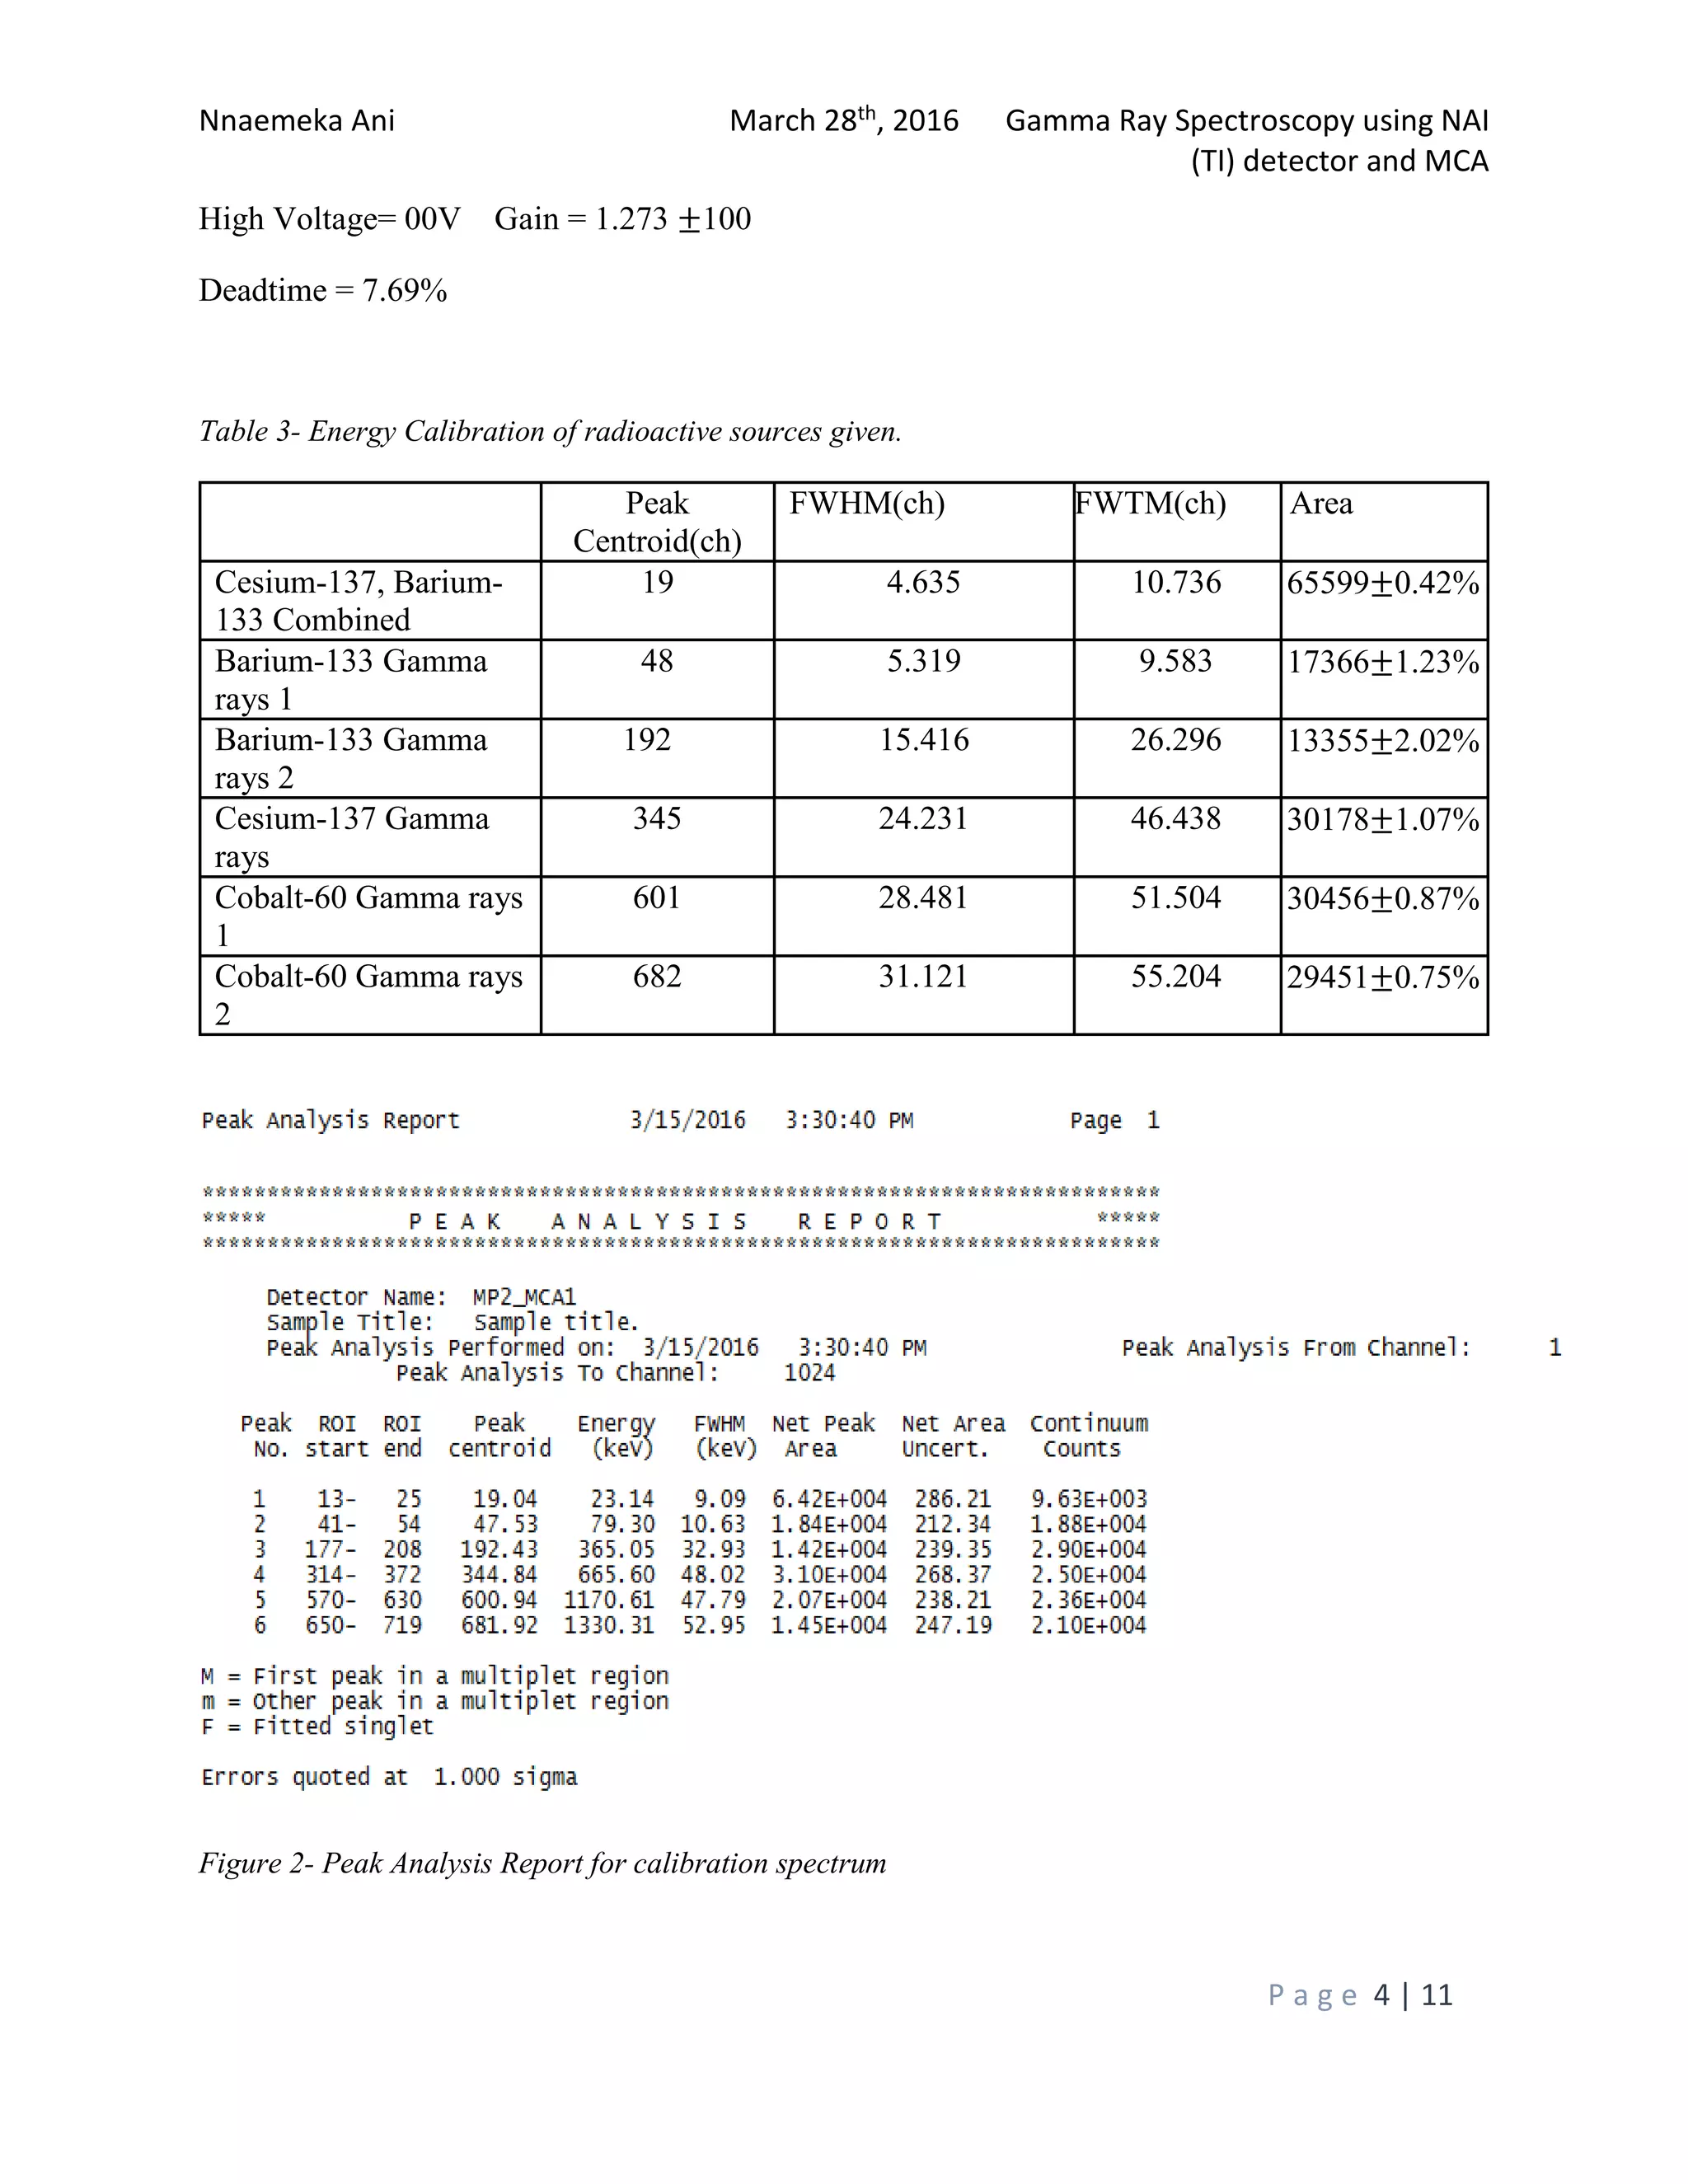
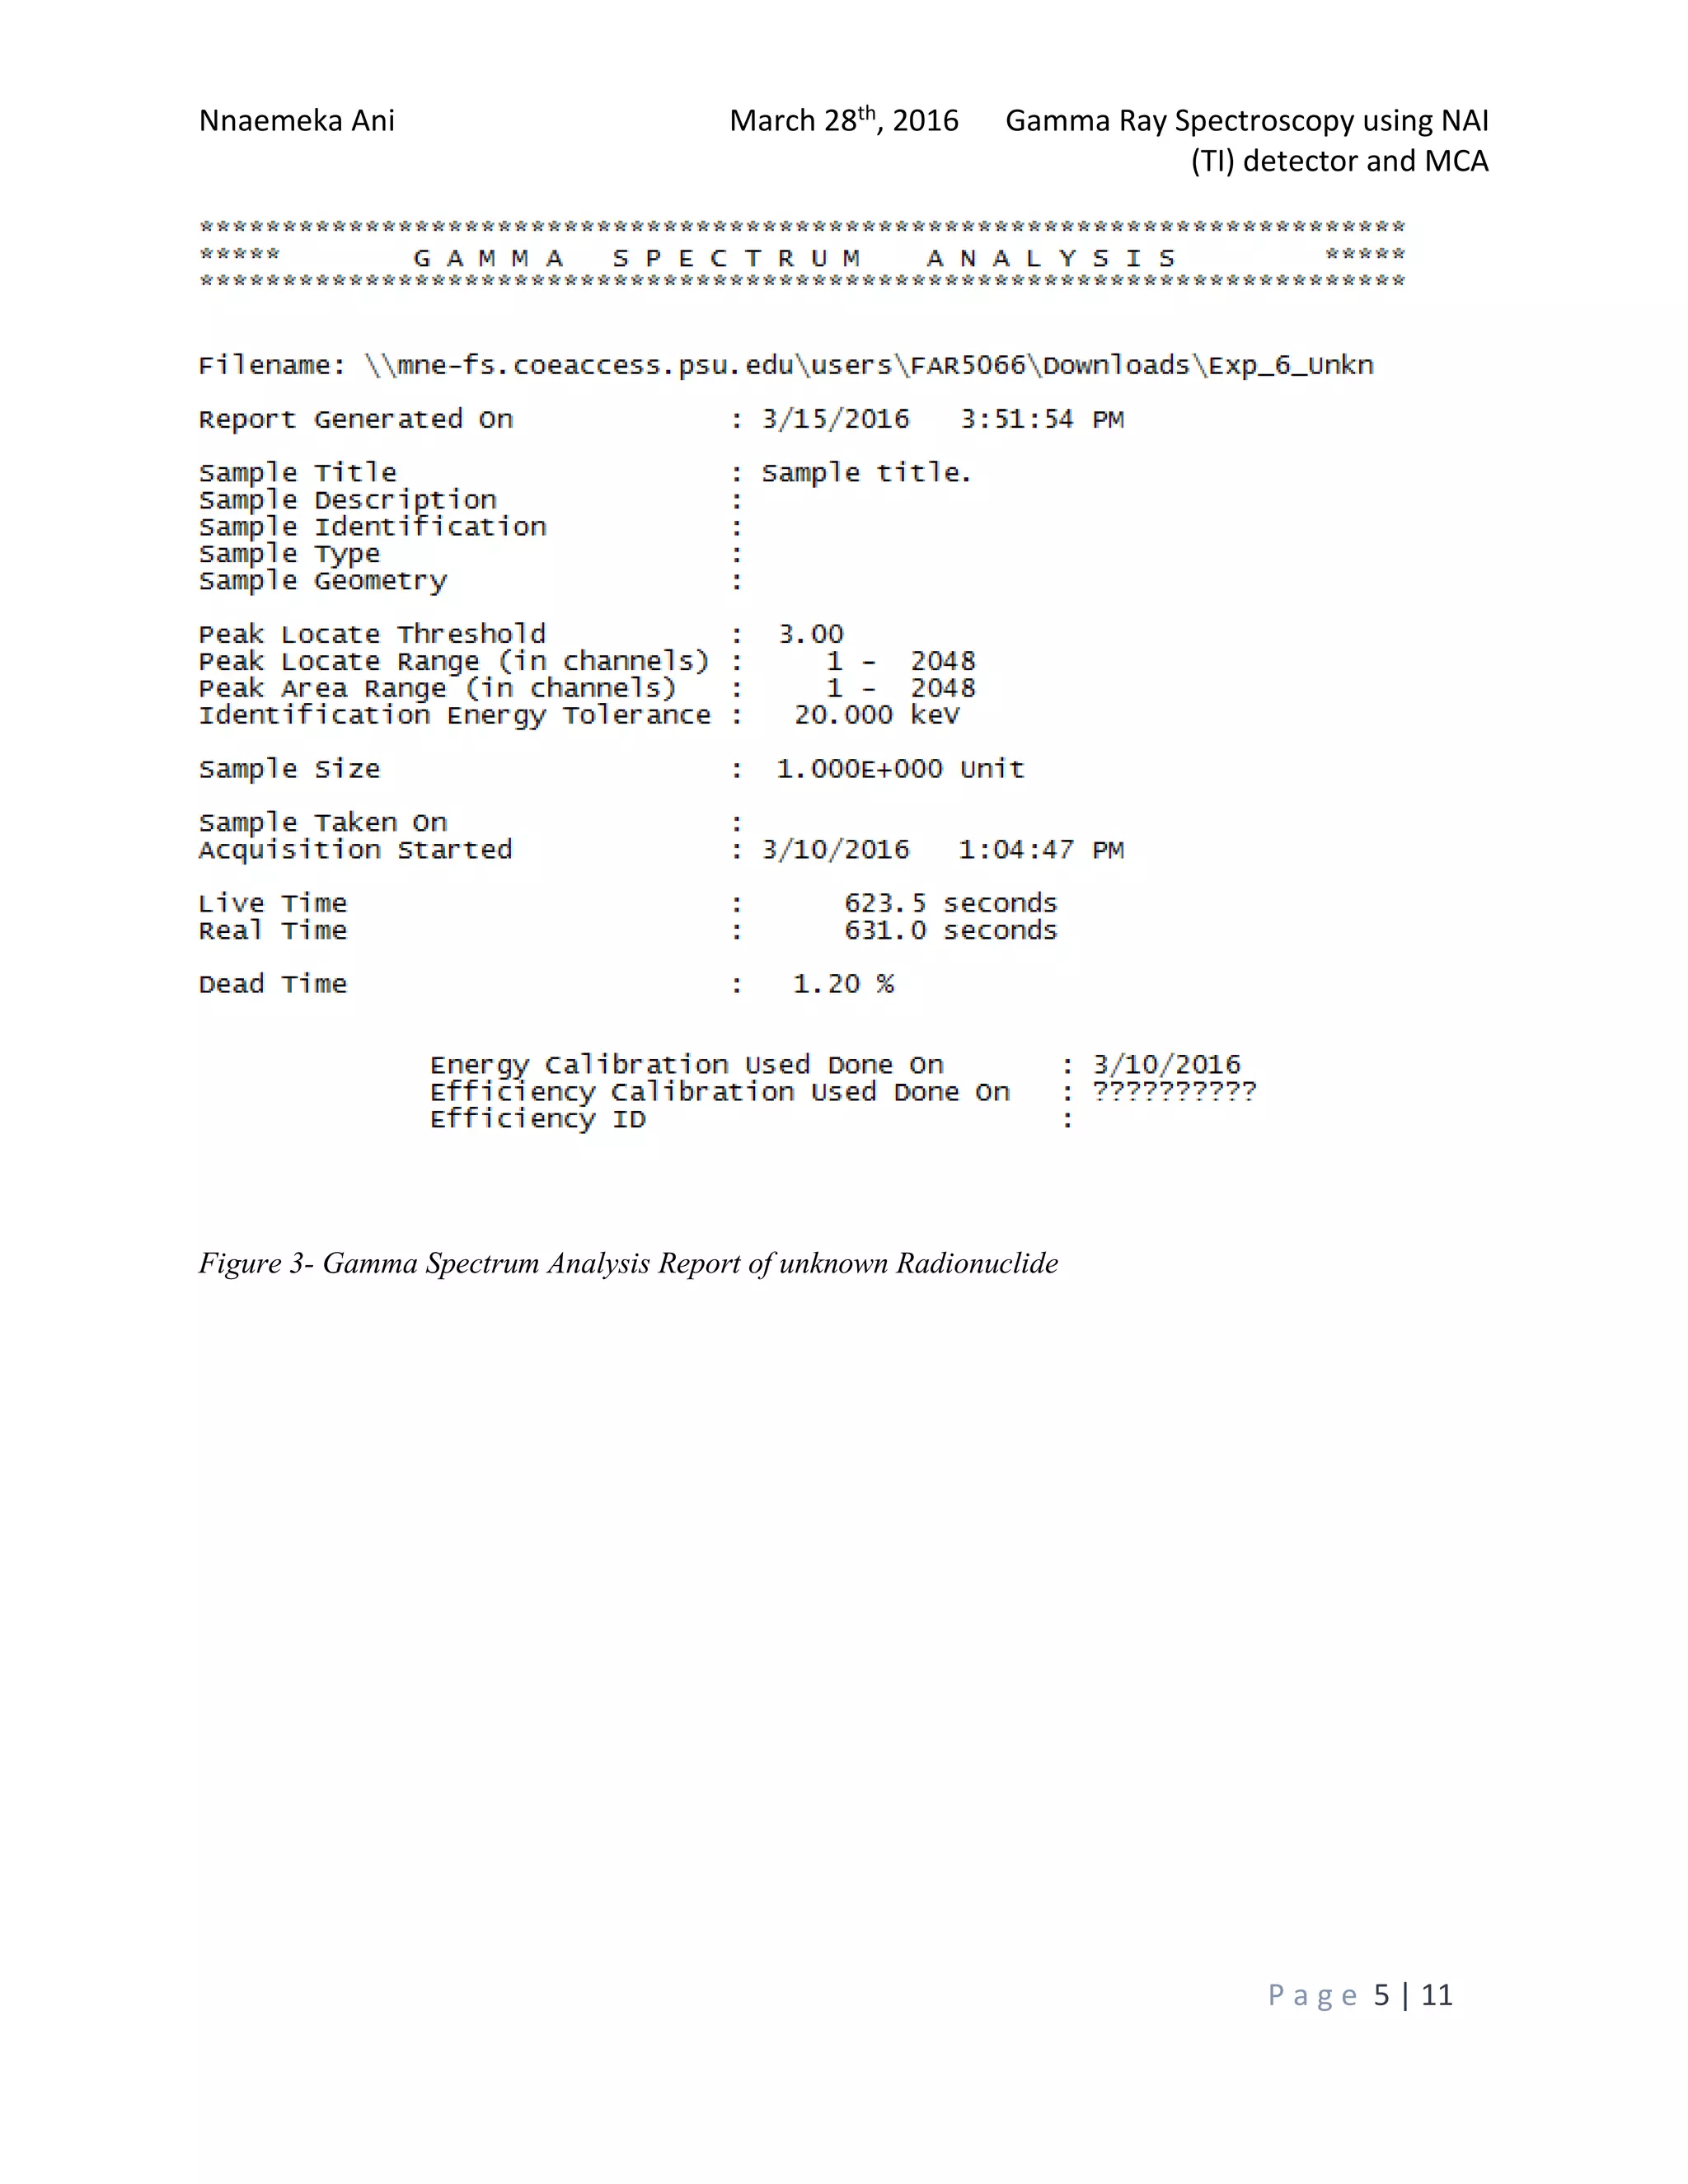
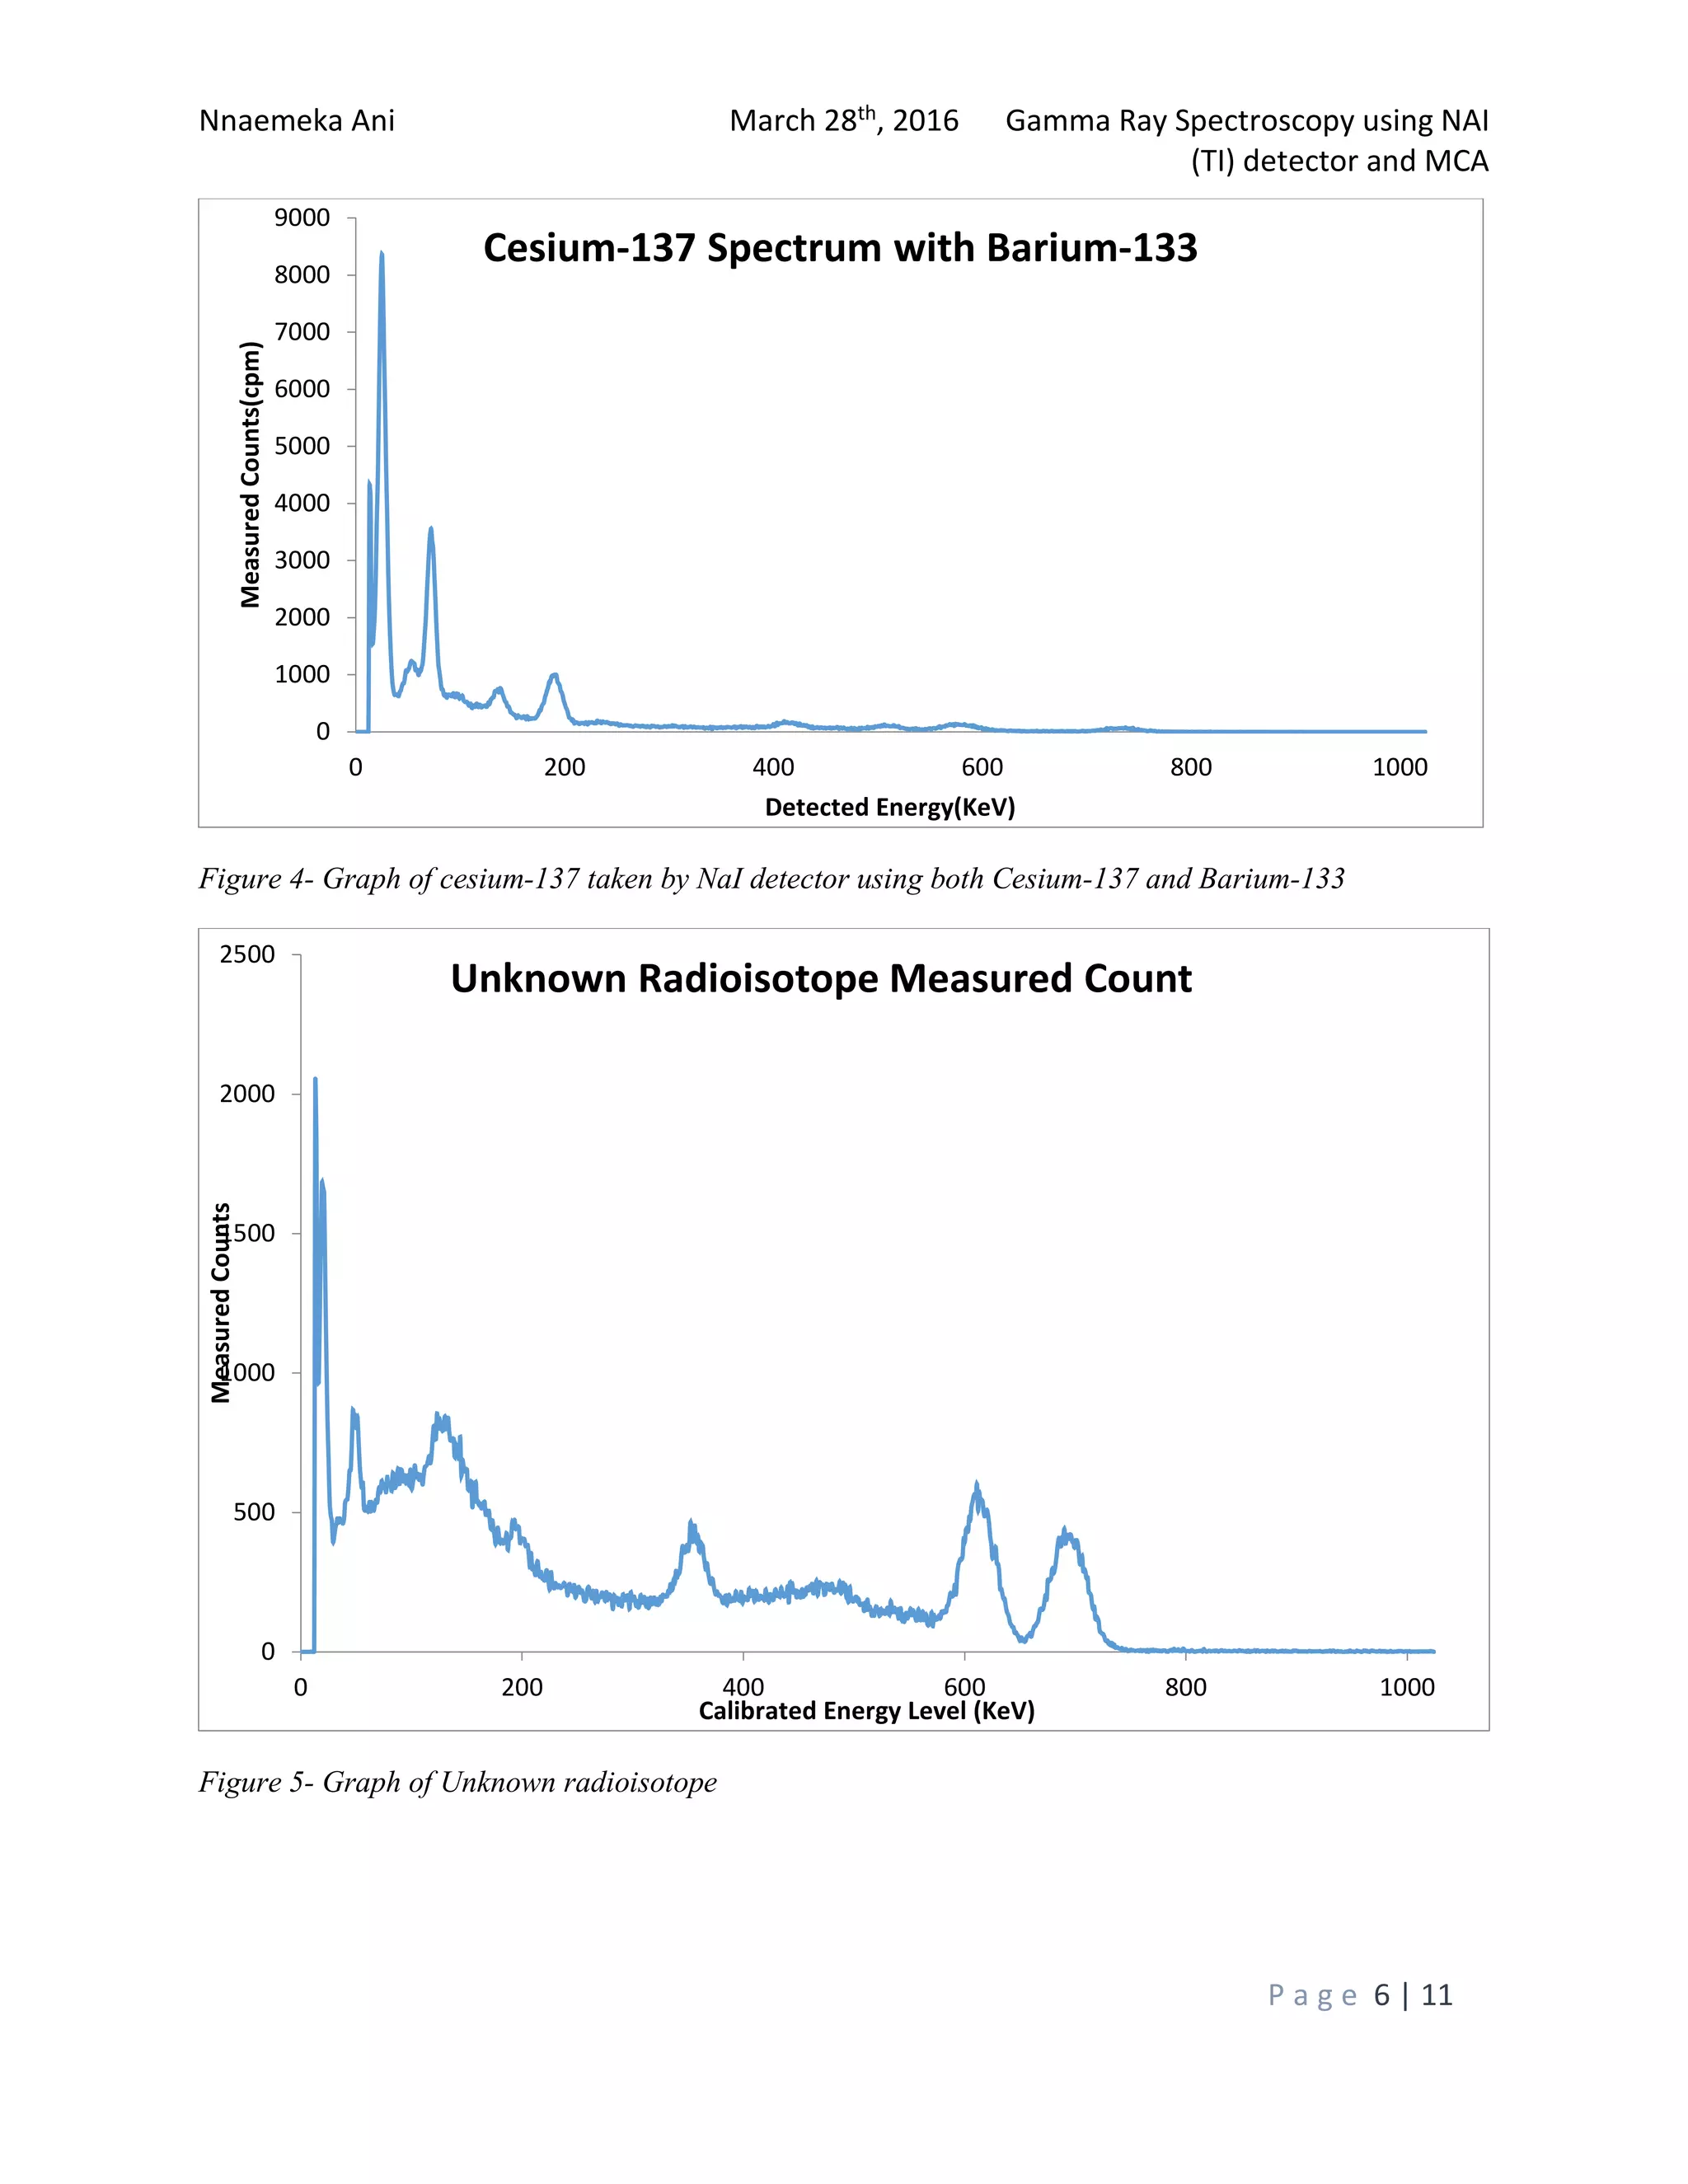
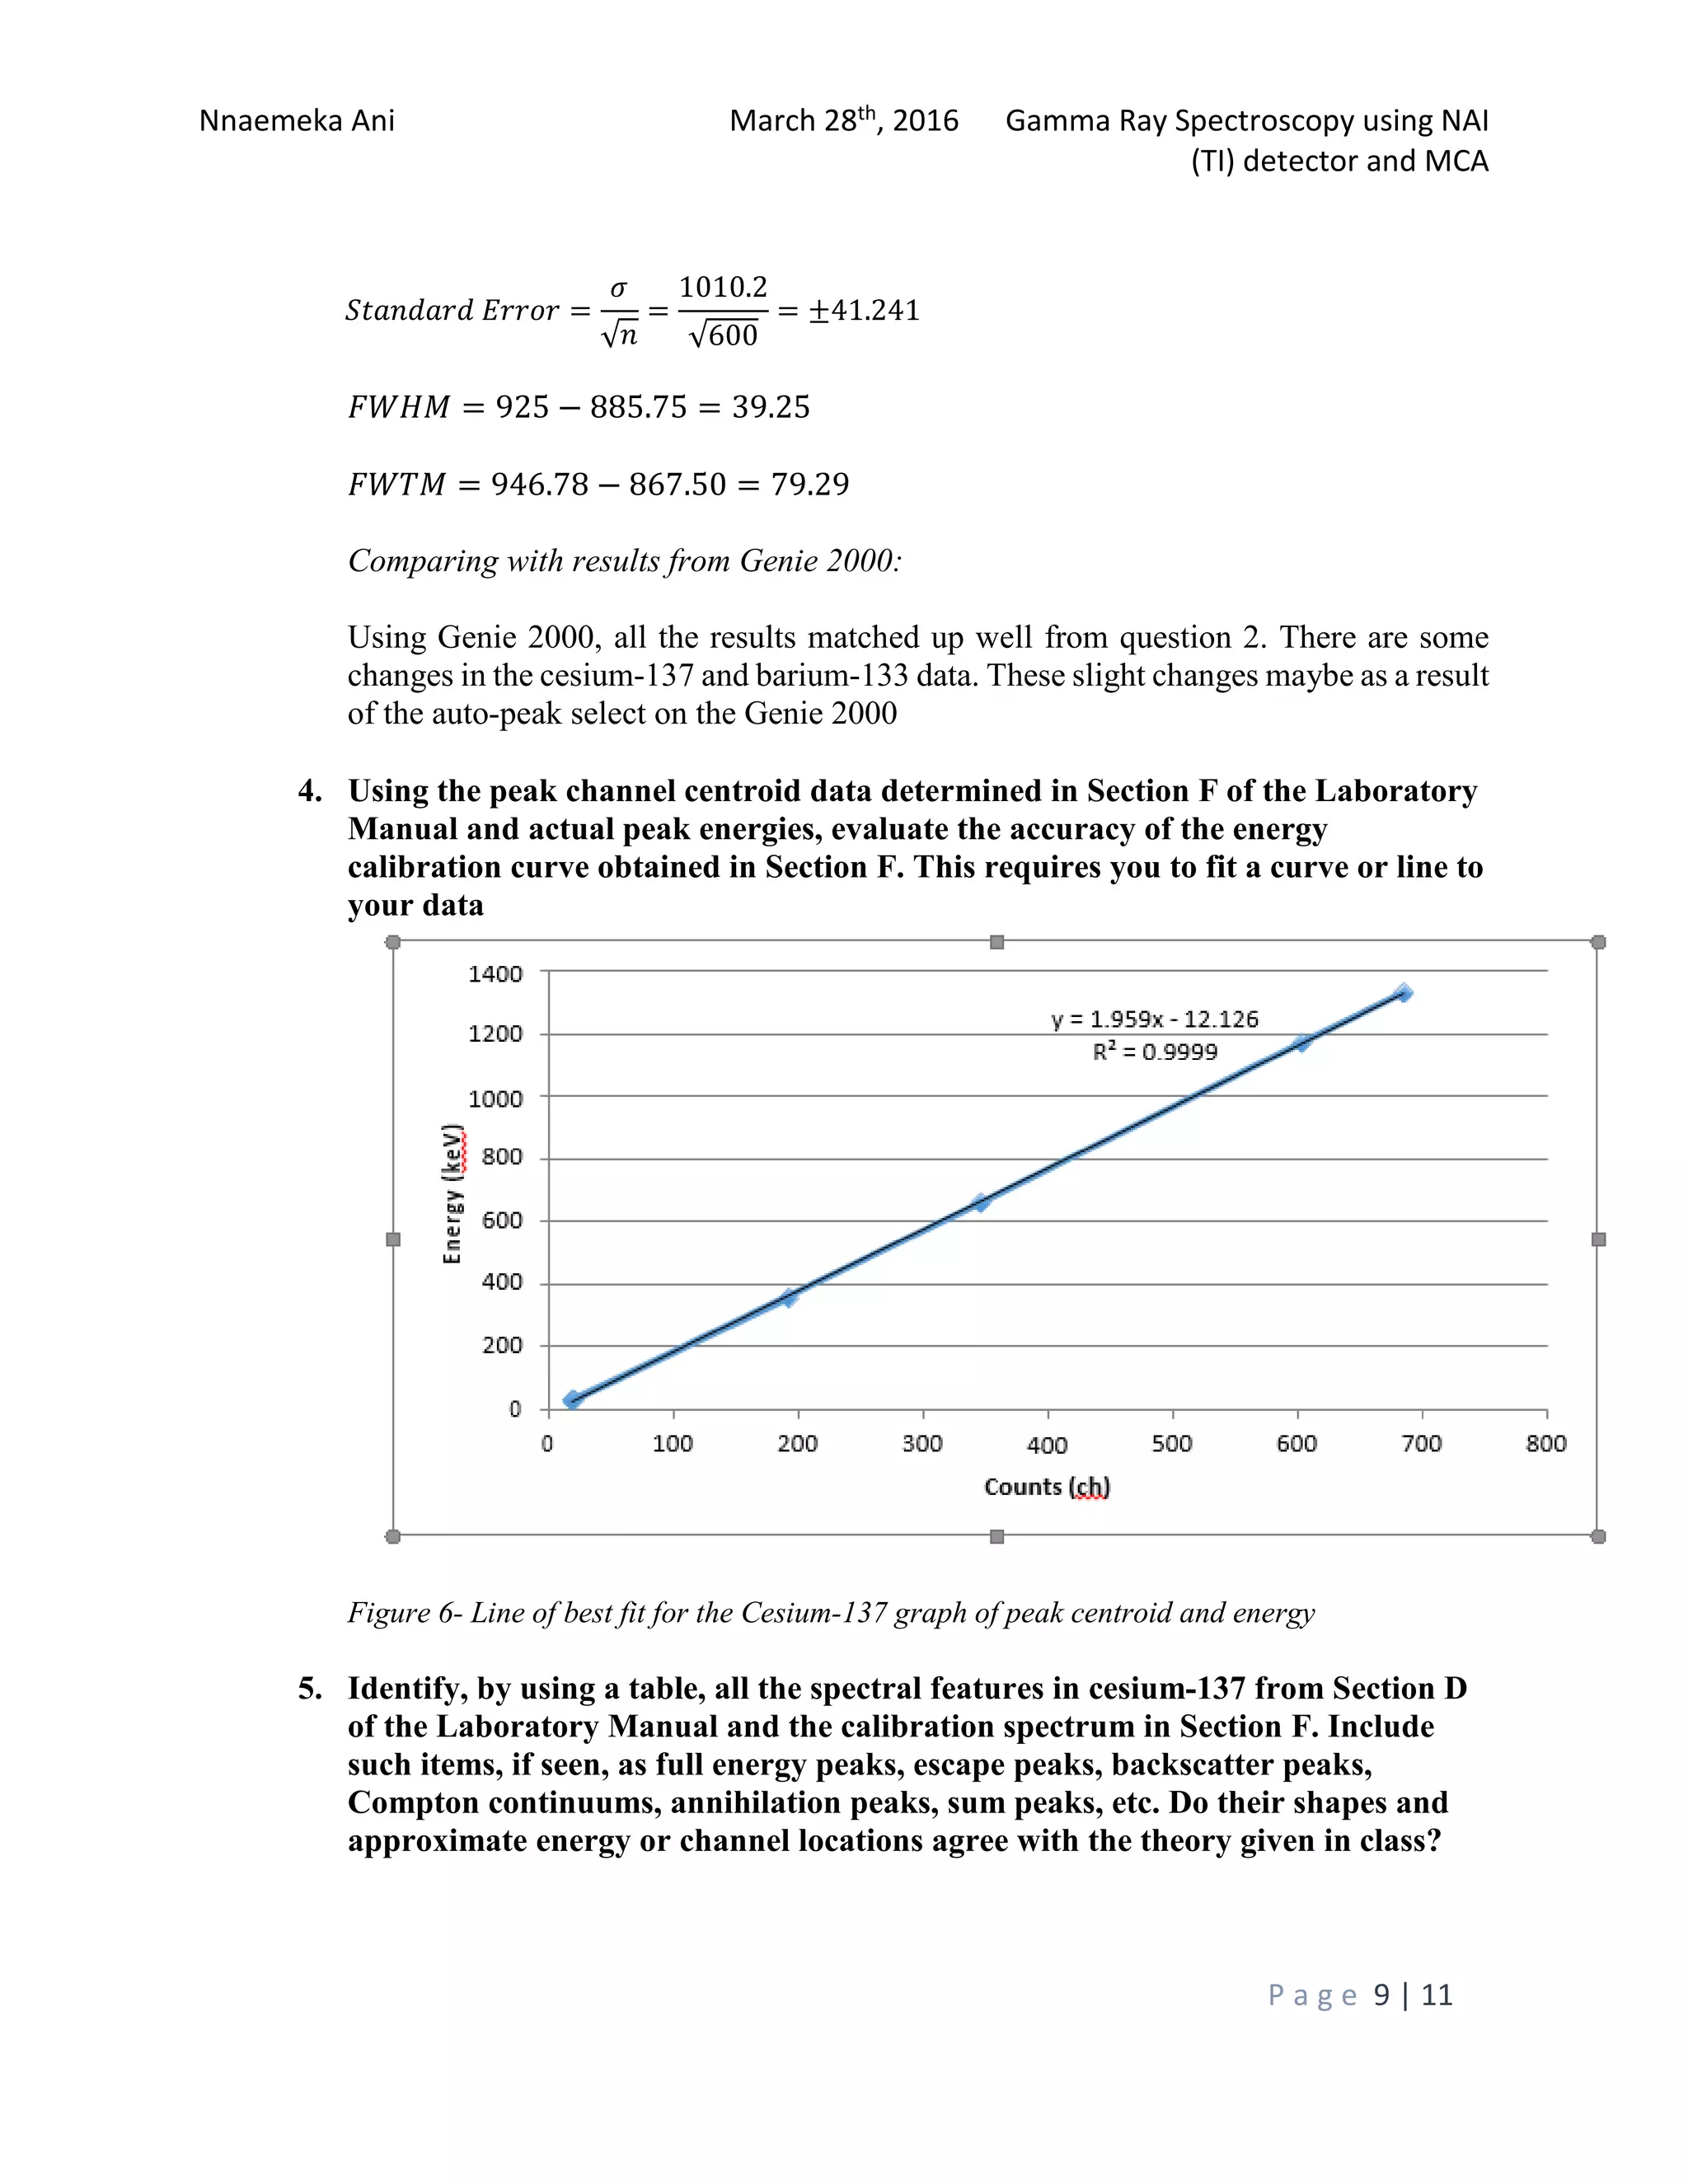
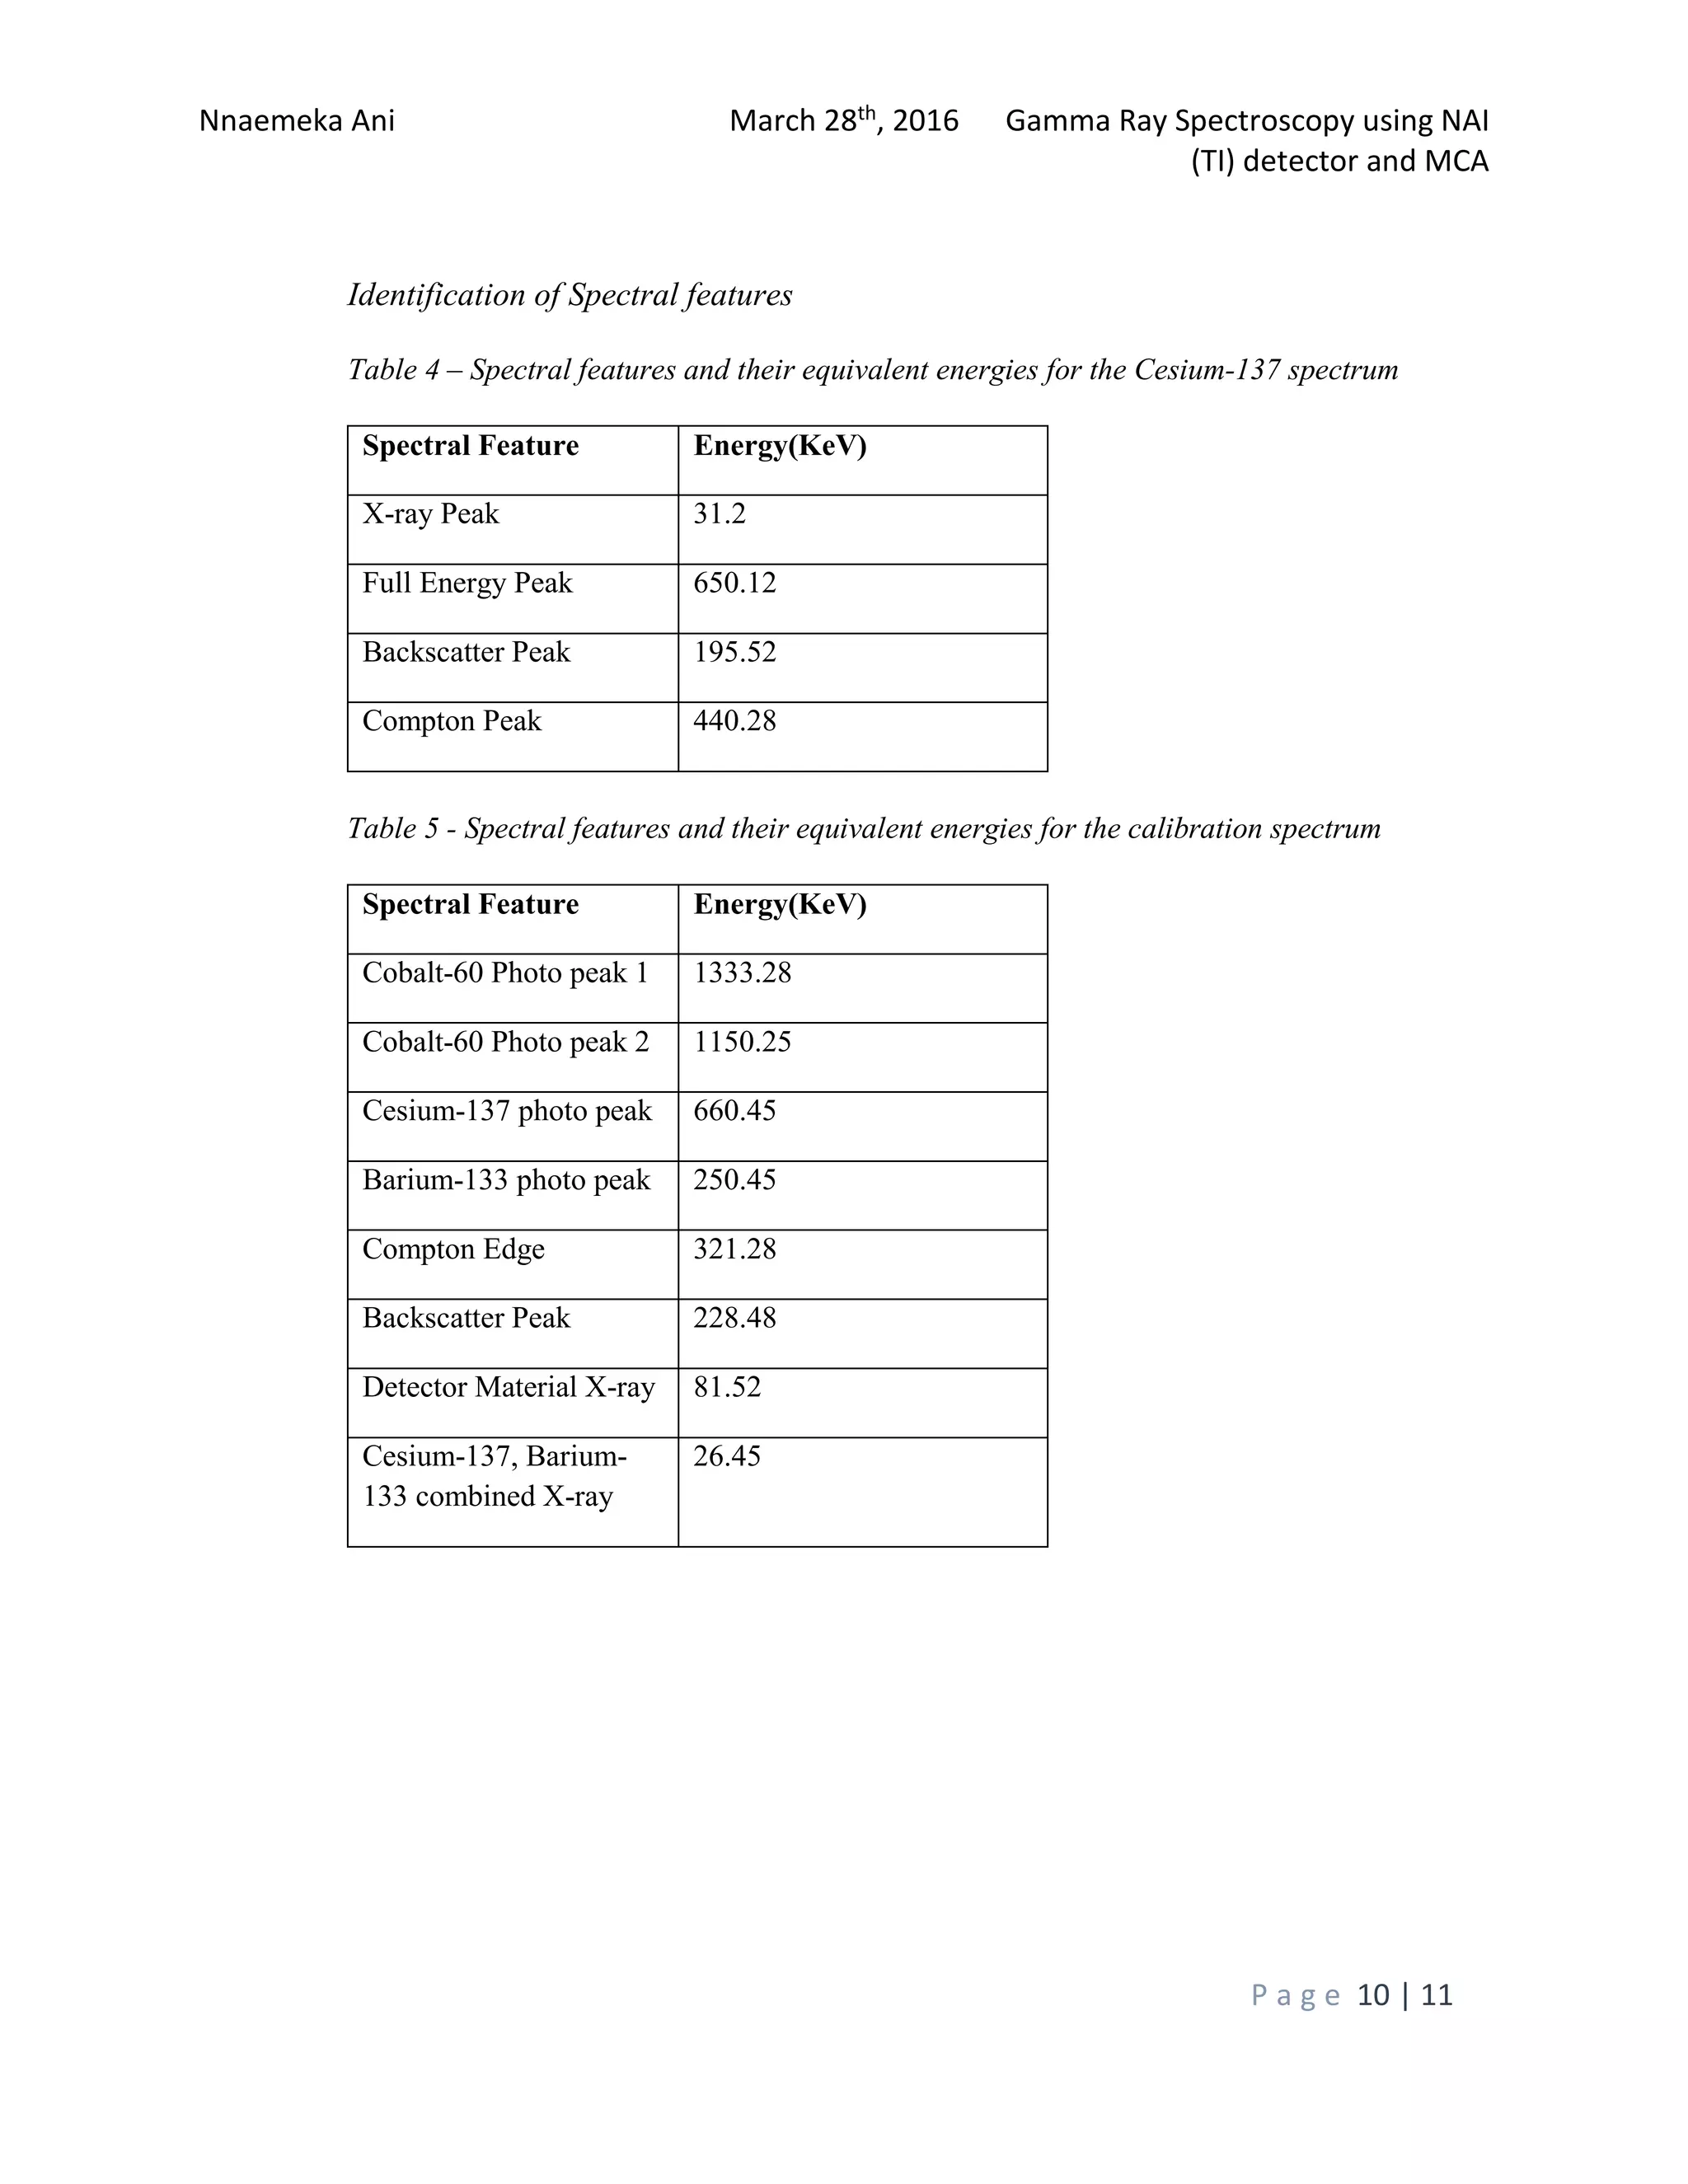
The document describes an experiment using a NaI(TI) detector and multi-channel analyzer to identify an unknown radioactive element. Students calibrated the analyzer using cobalt-60, cesium-137, and barium-133 sources. Analysis of calibration data allowed the unknown source to be identified as sodium-22 based on its 1,115 keV gamma ray peak. The experiment demonstrated that gamma-ray spectroscopy is effective for radioactive source identification.
Title of the ReportA. Partner, B. Partner, and C. Partner.docxjuliennehar
Title of the Report
A. Partner, B. Partner, and C. Partner
Abstract
The report abstract is a short summary of the report. It is usually one paragraph (100-200 words) and should include
about one or two sentences on each of the following main points:
1. Purpose of the experiment
2. Key results
3. Major points of discussion
4. Main conclusions
Tip: It may be helpful if you complete the other sections of the report before writing the abstract. You can basically
draw these four main points from them.
example: In this experiment a very important physical effect was studied by measuring the dependence of a quantity
V of the quantity X for two different sample temperatures. The experimental measurements confirmed the quadratic
dependence V = kX2 predicted by Someone’s first law. The value of the mystery parameter k = 15.4 ± 0.5 s was
extracted from the fit. This value is not consistent with the theoretically predicted ktheory = 17.34 s. This discrepancy
is attributed to low efficiency of the V -detector.
1. Introduction
This section is also often referred to as the purpose or
plan. It includes two main categories:
Purpose: It usually is expressed in one or two sen-
tences that include the main method used for accomplish-
ing the purpose of the experiment.
Ex: The purpose of the experiment was to determine
the mass of an ion using the mass spectrometer.
Background and theory: related to the experiment.
This includes explanations of theories, methods or equa-
tions used, etc.; for the example above, you might want to
explain the theory behind mass spectrometer and a short
description about the process and setup you used in the
experiment. It is important to remember that report needs
to be as straightforward as possible. You should comprise
only as much information as needed for the reader to un-
derstand the purpose and methods. Your should also pro-
vide additional information such as a hypothesis (what is
expected to happen in the experiment based on the theory)
or safety information. The main focus of the introduction
mainly focuses on supporting the reader to understand the
purpose, methods, and reasons for these particular meth-
ods.Purpose of the experiment
Example:
Calculation of the pressure coefficient Cp
From the lectures notes, Cp can be obtained by the eq.
(1)
− Cp =
P − P∞
1
2 ∗ ρ ∗ U2∞
(1)
Where P and P∞ are respectively the local pressure and
the atmosphere pressure far away. U∞ is the wind velocity
Preprint submitted to supervisor March 4, 2020
of the wind tunnel.
Calculation of the lift coefficient CL
First, the expression for the pressure force acting nor-
mal to the chord line is given in the lecture notes as eq.(2),
Cn =
∮
Cp(−n̂ ∗ ŷ)dl, (2)
with Cp the coefficient of lift and n̂ the unit normal
vector pointing out of the surface, ŷ is the unit vector in
the direction normal to the chord line. dl is the length of an
infinitesimal line element. Similarly, the axial component
can be express as eq.(3)
Ca ...
Performance comparison of automatic peak detection for signal analyserjournalBEEI
The aim of this paper is to propose a new peak detection method for a portable device, which know as modified automatic threshold peak detection (M-ATPD). M-ATPD evolves out of ATPD with a focus on reducing computational time. The proposed method replaces the clustering threshold calculation in ATPD with a standard deviation threshold calculation. M-ATPD reduces computational time by 2 times faster compared to ATPD for control signal and 8.65 times faster compared to ATPD for raw biosignals. Modified ATPD also shows a slight improvement in terms of detection error, with a decrease of about 6.66% to 13.33% in peak detection of noise signals. Modified ATPD successfully fixes the error of peak detection on pulse control signals associated with ATPD. For raw biosignals, in total M-ATPD achieved 19.41% lower detection error compare to ATPD.
Sparse Representation for Fetal QRS Detection in Abdominal ECG RecordingsRiccardo Bernardini
Slideshow of the presentation given at EHB 2015
In this work, we consider the problem of detection of fetal heart beats from abdominal, non-invasive mixture recordings. We propose a new method for the separation of maternal and fetal beats based on the sparse decomposition in an over-complete dictionary of Gaussian-like functions. To increase the detection capability, we also use Independent Component Analysis (ICA) after maternal template subtraction. We show that the proposed detection method can be applied on the original mixture with a sensitivity close to 95%. Moreover, our method may be used also for single channel abdominal ECG signals, and also used in real-time applications.
Tennessee State University College of Engineering, Tec.docxmehek4
Tennessee State University
College of Engineering, Technology, and Computer Science
Department of Electrical and Computer Engineering
ENGR 2001
CIRCUITS I LAB
Section 01
Lab 1
Low Pass/High Pass Filters
Transient and AC Analysis
Beyonce Smith
Lab Partner: Will Knowles
Instructor: Dr. Carlotta A. Berry
Lab Performed: October 16, 2000
Report Submitted: October 23, 2000
2
ABSTRACT
The purpose of this experiment was to design a high pass and low pass filter that
attenuates a 1 kHz signal by 20 db. Test and evaluate this circuit built in a laboratory to
determine how closely actual values correlate to theoretical values. Part of this analysis
will include observing the transient and AC characteristics by using an oscilloscope,
digital multimeter and function generator. The theory used to design this filter included
Ohm’s law, the voltage divider rule and Laplace transforms. The results were shown to
correlate closely with the theoretical values and therefore were assumed to be
significant.
3
TABLE OF CONTENTS
Abstract
I. Objective
II. Theory
III. Equipment
IV. Apparatus
V. Circuits
VI. Procedure
VII. Graphs
VIII. Results, Conclusions, and Recommendations
Appendix A Data
Appendix B Formulas and Sample Calculations
Appendix C References and Laboratory Instruction Sheet
4
I. Objective:
The purpose of this experiment was to explore the behavior of a low pass filter
and high pass filter over a range of frequencies with a given break frequency.
II. Theory:
A filter is a device that attenuates a range of frequencies and passes a range of
frequencies. There are several types of filters including low pass, high pass,
band pass and band reject. The range of frequencies that are passed by a filter
are called the pass band. The frequency where the relationship between input
and output is equal to .707 is called the break frequency or half power point. An
example of a high pass filter would be a tweeter on a speaker in a car. An
example of a low pass filter would be the bass from a speaker in a car. An
example of a band pass filter would be the selector for a radio station. In this
experiment the low pass and high pass filter will be explored. Equation (1) is the
transfer function relationship for the high pass filter. Equation (2) is the low pass
transfer function for the low pass filter.
H(S) =
sRC
sRC
sV
sV
i
o
1)(
)(
(1)
H(s) =
sRCsV
sV
i
o
1
1
)(
)(
(2)
III. Equipment:
Breadboard
Wire leads
Digital Oscilloscope
Digital Multimeter
Function Generator
Power Supply
Resistors (1 k, 5 k)
Capacitors (.01 F, 1 F)
741 Op-amp
IV. Apparatus:
The apparatus used to measure the transient and AC response of a circuit
includes the breadboard with the resistor and capacitor positioned for a low pass
or high pass filter, ...
International Journal of Engineering Research and DevelopmentIJERD Editor
Electrical, Electronics and Computer Engineering,
Information Engineering and Technology,
Mechanical, Industrial and Manufacturing Engineering,
Automation and Mechatronics Engineering,
Material and Chemical Engineering,
Civil and Architecture Engineering,
Biotechnology and Bio Engineering,
Environmental Engineering,
Petroleum and Mining Engineering,
Marine and Agriculture engineering,
Aerospace Engineering.
First results from the full-scale prototype for the Fluorescence detector Arr...Toshihiro FUJII
The Fluorescence detector Array of Single-pixel Telescopes (FAST) is a design concept for the next generation of ultrahigh-energy cosmic ray (UHECR) observatories, addressing the requirements for a large-area, low-cost detector suitable for measuring the properties of the highest energy cosmic rays. In the FAST design, a large field of view is covered by a few pixels at the focal plane of a mirror or Fresnel lens. Motivated by the successful detection of UHECRs using a prototype comprised of a single 200 mm photomultiplier-tube and a 1 m2 Fresnel lens system [Astropart.Phys. 74 (2016) 64-72], we have developed a new full-scale prototype consisting of four 200 mm photomultiplier-tubes at the focus of a segmented mirror of 1.6 m in diameter. In October 2016 we installed the full-scale prototype at the Telescope Array site in central Utah, USA, and began steady data taking. We report on first results of the full-scale FAST prototype, including measurements of artificial light sources, distant ultraviolet lasers, and UHECRs.
35th International Cosmic Ray Conference — ICRC2017 18th July, 2017
Bexco, Busan, Korea
Computer aided design of communication systems / Simulation Communication Sys...Makan Mohammadi
The report introduces how to use computer simulation in the design of physical layer transmission protocols that are too complex for a purely analytical approach. The goal of the report is to offer the theoretical and practical tools for performing modeling, analysis, and design of the physical level of wireless transmission systems including cellular and personal communication systems, satellite systems and radio relay links. This course is useful for telecommunication systems designers, ICT researchers and experts in the development and design of telecommunication physical layer protocols.
Letter to MREC - application to conduct studyAzreen Aj
Application to conduct study on research title 'Awareness and knowledge of oral cancer and precancer among dental outpatient in Klinik Pergigian Merlimau, Melaka'
The dimensions of healthcare quality refer to various attributes or aspects that define the standard of healthcare services. These dimensions are used to evaluate, measure, and improve the quality of care provided to patients. A comprehensive understanding of these dimensions ensures that healthcare systems can address various aspects of patient care effectively and holistically. Dimensions of Healthcare Quality and Performance of care include the following; Appropriateness, Availability, Competence, Continuity, Effectiveness, Efficiency, Efficacy, Prevention, Respect and Care, Safety as well as Timeliness.
TOP AND BEST GLUTE BUILDER A 606 | Fitking FitnessFitking Fitness
"Feature:
• Intelligent Ergonomically Design Glute Builder Is A Must Have For Those Looking To Target Their Gluteal Muscles And Hamstrings With Precision.
• The Ability To Adjust The Starting Position, This Machine Allows For A More Targeted Workout That Is Tailored To Your Specific Needs.
• Spacious And Supportive Cushioned Seat Provide Added Comfort And Stability During Your Workout."
Get more information visit on:- www.fitking.in
Our mail I.D:-care@fitking.in, fitking.in@gmail.com
Call us at :- 9958880790, 9870336406, 8800695917
Trauma Outpatient Center is a comprehensive facility dedicated to addressing mental health challenges and providing medication-assisted treatment. We offer a diverse range of services aimed at assisting individuals in overcoming addiction, mental health disorders, and related obstacles. Our team consists of seasoned professionals who are both experienced and compassionate, committed to delivering the highest standard of care to our clients. By utilizing evidence-based treatment methods, we strive to help our clients achieve their goals and lead healthier, more fulfilling lives.
Our mission is to provide a safe and supportive environment where our clients can receive the highest quality of care. We are dedicated to assisting our clients in reaching their objectives and improving their overall well-being. We prioritize our clients' needs and individualize treatment plans to ensure they receive tailored care. Our approach is rooted in evidence-based practices proven effective in treating addiction and mental health disorders.
Deep Leg Vein Thrombosis (DVT): Meaning, Causes, Symptoms, Treatment, and Mor...The Lifesciences Magazine
Deep Leg Vein Thrombosis occurs when a blood clot forms in one or more of the deep veins in the legs. These clots can impede blood flow, leading to severe complications.
Under Pressure : Kenneth Kruk's StrategyKenneth Kruk
Kenneth Kruk's story of transforming challenges into opportunities by leading successful medical record transitions and bridging scientific knowledge gaps during COVID-19.
CHAPTER 1 SEMESTER V PREVENTIVE-PEDIATRICS.pdfSachin Sharma
This content provides an overview of preventive pediatrics. It defines preventive pediatrics as preventing disease and promoting children's physical, mental, and social well-being to achieve positive health. It discusses antenatal, postnatal, and social preventive pediatrics. It also covers various child health programs like immunization, breastfeeding, ICDS, and the roles of organizations like WHO, UNICEF, and nurses in preventive pediatrics.
The Importance of Community Nursing Care.pdfAD Healthcare
NDIS and Community 24/7 Nursing Care is a specific type of support that may be provided under the NDIS for individuals with complex medical needs who require ongoing nursing care in a community setting, such as their home or a supported accommodation facility.
The global radiation oncology market size reached US$ 8.1 Billion in 2023. Looking forward, IMARC Group expects the market to reach US$ 14.5 Billion by 2032, exhibiting a growth rate (CAGR) of 6.5% during 2024-2032.
More Info:- https://www.imarcgroup.com/radiation-oncology-market
International Cancer Survivors Day is celebrated during June, placing the spotlight not only on cancer survivors, but also their caregivers.
CANSA has compiled a list of tips and guidelines of support:
https://cansa.org.za/who-cares-for-cancer-patients-caregivers/
Empowering ACOs: Leveraging Quality Management Tools for MIPS and BeyondHealth Catalyst
Join us as we delve into the crucial realm of quality reporting for MSSP (Medicare Shared Savings Program) Accountable Care Organizations (ACOs).
In this session, we will explore how a robust quality management solution can empower your organization to meet regulatory requirements and improve processes for MIPS reporting and internal quality programs. Learn how our MeasureAble application enables compliance and fosters continuous improvement.
Empowering ACOs: Leveraging Quality Management Tools for MIPS and Beyond
Gamma_Ray_Spectroscopy_Using_a_NaI_TI_De.pdf
1. P a g e 1 | 11
Gamma-Ray Spectroscopy Using a NaI (TI) Detector and Multi-Channel Analyzer
Lab Report Prepared by Nnaemeka Ani
NUC E 450, Radiation Detection and Measurement
Section 003
Team Members:
Francois Ross
Luke Merski
Kirk Brown
Date performed: 03/15/2016
Report due: 03/29/2016
Report turned in: 03/29/2016
2. Nnaemeka Ani March 28th, 2016 Gamma Ray Spectroscopy using NAI
(TI) detector and MCA
P a g e 2 | 11
Abstract
The lab uses a Multi-channel analyzer and computer software Genie 2000 to identify an
unknown element. We are to calibrate the software using cobalt-60, cesium-137 and barium-133.
Gamma-ray spectroscopy using this setup was very effective.
Introduction
In Experiment 5, we utilized a Single Channel Analyzer to develop a gamma ray spectrum for
Cs137 and Co60. Taking each count at different voltage windows is a long and tedious task, and
is impractical for recording the spectrum using many points. In this experiment, we utilize a
Multi-Channel Analyzer (MCA) which allows us to take counts for several hundred channels at
once, creating a more reliable, more accurate spectrum plot. The software we used for this
experiment was Genie 2000, a spectroscopy software that allows for measurement of photo
peaks, and calculates data for specific user-specified regions. The MCA in conjunction with
Genie allows us to accurately identify unknown radio nuclides through measuring reference
samples and matching the photo peaks of the unknown nuclide with known sources.
Theory
The Multi-Channel Analyzer is a computer based spectroscopy tool that can be used to identify
photo peaks for a nuclide, and thus be able to identify what an element is. Whereas the Single-
Channel Analyzer can only measure the counts for a single window at a time, the Multi-Channel
Analyzer has the ability to measure several hundred channels at once while retaining a very low
dead time.
Equipment
The system illustrated in Figure 1 was used to conduct this experiment. It consists of a Nal (Tl)
detector connected to both the Amplifier and the High Voltage Power Supply. The Multi-
Channel Analyzer (MCA) and the Oscilloscope were both connected to the Amplifier, and the
MCA connected straight to the computer. Model and serial numbers for each piece of equipment
are labeled in Table 1.
Oscilloscope Personal Computer
Multiport II ADC/MCA
Amplifier
Shelf Box
NaI (Tl)
Detector
with
Preamp
High Voltage Power Supply
O
O
O
I
I
I
Preamp Power
3. Nnaemeka Ani March 28th, 2016 Gamma Ray Spectroscopy using NAI
(TI) detector and MCA
P a g e 3 | 11
Figure 1- Block Diagram of Instrumentation Layout used to perform NaI (TI) Multichannel
Analysis
Table 1- System components and their respective serial and model numbers
Component Serial Number Model Number
Oscilloscope CO 830834 TDS 1002
Multiport II ADC/MCA 11065394 MP2_MCA1
Amplifier 10062079 Canberra 2022
NaI(Tl) Detector 10062743 802-2x2
Preamplifier 11064348 2007P
NIM Bin and Power Supply 2080 Ortec 4002D
Detector High Voltage
Supply
00226056 4001C
Procedure
The procedure used for this experiment followed Experiment 6 in the Spring 2016 NucE 450
Experiment 6 Laboratory Manual. Dr. Brenizer and Dr. Flaska did not make any changes during
the course of the experiment
Data:
Cesium-137 Data
Peak was found to be at channel 898 with 1056 counts
Table 2- X-ray and full energy photopeaks
X-Ray Photopeak Full Energy(662KeV) Photopeak
Peak Centroid (channel) 52 894
FWHM (channel) 14.557 62.507
FWTM (channel) 28.758 116.728
Area (counts) 12881 66266
Uncertainty: ±1.04 % ±0.56 %
4. Nnaemeka Ani March 28th, 2016 Gamma Ray Spectroscopy using NAI
(TI) detector and MCA
P a g e 4 | 11
High Voltage= 00V Gain = 1.273 ±100
Deadtime = 7.69%
Table 3- Energy Calibration of radioactive sources given.
Peak
Centroid(ch)
FWHM(ch) FWTM(ch) Area
Cesium-137, Barium-
133 Combined
19 4.635 10.736 65599±0.42%
Barium-133 Gamma
rays 1
48 5.319 9.583 17366±1.23%
Barium-133 Gamma
rays 2
192 15.416 26.296 13355±2.02%
Cesium-137 Gamma
rays
345 24.231 46.438 30178±1.07%
Cobalt-60 Gamma rays
1
601 28.481 51.504 30456±0.87%
Cobalt-60 Gamma rays
2
682 31.121 55.204 29451±0.75%
Figure 2- Peak Analysis Report for calibration spectrum
5. Nnaemeka Ani March 28th, 2016 Gamma Ray Spectroscopy using NAI
(TI) detector and MCA
P a g e 5 | 11
Figure 3- Gamma Spectrum Analysis Report of unknown Radionuclide
6. Nnaemeka Ani March 28th, 2016 Gamma Ray Spectroscopy using NAI
(TI) detector and MCA
P a g e 6 | 11
Figure 4- Graph of cesium-137 taken by NaI detector using both Cesium-137 and Barium-133
Figure 5- Graph of Unknown radioisotope
0
1000
2000
3000
4000
5000
6000
7000
8000
9000
0 200 400 600 800 1000
Measured
Counts(cpm)
Detected Energy(KeV)
Cesium-137 Spectrum with Barium-133
0
500
1000
1500
2000
2500
0 200 400 600 800 1000
Measured
Counts
Calibrated Energy Level (KeV)
Unknown Radioisotope Measured Count
7. Nnaemeka Ani March 28th, 2016 Gamma Ray Spectroscopy using NAI
(TI) detector and MCA
P a g e 7 | 11
Analysis of Data or Results
1. Describe the effects on the cesium-137 spectrum caused by varying the various
MCA controls, gain, and the high voltage settings.
Effects on Varying MCA controls: When the MCA controls are varied, some changes
can be noticed. When there was an increment on the vertical scale past its maximum
value, it “wrapped around” and started again at the smallest value (which is the LOG
scale).
Effects on gain setting: When the gain setting was varied, some changes are noticed.
When the gain is increased, there is a decrease in the number of counts and an
increase in the dead time. Calibration was also altered to some extent.
Effects on high voltage setting: When high voltage setting is varied, some changes are
visible noticed. Photopeaks moved up and down the channels.
2. Using the cesium-137 spectrum data produced in Section D of the Laboratory
Manual and printed out in Section E of the Laboratory Manual, evaluate the
NaI(Tl) detector used in your experiment. Include in this evaluation the detector
resolution, peak symmetry, and peak-to-Compton ratio. How do your results
agree with those obtained in Experiment 5 and with the theoretical values?
Experiment 6 results
���� �������� =
����
����
=
79.285
39.25
= 2.02
���� �� ������� ����� =
����ℎ� �� ������ − 137 �ℎ�������
��� ℎ���ℎ� �� ������� �ℎ������
=
1262
180
= 7.01
�������� ������ ���������� =
����
���� ��������
∗ 100 =
925 − 855.75
834
∗ 100 = 8.3%
Experiment 5 results
���� �������� =
����
����
=
3.95 − 3.35
3.85 − 3.55
= 2
���� �� ������� ����� =
����ℎ� �� ������ − 137 �ℎ��������
��� ℎ���ℎ� �� ������� �ℎ�����
=
1184
179
= 6.61
�������� ������ ���������� =
����
���� ��������
∗ 100 =
3.85 − 3.55
3.75
∗ 100 = 8%
8. Nnaemeka Ani March 28th, 2016 Gamma Ray Spectroscopy using NAI
(TI) detector and MCA
P a g e 8 | 11
Comparing with Experiment 5 results:
In comparison with the results in experiment 5, it can be noticed that the data is
slightly different in all aspects. The true Compton shoulder was hidden by barium -
133. This was due to the fact that the operators had to be changed to function in a
different way. Everything in the data set for this experiment was within the minimum
standards. It was noticed that experiment 5 had better data. For instance the peak to
Compton ratio was 6.61 but for this experiment it is 7.01. Detector resolution for
experiment 5 was 8% but on this experiment it is 8.3%
Comparing with Theoretical values:
In comparison with theoretical values, it can be noticed that the values from this
experiment looked a bit off range. Theoretically, the detector resolution should be
within 7-8% but for this experiment it was 8.3%. Theoretically, peak symmetry
should be equal or less than 2 but in this experiment it was 2.02
3. Using either the cesium-137 peak data obtained in Section D of the Laboratory
Manual or one of the cobalt-60 peaks obtained in Section F of the Laboratory
Manual, use the procedures given in class to calculate peak centroid location,
gross and net peak areas and their standard errors, FWHM, FWTM, and peak
symmetry. How well do your values compare with those obtained by the Genie
2000 program for these values? Explain any differences.
���� �������� =
∑ �� ��
∑ ��
=
45919300
65599
= 700
����� ���� ���� =
∑ ��
���� �����ℎ
�=���� �����
�
= 30178.107
��� ���� ���� =
∑ ��
���� �����ℎ
�=���� �����
�
− ���� ���� = 30178.107 − 17366.123 = 12811.984
���� �������� =
����
����
=
110.45
54.79
= 2.02
9. Nnaemeka Ani March 28th, 2016 Gamma Ray Spectroscopy using NAI
(TI) detector and MCA
P a g e 9 | 11
�������� ����� =
�
√�
=
1010.2
√600
= ±41.241
���� = 925 − 885.75 = 39.25
���� = 946.78 − 867.50 = 79.29
Comparing with results from Genie 2000:
Using Genie 2000, all the results matched up well from question 2. There are some
changes in the cesium-137 and barium-133 data. These slight changes maybe as a result
of the auto-peak select on the Genie 2000
4. Using the peak channel centroid data determined in Section F of the Laboratory
Manual and actual peak energies, evaluate the accuracy of the energy
calibration curve obtained in Section F. This requires you to fit a curve or line to
your data
Figure 6- Line of best fit for the Cesium-137 graph of peak centroid and energy
5. Identify, by using a table, all the spectral features in cesium-137 from Section D
of the Laboratory Manual and the calibration spectrum in Section F. Include
such items, if seen, as full energy peaks, escape peaks, backscatter peaks,
Compton continuums, annihilation peaks, sum peaks, etc. Do their shapes and
approximate energy or channel locations agree with the theory given in class?
10. Nnaemeka Ani March 28th, 2016 Gamma Ray Spectroscopy using NAI
(TI) detector and MCA
P a g e 10 | 11
Identification of Spectral features
Table 4 – Spectral features and their equivalent energies for the Cesium-137 spectrum
Spectral Feature Energy(KeV)
X-ray Peak 31.2
Full Energy Peak 650.12
Backscatter Peak 195.52
Compton Peak 440.28
Table 5 - Spectral features and their equivalent energies for the calibration spectrum
Spectral Feature Energy(KeV)
Cobalt-60 Photo peak 1 1333.28
Cobalt-60 Photo peak 2 1150.25
Cesium-137 photo peak 660.45
Barium-133 photo peak 250.45
Compton Edge 321.28
Backscatter Peak 228.48
Detector Material X-ray 81.52
Cesium-137, Barium-
133 combined X-ray
26.45
11. Nnaemeka Ani March 28th, 2016 Gamma Ray Spectroscopy using NAI
(TI) detector and MCA
P a g e 11 | 11
6. What was the unknown radionuclide? How were the identifications established?
How well did the calibration energies agree with the actual peak energies?
Explain any discrepancies in these values.
The Unknown radionuclide was found to be Sodium-22. This was identified from its
1,115.6 KeV Gamma ray. There was actually another peak energy found which was
511 KeV but this peak is only there as a result of the annihilation process. This was
the only peak shown in the data. The closeness to the known value was reported for
because of the continual randomness of gamma-ray emission. This therefore caused
some slightly changed values.
Conclusions
The NaI detector used was extremely important. It produced accurate results. Gamma rays
remain the same over long ranges through the use of gamma-ray spectroscopy. One very
important use of this method is the ability to identify any radioisotopes using this method. Even
when the half-life measurements and the radioisotopes are found, we can easily still find the
initial amount of element that that decayed.
Suggestions for Future Work
There were some areas that were not clear to me. I believe that if we are all given a run-down of
the experiment just before we conduct it, it will be much appreciated. Sometimes we do not
know what to expect and what not.
References
Brenizer, J.S., and Jovanovic, I. et al, Radiation Detection and Measurement Laboratory
Manual, 2013.
Knoll, Glenn F., Radiation Detection and Measurement, 4 ed., John Wiley and Sons,
2010.
Shultis, J. Kenneth, and Faw, Richard E., Fundamentals of Nuclear Science and
Engineering, 2 ed., CRC Press, 2008.
Appendices
http://demoweb.physics.ucla.edu/content/experiment-6-radioactivity