Downloaded 125 times

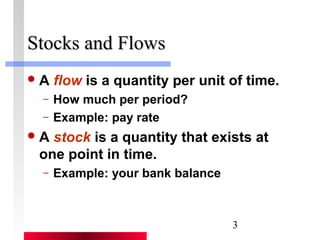

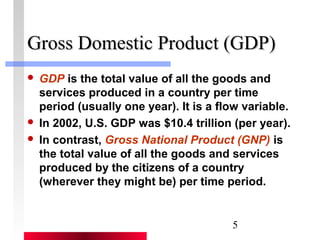
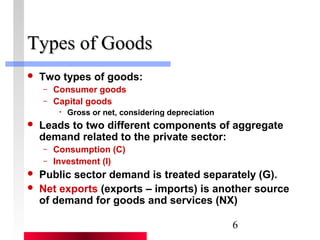
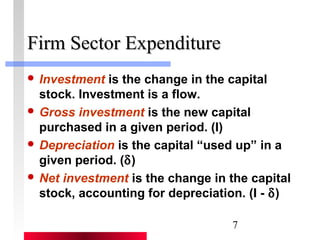
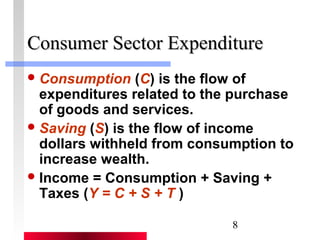
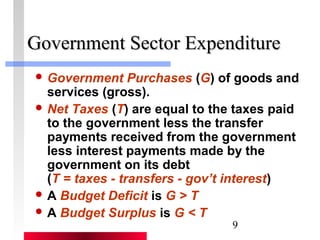
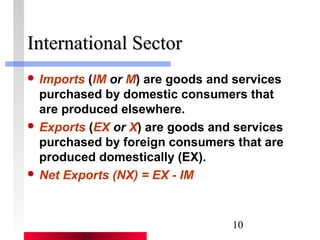


The document discusses key concepts in macroeconomics, including the distinction between flow and stock variables, the components of Gross Domestic Product (GDP), and the importance of investment, consumption, and government spending in economic measurement. It also addresses various measures of income, implications of inflation, and unemployment metrics, such as types of unemployment and labor market indicators. Additionally, it highlights limitations of GDP in measuring economic welfare and outlines methods for calculating inflation rates.


