Download to read offline

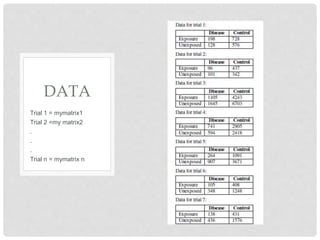
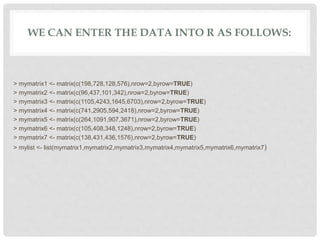


The document provides instructions for creating a forest plot in R to display results from multiple randomized controlled trials. It explains that a forest plot is useful for meta-analyses to show outcome data from several RCTs studies that have been entered into R as separate matrices and combined into a list. The code examples demonstrate how to define the matrices for each trial's data and compile them into a list for analysis and visualization in a forest plot.