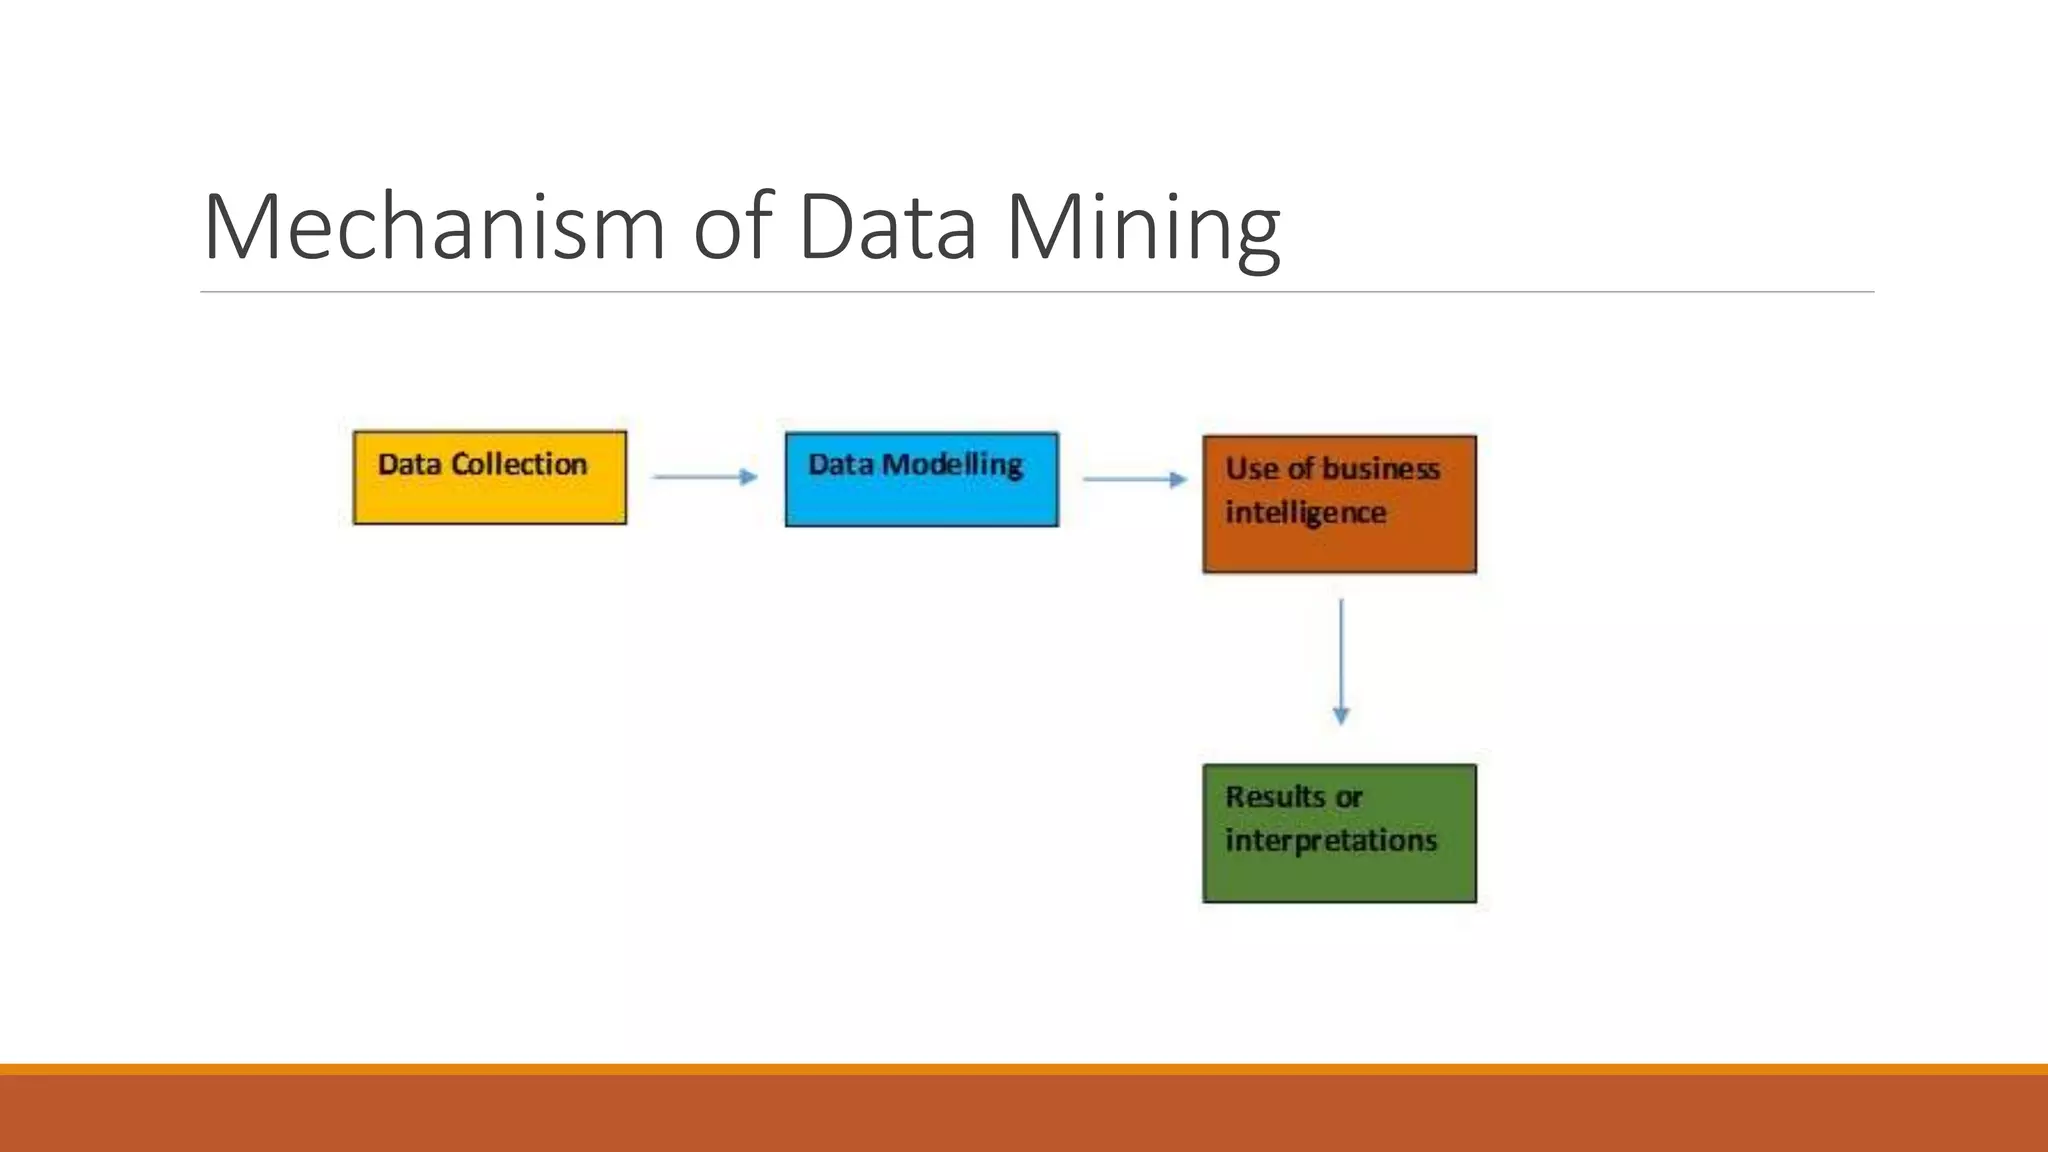
Forecasting Businesses
Through Data Mining
AKASH SHUKLA
CIS 527
CIN: 304374322
What is data mining ?
 Data mining is a technique in which an organization collects,
organizes and stores data. A wide range of data mining techniques
are being used by organizations to gain a better understanding of
their customers and their own operations and to solve complex
organizational problems.
What is business analytics ?
 Business analytics is using different analytic techniques to analyze
certain available data and provide the business user with critical
insight of it, which can help them in boosting their operational and
performance capabilities.
What is business intelligence ?
 Business intelligence is the analysis of raw or unordered data using
different tools and techniques to create something more meaningful
for the entire purpose of business analysis.
Mechanism of Data Mining
Phases
In the first phase data is collected, be it anyone. They can be a household user or a commercial
user.
Then in the second phase data is modelled or in simple words it is re- arranged as the data that
is collected is raw data just randomly from anyone. So there are a lot of parameters according to
which data can be arranged. Consider a household product for that some of the factors could be
location, number of people who found it more expensive than they consider its value, a few
comments, as sometimes even one comment can ignite a new idea. This is the whole reason
behind it.
In the third phase, we apply intelligence to the data that is available to us and try to find out
solutions to different problems by applying that very same data.
After all this what we obtain is the result or interpretation which may be just a piece of paper
but a recipe that could fetch a million dollars.
Algorithms For Data Mining
Apriori Algorithm
The most frequently visited item in the database is displayed. That
particular item has either been viewed or bought by a majority of
people, That is the reason it is on the top.
It uses bottom up approach, which helps in identifying the most
visited item in the database. Then it uses breadth first search to
match our search with the most popular item in the database.
K-Means Algorithm
We classify a given set of data into a number of clusters and find a
center. Later on we try to relate the formed clusters with their
closest associations.
Using this we are able to associate different groups depending on
their interests, In this way only a cluster or group of people are able
to view things that have been specifically designed for them.
Summary
Organizations have begun to realize that a change from the
traditional system is required and it is very important to involve data
mining for business analysis.
After analyzing massive amount of data that is generated by
different techniques, it is very easy to arrange it in different charts
and tables by which even the tiniest parameter is visible.
This will provide them an edge over all other competitors in the
market.
Thank You

Forecasting Businesses Through Data Mining

  • 1.
    Forecasting Businesses Through DataMining AKASH SHUKLA CIS 527 CIN: 304374322
  • 2.
    What is datamining ?  Data mining is a technique in which an organization collects, organizes and stores data. A wide range of data mining techniques are being used by organizations to gain a better understanding of their customers and their own operations and to solve complex organizational problems.
  • 3.
    What is businessanalytics ?  Business analytics is using different analytic techniques to analyze certain available data and provide the business user with critical insight of it, which can help them in boosting their operational and performance capabilities.
  • 4.
    What is businessintelligence ?  Business intelligence is the analysis of raw or unordered data using different tools and techniques to create something more meaningful for the entire purpose of business analysis.
  • 5.
  • 6.
    Phases In the firstphase data is collected, be it anyone. They can be a household user or a commercial user. Then in the second phase data is modelled or in simple words it is re- arranged as the data that is collected is raw data just randomly from anyone. So there are a lot of parameters according to which data can be arranged. Consider a household product for that some of the factors could be location, number of people who found it more expensive than they consider its value, a few comments, as sometimes even one comment can ignite a new idea. This is the whole reason behind it. In the third phase, we apply intelligence to the data that is available to us and try to find out solutions to different problems by applying that very same data. After all this what we obtain is the result or interpretation which may be just a piece of paper but a recipe that could fetch a million dollars.
  • 7.
  • 8.
    Apriori Algorithm The mostfrequently visited item in the database is displayed. That particular item has either been viewed or bought by a majority of people, That is the reason it is on the top. It uses bottom up approach, which helps in identifying the most visited item in the database. Then it uses breadth first search to match our search with the most popular item in the database.
  • 9.
    K-Means Algorithm We classifya given set of data into a number of clusters and find a center. Later on we try to relate the formed clusters with their closest associations. Using this we are able to associate different groups depending on their interests, In this way only a cluster or group of people are able to view things that have been specifically designed for them.
  • 10.
    Summary Organizations have begunto realize that a change from the traditional system is required and it is very important to involve data mining for business analysis. After analyzing massive amount of data that is generated by different techniques, it is very easy to arrange it in different charts and tables by which even the tiniest parameter is visible. This will provide them an edge over all other competitors in the market.
  • 11.