Big Data and Analytics are playing an important role to improve the performance of game and players on the field, off the field through predictive decisions.
Market analysis through Consumer Behavior Pattern InsightsCARTO
In this webinar in partnership with Safegraph, you learn how to use spatial analysis and leading POI data to drive superior market analysis workflows.
Watch the recorded webinar at: https://go.carto.com/webinars/safegraph-market-analysis-recorded
Analytics & big data can act as valuable drivers in many industries by providing information that drives core business decisions. https://www.promptcloud.com
Big Data Applications | Big Data Application Examples | Big Data Use Cases | ...Simplilearn
In this Big Data presentation, we will be discussing the Big data growth over the last few years followed by the various big data applications. We will look into the various sectors where big data is used such as weather forecast, healthcare, media and entertainment, logistics, travel & tourism and finally in the government & law enforcement sector.
We will be discussing how below industries are using Big Data presentation:
1. Weather forecast
2. Media and entertainment
3. Healthcare
4. Logistics
5. Travel n tourism
6. Government and law enforcement
What is this Big Data Hadoop training course about?
The Big Data Hadoop and Spark developer course have been designed to impart an in-depth knowledge of Big Data processing using Hadoop and Spark. The course is packed with real-life projects and case studies to be executed in the CloudLab.
What are the course objectives?
This course will enable you to:
1. Understand the different components of Hadoop ecosystem such as Hadoop 2.7, Yarn, MapReduce, Pig, Hive, Impala, HBase, Sqoop, Flume, and Apache Spark
2. Understand Hadoop Distributed File System (HDFS) and YARN as well as their architecture, and learn how to work with them for storage and resource management
3. Understand MapReduce and its characteristics, and assimilate some advanced MapReduce concepts
4. Get an overview of Sqoop and Flume and describe how to ingest data using them
5. Create database and tables in Hive and Impala, understand HBase, and use Hive and Impala for partitioning
6. Understand different types of file formats, Avro Schema, using Arvo with Hive, and Sqoop and Schema evolution
7. Understand Flume, Flume architecture, sources, flume sinks, channels, and flume configurations
8. Understand HBase, its architecture, data storage, and working with HBase. You will also understand the difference between HBase and RDBMS
9. Gain a working knowledge of Pig and its components
10. Do functional programming in Spark
11. Understand resilient distribution datasets (RDD) in detail
12. Implement and build Spark applications
13. Gain an in-depth understanding of parallel processing in Spark and Spark RDD optimization techniques
14. Understand the common use-cases of Spark and the various interactive algorithms
15. Learn Spark SQL, creating, transforming, and querying Data frames
Learn more at https://www.simplilearn.com/big-data-and-analytics/big-data-and-hadoop-training
Gaming in India has been catalyzed by better smartphones, increased internet access, popular titles, influencers, and the global pandemic. To dive deeper into this space, Sequoia India partnered with BCG to assess the current mobile gaming market in India, and its prospects for expansion in a report titled ‘Mobile Gaming: $5B+ Market Opportunity.
Big Data Tutorial | What Is Big Data | Big Data Hadoop Tutorial For Beginners...Simplilearn
This presentation about Big Data will help you understand how Big Data evolved over the years, what is Big Data, applications of Big Data, a case study on Big Data, 3 important challenges of Big Data and how Hadoop solved those challenges. The case study talks about Google File System (GFS), where you’ll learn how Google solved its problem of storing increasing user data in early 2000. We’ll also look at the history of Hadoop, its ecosystem and a brief introduction to HDFS which is a distributed file system designed to store large volumes of data and MapReduce which allows parallel processing of data. In the end, we’ll run through some basic HDFS commands and see how to perform wordcount using MapReduce. Now, let us get started and understand Big Data in detail.
Below topics are explained in this Big Data presentation for beginners:
1. Evolution of Big Data
2. Why Big Data?
3. What is Big Data?
4. Challenges of Big Data
5. Hadoop as a solution
6. MapReduce algorithm
7. Demo on HDFS and MapReduce
What is this Big Data Hadoop training course about?
The Big Data Hadoop and Spark developer course have been designed to impart in-depth knowledge of Big Data processing using Hadoop and Spark. The course is packed with real-life projects and case studies to be executed in the CloudLab.
What are the course objectives?
This course will enable you to:
1. Understand the different components of the Hadoop ecosystem such as Hadoop 2.7, Yarn, MapReduce, Pig, Hive, Impala, HBase, Sqoop, Flume, and Apache Spark
2. Understand Hadoop Distributed File System (HDFS) and YARN as well as their architecture, and learn how to work with them for storage and resource management
3. Understand MapReduce and its characteristics, and assimilate some advanced MapReduce concepts
4. Get an overview of Sqoop and Flume and describe how to ingest data using them
5. Create database and tables in Hive and Impala, understand HBase, and use Hive and Impala for partitioning
6. Understand different types of file formats, Avro Schema, using Arvo with Hive, and Sqoop and Schema evolution
7. Understand Flume, Flume architecture, sources, flume sinks, channels, and flume configurations
8. Understand HBase, its architecture, data storage, and working with HBase. You will also understand the difference between HBase and RDBMS
9. Gain a working knowledge of Pig and its components
10. Do functional programming in Spark
11. Understand resilient distribution datasets (RDD) in detail
12. Implement and build Spark applications
13. Gain an in-depth understanding of parallel processing in Spark and Spark RDD optimization techniques
14. Understand the common use-cases of Spark and the various interactive algorithms
15. Learn Spark SQL, creating, transforming, and querying Data frames
Learn more at https://www.simplilearn.com/big-data-and-analytics/big-data-and-hadoop-training
Keynote for CASH 2020 (International Conference on Computer Assisted System in Health, Education and Sustainable Development)
Among the primary technology of the 4th Industrial Revolution are Virtual Reality (VR). The technology has already reached the consumer with the mature development of software and hardware. Besides that, contents and data play important and significant role to boost the future lifestyle including sports. The growth of contents contributed by technology users will lead to how they will benefits from the technology for their lifestyle. Although Virtual Reality was seen as technologies reserved for gamers, many have realized the significant potential in a wide range of industries and applying the technologies to more serious matter such as sports. Gamification always been used as motivation method for athelete as well as ordinary user throughout the physical activity and provide a set of rules to encourage for better performance. This talk will include trends and applications of Virtual Reality and Gamification in Sports. Samples will be taken from research carried out at Institute of Human Centered Engineering (iHumEn), Universiti Teknologi Malaysia and other renowned related research centres worldwide. Specifically, the research and development work of in Virtual Reality and Gamification conducted by our team will be exposed. Furthermore, generality of impacts with VR and gamification in sports will be highlighted.
https://mycasd.upm.edu.my/cash2020/speakers.html
Stock Pitch For Real Estate Powerpoint Presentation Ppt Slide TemplateSlideTeam
"You can download this product from SlideTeam.net"
Our Stock Pitch For Real Estate Powerpoint Presentation Ppt Slide Template is the perfect way to pitch your stock. We have researched thousands of stock pitches and designed the most impactful way to convince your investors to invest in your equity. https://bit.ly/3BbGbgx
Two Methods for Modeling LTV with a SpreadsheetEric Seufert
NB! The bitly link in the deck DOES NOT WORK, please use this one: http://bit.ly/1JTymzd
This is the presentation I gave at Slush 2013 in Helsinki, Finland. It describes two methods for modeling Lifetime Customer Value (LTV) in Excel. Linked within the presentation is a spreadsheet exemplifying both methods against 100k rows of fake user data that I generated with a Python script to "look" real (although they probably don't).
Big Data in Industry
Many believe that Big Data is a new asset which will help companies catapult others to become the best in class.
What is it about Big Data that is so appealing across industries? Simply, data is intertwined into every sector and function in the global economy and much of modern economic activity would not be able to take place without data.
Big Data relates to large meres of data which can be brought together and then analyzed to inform decision making and discern patterns. The insights which Big Data brings, will become the basis of competition and growth for companies worldwide through further enhancing productivity as well as generating significant value for the global economy by increasing the quality of goods and services.
Previous trends in IT investment and innovation such as cloud adoption and the impact of this on competitiveness and productivity can be mirrored by Big Data which serves as a crucial way for large companies to outperform their competition. Across industries, time-honored competitors and new entrants to the market will use data-driven strategies to compete, innovate and seize value. The knowledge that big data brings informs the creation of new services and the design of future products. In fact, some companies are using Big Data to conduct controlled experiments to inform better management decisions.
http://www.extentia.com/service/big-data
www.extentia.com/contact-us
Data Analytics PowerPoint Presentation SlidesSlideTeam
This complete deck is oriented to make sure you do not lag in your presentations. Our creatively crafted slides come with apt research and planning. This exclusive deck with twenty slides is here to help you to strategize, plan, analyse, or segment the topic with clear understanding and apprehension. Utilize ready to use presentation slides on Data Analytics PowerPoint Presentation Slides with all sorts of editable templates, charts and graphs, overviews, analysis templates. It is usable for marking important decisions and covering critical issues. Display and present all possible kinds of underlying nuances, progress factors for an all inclusive presentation for the teams. This presentation deck can be used by all professionals, managers, individuals, internal external teams involved in any company organization.
Battery Ventures State of the OpenCloud Report 2022Battery Ventures
Battery Ventures' 2022 State of the OpenCloud report, compiled by General Partner Dharmesh Thakker and his team Danel Dayan, Jason Mendel and Patrick Hsu. The report analyzes the macro technology and economic trends impacting the cloud market, and provides advice for cloud-native entrepreneurs who are navigating these trends to build large, enduring businesses.
Big Data, Data Lake, Fast Data - Dataserialiation-FormatsGuido Schmutz
The concept of "Data Lake" is in everyone's mind today. The idea of storing all the data that accumulates in a company in a central location and making it available sounds very interesting at first. But Data Lake can quickly turn from a clear, beautiful mountain lake into a huge pond, especially if it is inexpertly entrusted with all the source data formats that are common in today's enterprises, such as XML, JSON, CSV or unstructured text data. Who, after some time, still has an overview of which data, which format and how they have developed over different versions? Anyone who wants to help themselves from the Data Lake must ask themselves the same questions over and over again: what information is provided, what data types do they have and how has the content changed over time?
Data serialization frameworks such as Apache Avro and Google Protocol Buffer (Protobuf), which enable platform-independent data modeling and data storage, can help. This talk will discuss the possibilities of Avro and Protobuf and show how they can be used in the context of a data lake and what advantages can be achieved. The support on Avro and Protobuf by Big Data and Fast Data platforms is also a topic.
Data Strategy - Executive MBA Class, IE Business SchoolGam Dias
For today's enterprise Data is now very much a corporate asset, vital to delivering products and services efficiently and cost effectively. There are few organizations that can survive without harnessing data in some way.
Viewed as a strategic asset, data can be a source of new internal efficiencies, improved competitive advantage or a source of entirely new products that can be targeted at your existing or new customers.
This slide deck contains the highlights of a one day course on Data Strategy taught as part of the Executive MBA Program at IE Business School in Madrid.
Mobile devices, sensors, and GPSs are driving demand to handle big data in both batch and real time. This presentation discusses how we used complex event processing (CEP) and MapReduce-based technologies to track and process data from a soccer match as part of the annual DEBS event processing challenge. In 2013, the challenge included a data set generated by a real soccer match in which sensors were placed in the soccer ball and players’ shoes. This session will review how we used CEP to address the DEBS challenge and achieve throughput in excess of 100,000 events/sec. It will also examine how we extended the solution to conduct batch processing with business activity monitoring (BAM) using the same framework, enabling users to obtain both instant analytics as well as more detailed batch processing-based results.
Mobile devices, sensors and GPS are driving the demand to handle big data in both batch and real time. This presentation discusses how we used complex event processing (CEP) and MapReduce based technologies to track and process data from a soccer match as part of the annual DEBS event processing challenge. In 2013, the challenge included a data set generated by a real soccer match in which sensors were placed in the soccer ball and players’ shoes. This session will review how we used CEP to implement DESB challenge and achieved throughput in excess of 100,000 events/sec. It also will examine how we extended the solution to conduct batch processing using business activity monitoring (BAM) using the same framework, enabling users to obtain both instant analytics as well as more detailed batch processing based results.
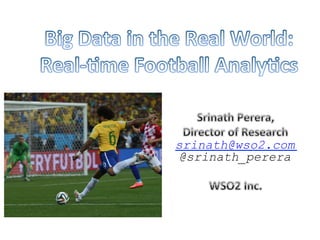
Strata 2014 Talk:Tracking a Soccer Game with Big DataSrinath Perera
Mobile devices, sensors and GPS are driving the demand to handle big data in both batch and real time. This presentation discusses how we used complex event processing (CEP) and MapReduce based technologies to track and process data from a soccer match as part of the annual DEBS event processing challenge. In 2013, the challenge included a data set generated by a real soccer match in which sensors were placed in the soccer ball and players’ shoes. This session will review how we used CEP to implement DESB challenge and achieved throughput in excess of 100,000 events/sec. It also will examine how we extended the solution to conduct batch processing using business activity monitoring (BAM) using the same framework, enabling users to obtain both instant analytics as well as more detailed batch processing based results.
The Science of Fun - Data-driven Game Developmentalex_turcan
Games are crafted to provide unique experiences, but players don't always behave as you would expect. In this presentation, Alexandra Turcan and Ruan Pearce-Authers from Dambuster Studios will explain how they combine UX methods with telemetry and biometrics to quantify player in-game behaviour.
This presentation discusses how WSO2 used complex event processing (CEP) and MapReduce based technologies to track and process data from a soccer match as part of the annual DEBS event processing challenge while achieving throughput in excess of 100,000 events/sec.
Big data streams, Internet of Things, and Complex Event Processing Improve So...Chris Haddad
Teams gain a competitive edge by analyzing Big Data streams. In this session, Chris will describe how complex event processing (CEP) and MapReduce based technologies can improve soccer team performance. Soccer match activity data captured by embedded sensors were streamed and analyzed to understand how player actions impact soccer play.
How to teach your data scientist to leverage an analytics cluster with Presto...Alluxio, Inc.
Data Orchestration Summit 2020 organized by Alluxio
https://www.alluxio.io/data-orchestration-summit-2020/
How to teach your data scientist to leverage an analytics cluster with Presto, Spark, and Alluxio
Katarzyna Orzechowska, Data Scientist (ING Tech)
Mariusz Derela, DevOps Engineer (ING Tech)
About Alluxio: alluxio.io
Engage with the open source community on slack: alluxio.io/slack
Tic Tac Toe unite is an android application game based on Artificial Intelligence .Download the game on google play store at https://play.google.com/store/apps/details?id=com.thesarthakapp.tictactoeunite
Screencasting and Presenting for EngineersKunal Johar
Engineers often think about the 'how' as the most exciting part of their work. These details often bore what would be candid listeners.
Take a step back, think about what excites others, then ease in your grand challenges. Tie it all together in a story.
View, Act, and React: Shaping Business Activity with Analytics, BigData Queri...Srinath Perera
Sun Tzu said “if you know your enemies and know yourself, you can win a hundred battles without a single loss.” Those words have never been truer than in our time. We are faced with an avalanche of data. Many believe the ability to process and gain insights from a vast array of available data will be the primary competitive advantage for organizations in the years to come.
To make sense of data, you will have to face many challenges: how to collect, how to store, how to process, and how to react fast. Although you can build these systems from bottom up, it is a significant problem. There are many technologies, both open source and proprietary, that you can put together to build your analytics solution, which will likely save you effort and provide a better solution.
In this session, Srinath will discuss WSO2’s middleware offering in BigData and explain how you can put them together to build a solution that will make sense of your data. The session will cover technologies like thrift for collecting data, Cassandra for storing data, Hadoop for analyzing data in batch mode, and Complex event processing for analyzing data real time.
ODSC 2019: Sessionisation via stochastic periods for root event identificationKuldeep Jiwani
In todays world majority of information is generated by self sustaining systems like various kinds of bots, crawlers, servers, various online services, etc. This information is flowing on the axis of time and is generated by these actors under some complex logic. For example, a stream of buy/sell order requests by an Order Gateway in financial world, or a stream of web requests by a monitoring / crawling service in the web world, or may be a hacker's bot sitting on internet and attacking various computers. Although we may not be able to know the motive or intention behind these data sources. But via some unsupervised techniques we can try to infer the pattern or correlate the events based on their multiple occurrences on the axis of time. Associating a chain of events in order of time helps in doing a root event analysis. In certain cases a time ordered correlation and root event identification is good enough to automatically identify signatures of various malicious actors and take appropriate corrective actions to stop cyber attacks, stop malicious social campaigns, etc.
Sessionisation is one such unsupervised technique that tries to find the signal in a stream of events associated with a timestamp. In the ideal world it would resolve to finding periods with a mixture of sinusoidal waves. But for the real world this is a much complex activity, as even the systematic events generated by machines over the internet behave in a much erratic manner. So the notion of a period for a signal also changes in the real world. We can no longer associate it with a number, it has to be treated as a random variable, with expected values and associated variance. Hence we need to model "Stochastic periods" and learn their probability distributions in an unsupervised manner.
The main focus of this talk will be to showcase applied data science techniques to discover stochastic periods. There are many ways to obtain periods in data, so the journey would begin by a walk through of existing techniques like FFT (Fast Fourier Transform) then discuss about Gaussian Mixture Models. After highlighting the short comings of these techniques we will succinctly explain one of the most general non-parametric Bayesian approaches to solve this problem. Without going too deep in the complex math, we will get back to applied data science and discuss a much simpler technique that can solve the same problem if certain assumptions are satisfied.
In this talk we will demonstrate some time based pattern we discovered while working on a security analytics use case that uses Sessionisation. In the talk we will demonstrate such patterns based on an open source malware attack datasets that is available publicly.
Key concepts explained in talk: Sessionisation, Bayesian techniques of Machine Learning, Gaussian Mixture Models, Kernel density estimation, FFT, stochastic periods, probabilistic modelling, Bayesian non-parametric methods
There are many modern techniques for identifying anomalies in datasets. There are fewer that work as online algorithms suitable for application to real-time streaming data. What’s worse? Most of these methodologies require a deep understanding of the data itself. In this talk, we tour what the options are for identifying anomalies in real-time data and discuss how much we really need to know before hand to guess at the ever-useful question: is this normal?
Similar to Big Data in the Real World. Real-time Football Analytics (20)
Accelerate Enterprise Software Engineering with PlatformlessWSO2
Key takeaways:
Challenges of building platforms and the benefits of platformless.
Key principles of platformless, including API-first, cloud-native middleware, platform engineering, and developer experience.
How Choreo enables the platformless experience.
How key concepts like application architecture, domain-driven design, zero trust, and cell-based architecture are inherently a part of Choreo.
Demo of an end-to-end app built and deployed on Choreo.
Less Is More: Utilizing Ballerina to Architect a Cloud Data PlatformWSO2
At its core, the challenge of managing Human Resources data is an integration challenge: estimates range from 2-3 HR systems in use at a typical SMB, up to a few dozen systems implemented amongst enterprise HR departments, and these systems seldom integrate seamlessly between themselves. Providing a multi-tenant, cloud-native solution to integrate these hundreds of HR-related systems, normalize their disparate data models and then render that consolidated information for stakeholder decision making has been a substantial undertaking, but one significantly eased by leveraging Ballerina. In this session, we’ll cover:
The overall software architecture for VHR’s Cloud Data Platform
Critical decision points leading to adoption of Ballerina for the CDP
Ballerina’s role in multiple evolutionary steps to the current architecture
Roadmap for the CDP architecture and plans for Ballerina
WSO2’s partnership in bringing continual success for the CD
The integration landscape is changing rapidly with the introduction of technologies like GraphQL, gRPC, stream processing, iPaaS, and platformless. However, not all existing applications and industries can keep up with these new technologies. Certain industries, like manufacturing, logistics, and finance, still rely on well-established EDI-based message formats. Some applications use XML or CSV with file-based communications, while others have strict on premises deployment requirements. This talk focuses on how Ballerina's built-in integration capabilities can bridge the gap between "old" and "new" technologies, modernizing enterprise applications without disrupting business operations.
Platformless Horizons for Digital AdaptabilityWSO2
In this keynote, Asanka Abeysinghe, CTO,WSO2 will explore the shift towards platformless technology ecosystems and their importance in driving digital adaptability and innovation. We will discuss strategies for leveraging decentralized architectures and integrating diverse technologies, with a focus on building resilient, flexible, and future-ready IT infrastructures. We will also highlight WSO2's roadmap, emphasizing our commitment to supporting this transformative journey with our evolving product suite.
Quantum computers are rapidly evolving and are promising significant advantages in domains like machine learning or optimization, to name but a few areas. In this keynote we sketch the underpinnings of quantum computing, show some of the inherent advantages, highlight some application areas, and show how quantum applications are built.
GDG Cloud Southlake #33: Boule & Rebala: Effective AppSec in SDLC using Deplo...James Anderson
Effective Application Security in Software Delivery lifecycle using Deployment Firewall and DBOM
The modern software delivery process (or the CI/CD process) includes many tools, distributed teams, open-source code, and cloud platforms. Constant focus on speed to release software to market, along with the traditional slow and manual security checks has caused gaps in continuous security as an important piece in the software supply chain. Today organizations feel more susceptible to external and internal cyber threats due to the vast attack surface in their applications supply chain and the lack of end-to-end governance and risk management.
The software team must secure its software delivery process to avoid vulnerability and security breaches. This needs to be achieved with existing tool chains and without extensive rework of the delivery processes. This talk will present strategies and techniques for providing visibility into the true risk of the existing vulnerabilities, preventing the introduction of security issues in the software, resolving vulnerabilities in production environments quickly, and capturing the deployment bill of materials (DBOM).
Speakers:
Bob Boule
Robert Boule is a technology enthusiast with PASSION for technology and making things work along with a knack for helping others understand how things work. He comes with around 20 years of solution engineering experience in application security, software continuous delivery, and SaaS platforms. He is known for his dynamic presentations in CI/CD and application security integrated in software delivery lifecycle.
Gopinath Rebala
Gopinath Rebala is the CTO of OpsMx, where he has overall responsibility for the machine learning and data processing architectures for Secure Software Delivery. Gopi also has a strong connection with our customers, leading design and architecture for strategic implementations. Gopi is a frequent speaker and well-known leader in continuous delivery and integrating security into software delivery.
GraphRAG is All You need? LLM & Knowledge GraphGuy Korland
Guy Korland, CEO and Co-founder of FalkorDB, will review two articles on the integration of language models with knowledge graphs.
1. Unifying Large Language Models and Knowledge Graphs: A Roadmap.
https://arxiv.org/abs/2306.08302
2. Microsoft Research's GraphRAG paper and a review paper on various uses of knowledge graphs:
https://www.microsoft.com/en-us/research/blog/graphrag-unlocking-llm-discovery-on-narrative-private-data/
Essentials of Automations: Optimizing FME Workflows with ParametersSafe Software
Are you looking to streamline your workflows and boost your projects’ efficiency? Do you find yourself searching for ways to add flexibility and control over your FME workflows? If so, you’re in the right place.
Join us for an insightful dive into the world of FME parameters, a critical element in optimizing workflow efficiency. This webinar marks the beginning of our three-part “Essentials of Automation” series. This first webinar is designed to equip you with the knowledge and skills to utilize parameters effectively: enhancing the flexibility, maintainability, and user control of your FME projects.
Here’s what you’ll gain:
- Essentials of FME Parameters: Understand the pivotal role of parameters, including Reader/Writer, Transformer, User, and FME Flow categories. Discover how they are the key to unlocking automation and optimization within your workflows.
- Practical Applications in FME Form: Delve into key user parameter types including choice, connections, and file URLs. Allow users to control how a workflow runs, making your workflows more reusable. Learn to import values and deliver the best user experience for your workflows while enhancing accuracy.
- Optimization Strategies in FME Flow: Explore the creation and strategic deployment of parameters in FME Flow, including the use of deployment and geometry parameters, to maximize workflow efficiency.
- Pro Tips for Success: Gain insights on parameterizing connections and leveraging new features like Conditional Visibility for clarity and simplicity.
We’ll wrap up with a glimpse into future webinars, followed by a Q&A session to address your specific questions surrounding this topic.
Don’t miss this opportunity to elevate your FME expertise and drive your projects to new heights of efficiency.
Neuro-symbolic is not enough, we need neuro-*semantic*Frank van Harmelen
Neuro-symbolic (NeSy) AI is on the rise. However, simply machine learning on just any symbolic structure is not sufficient to really harvest the gains of NeSy. These will only be gained when the symbolic structures have an actual semantics. I give an operational definition of semantics as “predictable inference”.
All of this illustrated with link prediction over knowledge graphs, but the argument is general.
LF Energy Webinar: Electrical Grid Modelling and Simulation Through PowSyBl -...DanBrown980551
Do you want to learn how to model and simulate an electrical network from scratch in under an hour?
Then welcome to this PowSyBl workshop, hosted by Rte, the French Transmission System Operator (TSO)!
During the webinar, you will discover the PowSyBl ecosystem as well as handle and study an electrical network through an interactive Python notebook.
PowSyBl is an open source project hosted by LF Energy, which offers a comprehensive set of features for electrical grid modelling and simulation. Among other advanced features, PowSyBl provides:
- A fully editable and extendable library for grid component modelling;
- Visualization tools to display your network;
- Grid simulation tools, such as power flows, security analyses (with or without remedial actions) and sensitivity analyses;
The framework is mostly written in Java, with a Python binding so that Python developers can access PowSyBl functionalities as well.
What you will learn during the webinar:
- For beginners: discover PowSyBl's functionalities through a quick general presentation and the notebook, without needing any expert coding skills;
- For advanced developers: master the skills to efficiently apply PowSyBl functionalities to your real-world scenarios.
UiPath Test Automation using UiPath Test Suite series, part 4DianaGray10
Welcome to UiPath Test Automation using UiPath Test Suite series part 4. In this session, we will cover Test Manager overview along with SAP heatmap.
The UiPath Test Manager overview with SAP heatmap webinar offers a concise yet comprehensive exploration of the role of a Test Manager within SAP environments, coupled with the utilization of heatmaps for effective testing strategies.
Participants will gain insights into the responsibilities, challenges, and best practices associated with test management in SAP projects. Additionally, the webinar delves into the significance of heatmaps as a visual aid for identifying testing priorities, areas of risk, and resource allocation within SAP landscapes. Through this session, attendees can expect to enhance their understanding of test management principles while learning practical approaches to optimize testing processes in SAP environments using heatmap visualization techniques
What will you get from this session?
1. Insights into SAP testing best practices
2. Heatmap utilization for testing
3. Optimization of testing processes
4. Demo
Topics covered:
Execution from the test manager
Orchestrator execution result
Defect reporting
SAP heatmap example with demo
Speaker:
Deepak Rai, Automation Practice Lead, Boundaryless Group and UiPath MVP
Software Delivery At the Speed of AI: Inflectra Invests In AI-Powered QualityInflectra
In this insightful webinar, Inflectra explores how artificial intelligence (AI) is transforming software development and testing. Discover how AI-powered tools are revolutionizing every stage of the software development lifecycle (SDLC), from design and prototyping to testing, deployment, and monitoring.
Learn about:
• The Future of Testing: How AI is shifting testing towards verification, analysis, and higher-level skills, while reducing repetitive tasks.
• Test Automation: How AI-powered test case generation, optimization, and self-healing tests are making testing more efficient and effective.
• Visual Testing: Explore the emerging capabilities of AI in visual testing and how it's set to revolutionize UI verification.
• Inflectra's AI Solutions: See demonstrations of Inflectra's cutting-edge AI tools like the ChatGPT plugin and Azure Open AI platform, designed to streamline your testing process.
Whether you're a developer, tester, or QA professional, this webinar will give you valuable insights into how AI is shaping the future of software delivery.
JMeter webinar - integration with InfluxDB and GrafanaRTTS
Watch this recorded webinar about real-time monitoring of application performance. See how to integrate Apache JMeter, the open-source leader in performance testing, with InfluxDB, the open-source time-series database, and Grafana, the open-source analytics and visualization application.
In this webinar, we will review the benefits of leveraging InfluxDB and Grafana when executing load tests and demonstrate how these tools are used to visualize performance metrics.
Length: 30 minutes
Session Overview
-------------------------------------------
During this webinar, we will cover the following topics while demonstrating the integrations of JMeter, InfluxDB and Grafana:
- What out-of-the-box solutions are available for real-time monitoring JMeter tests?
- What are the benefits of integrating InfluxDB and Grafana into the load testing stack?
- Which features are provided by Grafana?
- Demonstration of InfluxDB and Grafana using a practice web application
To view the webinar recording, go to:
https://www.rttsweb.com/jmeter-integration-webinar
Key Trends Shaping the Future of Infrastructure.pdfCheryl Hung
Keynote at DIGIT West Expo, Glasgow on 29 May 2024.
Cheryl Hung, ochery.com
Sr Director, Infrastructure Ecosystem, Arm.
The key trends across hardware, cloud and open-source; exploring how these areas are likely to mature and develop over the short and long-term, and then considering how organisations can position themselves to adapt and thrive.
UiPath Test Automation using UiPath Test Suite series, part 3DianaGray10
Welcome to UiPath Test Automation using UiPath Test Suite series part 3. In this session, we will cover desktop automation along with UI automation.
Topics covered:
UI automation Introduction,
UI automation Sample
Desktop automation flow
Pradeep Chinnala, Senior Consultant Automation Developer @WonderBotz and UiPath MVP
Deepak Rai, Automation Practice Lead, Boundaryless Group and UiPath MVP
Elevating Tactical DDD Patterns Through Object CalisthenicsDorra BARTAGUIZ
After immersing yourself in the blue book and its red counterpart, attending DDD-focused conferences, and applying tactical patterns, you're left with a crucial question: How do I ensure my design is effective? Tactical patterns within Domain-Driven Design (DDD) serve as guiding principles for creating clear and manageable domain models. However, achieving success with these patterns requires additional guidance. Interestingly, we've observed that a set of constraints initially designed for training purposes remarkably aligns with effective pattern implementation, offering a more ‘mechanical’ approach. Let's explore together how Object Calisthenics can elevate the design of your tactical DDD patterns, offering concrete help for those venturing into DDD for the first time!
Transcript: Selling digital books in 2024: Insights from industry leaders - T...BookNet Canada
The publishing industry has been selling digital audiobooks and ebooks for over a decade and has found its groove. What’s changed? What has stayed the same? Where do we go from here? Join a group of leading sales peers from across the industry for a conversation about the lessons learned since the popularization of digital books, best practices, digital book supply chain management, and more.
Link to video recording: https://bnctechforum.ca/sessions/selling-digital-books-in-2024-insights-from-industry-leaders/
Presented by BookNet Canada on May 28, 2024, with support from the Department of Canadian Heritage.
Slack (or Teams) Automation for Bonterra Impact Management (fka Social Soluti...Jeffrey Haguewood
Sidekick Solutions uses Bonterra Impact Management (fka Social Solutions Apricot) and automation solutions to integrate data for business workflows.
We believe integration and automation are essential to user experience and the promise of efficient work through technology. Automation is the critical ingredient to realizing that full vision. We develop integration products and services for Bonterra Case Management software to support the deployment of automations for a variety of use cases.
This video focuses on the notifications, alerts, and approval requests using Slack for Bonterra Impact Management. The solutions covered in this webinar can also be deployed for Microsoft Teams.
Interested in deploying notification automations for Bonterra Impact Management? Contact us at sales@sidekicksolutionsllc.com to discuss next steps.
2. Vision
of
the
Future
• Sensors
everywhere
• Data
collected
from
everywhere,
analyzing,
op9mizing,
and
helping
(and
hopefully
not
taking
over)
• Analy9cs
and
Internet
of
things
..
Immersive
world
• Big
data
and
real-‐9me
analy9cs
will
be
crucial.
How
far
are
we
from
realizing
that?
3. What
would
take
to
build
such
a
world?
• Sensors
and
actuators
(Motes?)
• Fast
interoperable
event
systems
(MQTT?)
• Powerful
query
languages
(CEP?)
• Powerful
control
systems
and
decision
systems
5. CEP
Operators
• Filters
or
transforma9ons
(process
a
single
event)
– from Ball[v>10] select .. insert into ..
• Windows
+
aggrega9on
(track
window
of
events:
9me,
length)
– from Ball#window.time(30s) select avg(v) ..
• Joins
(join
two
event
streams
to
one)
– from Ball#window.time(30s) as b join Players as
p on p.v < b.v
• PaSerns
(state
machine
implementa9on)
– from Ball[v>10], Ball[v<10]*,Ball[v>10]
select ..
• Event
tables
(map
a
database
as
an
event
stream)
– Define table HitV (v double) using .. db info ..
6. Sport
(Soccer)
Usecases?
• Dashboard
on
game
status
• Alarms
about
cri9cal
events
in
the
game
• Real-‐9me
game
analysis
and
predic9ons
about
the
next
move
• Updates/
stats
etc.,
on
mobile
phone
with
customized
offers
• Study
of
game
and
players
effec9veness
• Monitor
players
health
and
body
func9ons
7. DEBS
Challenge
• Soccer
game,
players
and
ball
has
sensors
(DESB
Challenge
2013)
sid,
ts,
x,y,z,
v,a
• Use
cases:
Running
analysis,
Ball
Possession
and
Shots
on
Goal,
Heatmap
of
Ac9vity
• WSO2
CEP
(Siddhi)
did
100K+
throughput
8.
9. Usecase
1:
Running
Analysis
• Main
idea:
detect
when
speed
thresholds
have
passed
define partition player by Players .id;
from s = Players [v <= 1 or v > 11] ,
t = Players [v > 1 and v <= 11]+ ,
e = Players [v <= 1 or v > 11]
select s.ts as tsStart , e.ts as tsStop ,s.id as playerId ,
‘‘trot" as intensity , t [0].v as instantSpeed ,
(e.ts - s.ts )/1000000000 as unitPeriod
insert into RunningStats partition by player;
10. Usecase
2:
Ball
Possession
• Ball
possession
(you
possess
the
ball
from
9me
you
hit
it
un9l
someone
else
hit
it
or
ball
leaves
the
ground)
11. Usecase
3:
Heatmap
of
AcNvity
• Show
where
ac9ons
happened
(via
cells
defined
by
a
grid
of
64X100
etc.),
need
updates
once
every
second
• Can
solved
via
cell
change
boundaries,
but
does
not
work
if
one
player
stays
more
than
1
sec
in
the
same
cell.
So
need
to
join
with
a
9mer.
12. Usecase
4:
Detect
Kicks
on
the
Goal
• Main
Idea:
Detect
kicks
on
the
ball,
calculate
direc9on
ader
1m,
and
keep
giving
updates
as
long
as
it
is
in
right
direc9on
13. New
Usecase:
Offside
DetecNon
• If
you
have
gone
passed
the
last
defender
at
9me
of
a
kick,
you
are
in
a
offside
posi9on.
• If
you
are
part
of
that
play
ader,
it
is
foul
18. Conclusion
• We
are
heading
for
a
deeply
integrated
world
with
real-‐9me
detec9on
and
ac9ons
– We
have
technology
to
do
this
now.
E.g.
(DEBS
usecases)
– Power
of
CEP
– Use
real-‐9me
and
batch
processing
in
tandem
• All
the
sodware
we
discussed
are
Open
source
under
Apache
License.
Visit
hSp://wso2.com/.
• Like
to
integrate
with
us,
help,
or
join?
Talk
to
us
at
Big
Data
booth
or
architecture@wso2.org