Download to read offline


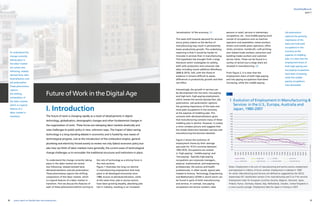
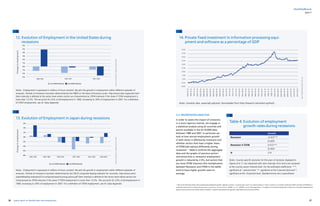
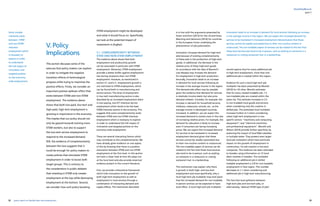
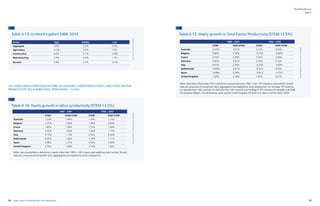
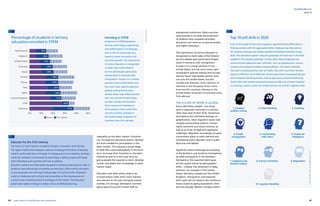
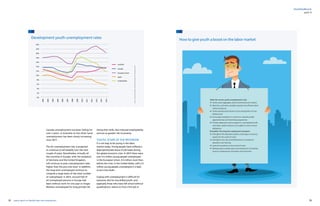
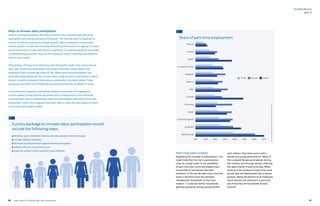
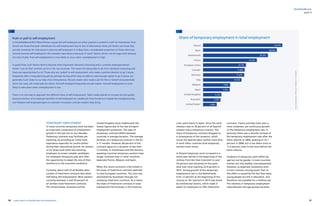
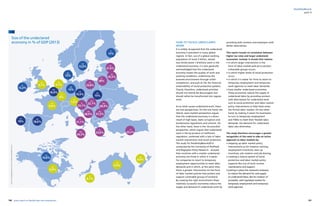
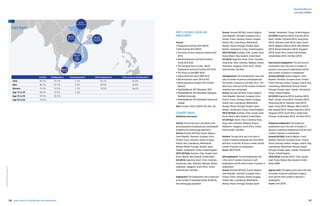
![2. Change in Occupational Employment
Shares in Low, Middle, and High-Wage
Occupations in 16 EU countries, 1993-2010
3. Polarization of Occupations in the United
States 1990-2010
Source:Goos,ManningandSalamons[2014,Table2]
Notes: Starting from 2 digit ISCO classified occupations, ‘Low’ is defined as the
employment in the four lowest paying occupations, ‘Middle’ as the nine middling
occupations and ‘High’ and the eight highest-paying occupations.
10 11yearly report on flexible labor and employment
flexibility@work
non-routine tasks are harder to substitute
with robots (e.g. Autor, 2015)4
. These
questions and observations concerning the
role of technology will be the main subject
of Section II.
In the subsequent sections two more
observations are discussed arising from
the macroeconomic literature that
looks broader than the labor market,
considering the economy as a whole. The
first observation relates to the timing of
job polarization. While the evidence on
job polarization and deindustrialization
shows the long term trends in employment,
it is also important to understand how
these changes take place within a shorter
time span. For example, are these changes
gradual over time or do they take place in
short bursts over the short to medium run?
There is some evidence that the cyclical
nature of the economy also has a role to
play. It is namely observed that the largest
decline in middling jobs takes place during
recessions. In other words, job polarization
seems to be amplified during downturns
in the economy. This relationship and
timing of events is discussed in Section
III. Secondly, deindustrialization relates
to the growing literature on differences
in productivity growth, captured by
differences in total factor productivity (TFP).
Here, it becomes increasingly important to
allow for heterogeneity between sectors
and even between firms. These differences
in productivity and the potential looming
of a secular stagnation in the economy are
discussed in Section IV.
These long term trends in employment have
inspired many countries to develop policies
to support manufacturing and especially in
the aftermath of the great recession many
initiatives have been launched under the
realm of New Industrial Policy. For instance,
the European Union set out its policy
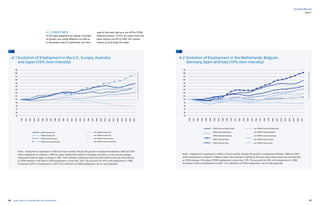
occupations have decreased. Especially the
high-paying occupations have gained in
relative importance. This is what typically is
referred to as polarization of occupations.
Figure 3 shows a similar trend for the
United States, where typical operational
and blue collar routine occupations have
lost ground over the same period. So, this
seems to have been a pervasive trend in
most advanced countries, which suggests
there must be some systematic mechanism
underlying this evolution, albeit the
part I
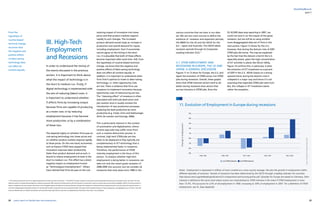
Typically, produc-
tivity growth is
related to the
introduction of
new technology
and innovation.
While the
first industrial
revolution was
triggered by the
introduction of the
combustion engine
and electricity as
a key enabling
technology,
arguably, the
economy today is
increasingly shaped
by the introduction
of computers,
robots and more
in general the
adaption and use
of Information and
Communication
Technology (ICT)
as a key enabling
technology.
extent of polarization seems to differ from
country to country. For instance, in Figure
2 we see that the increase in the share of
high-paying occupations varies from around
4% in Portugal and Austria to over 12% in
Luxembourg and Finland. (3)
This paper wants to take a closer look at the
long-run process of deindustrialization and
job polarization. To this end, we use various
data sets to document and analyze how
deindustrialization and job polarization
are affecting various types of occupations,
which type of jobs tend to grow and
which do not, and how these trends affect
productivity growth. Typically, productivity
growth is related to the introduction of
new technology and innovation. In this
context, we will focus in particular on the
role of key enabling technologies. While
the first industrial revolution was triggered
by the introduction of the combustion
engine and electricity as a key enabling
technology, arguably, the economy today
is increasingly shaped by the introduction
of computers, robots and more in general
the adaption and use of Information and
Communication Technology (ICT) as a key
enabling technology. ICT has triggered
a process of job polarization due to an
increased automation of encodable tasks in
search of cost cutting (e.g. Goos, Manning
and Salamons, 2014). In addition, there
is evidence that the presence of STEM
occupations marks the strong impact of
technology as many of these occupations
play a key facilitating role in the adoption
of digital technology. As we will illustrate
extensively in this work, this polarization
and automation process forces us to move
away from the traditional classification
of the economy into manufacturing and
non-manufacturing sectors. Rather we
should think in terms non-routine tasks
embedded in jobs versus routine tasks. With
automation the latter are easily replaced
or offshored to low-wage countries, while
Source:BasedonKatzandMargo[2014],Table1.6,panelAandowncalculations.
4 Routine tasks are structured and can therefore be increasingly codified in software and embodied in capital, whereas non-routine tasks are harder to automate. As a result, capital accumulation leads to an
accumulation of routine tasks in the economy -- hence the term Routine-Biased Technological Change -- while decreasing the demand for routine relative to non-routine labor tasks. Because routine labor tasks are
concentrated in middling jobs, RBTC leads to a hollowing out of labor demand or job polarization.
-2,0%
-1,5%
-1,0%
-0,5%
-0,0%
0,5%
1,0%
1,5%
2,0%
2,5%
Agricultural O
ccupation
Averagechangein%-points
Service
O
ccupations
O
perative/Laborer
Skilled
Blue
Collar (Craft)
Clerical/Sales
M
anager
Professional Technical
Occupations ranked from lowest paying to highest paying
15%
10%
5%
0%
-5%
-10%
-15%
Ireland
Belgium
Spain
UnitedKingdom
Luxembourg
Greece
Finland
Italy
Austria
Denmark
Sweden
France
Norway
Netherlands
Germany
Portugal
Low paying occupations Middle paying occupations High paying occupations
Changein%-points](https://image.slidesharecdn.com/6c937ee4-9f4e-4f1d-ac63-67d597b4ad02-161025215913/85/Flexibility-work-2016-6-320.jpg)
![12 13yearly report on flexible labor and employment
flexibility@work
in the context of the Innovation Union
initiative. In particular, it aims to create an
innovation-friendly environment to bring
economic growth and jobs to its regions.
For example, it strives for a 50% (or 150
billion Euro) increase in RD investments
by 2020, claiming this could increase annual
European GDP by 5% (or by 715 billion
Euro) and increase employment by 1.7%
(or by 3.7 million jobs) by 2025. Moreover,
the Innovation Union plan contains over
thirty action points to guarantee that this
growth is inclusive with more and better
jobs for all, and to remove obstacles to
innovation. Most of these initiatives are
targeted towards industry. However, in
recent years the growth of jobs seem to
have been concentrated in STEM jobs (e.g.
Goos et al, 2015). In Section V, we discuss
the importance of such policies and touch
on potential avenues for the future. We
conclude in Section VI.
In this section we show that
deindustrialization and job polarization
are (mainly) driven by technology by
reviewing these stylized facts in three
different ways.
First we illustrate a different way of
looking at the polarization from the labor
market based on sector employment. As
mentioned, ICT is considered as a key
enabling technology in the current wave
of digitization. Therefore we distinguish
sectors based on their ICT capital
intensity as a proxy for this difference in
susceptibility to technological employment.
Second, we rank sectors by their share
in STEM occupations as an alternative
and perhaps even more accurate way
of capturing the essential difference in
susceptibility to technological change
between sectors. However, the growth of
digital capital performing certain tasks is
a phenomenon that changes not only the
size but also the composition of sectors.
That is, if technology really is an importance
driver, we expect there to be evidence both
between and within sectors. This aspect will
be the focus of the final subsection.
2.1. ICT INTENSITY AND BETWEEN-
SECTOR JOB POLARIZATION SINCE
1980
The literature has explored two key
hypotheses that potentially account for
labor market polarization, one is offshoring
of ‘routine’ occupations to low-wage
countries, the other is skill-biased, or
rather routine-biased technological change
(Acemoglu and Autor, 2011).
It is the latter that has received more
attention as technological progress is
changing the relative demand for skills
and hence the relative wages, ‘offshoring’
of routine jobs then becomes a natural
consequence of routine biased technological
change. Arguably, a major technological
shock that overlaps the same period as the
emergence of labor market polarization is
the increased adaption of computers in the
production process and more generally the
spread of ICT5
.
The intuition is that high-tech occupations
are capable of attracting a larger share
of (high skilled) employment through the
complementarity with the accumulation
of ICT capital. They will do so more than
occupations at the middle of the distribution
given the larger importance of ICT capital
intensity and resulting larger decrease in
relative prices as predicted by Baumol’s cost
disease6
. At the same time, middling sectors
are discarding more (less-skilled) workers
previously employed in routine labor tasks
which are now increasingly performed by
digital capital. These are drawn in by the
least capital intensive sectors at the bottom
of the distribution which are growing due
to the complementarity in consumption
and the growing taste for services in the
economy. These sectors, containing most
of the in-person services, are, as of yet, still
little affected by changes in ICT technology.
The lack of automation can be summarized
by a constraint referred to by Autor [2015]
as Polayni’s Paradox7
.
The scope for automation of certain tasks
is bounded since it requires an explicit
knowledge of the rules that govern them.
The paradox lies in the fact that, for now,
there still remain many tasks of which we
have only a tacit understanding of how we
perform them. This implies that they require
little effort for humans to accomplish but
still pose great difficulty for computer
programmers to put into computer
language. Still, in-person services are
inherently connected due to the increased
demand for these services over time; a
relation we will explore further in Section
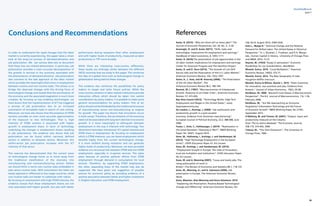
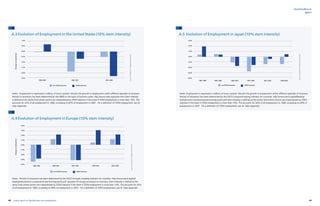
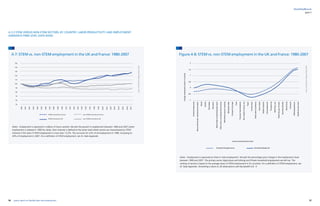
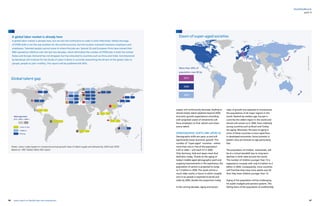
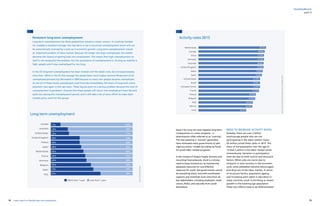
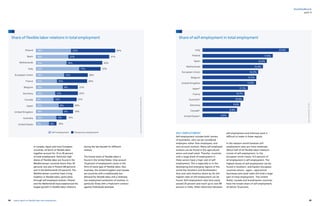
V. Taken together, routine-biased technical
change predicts that both the least and most
innovative or ICT intense sectors will increase
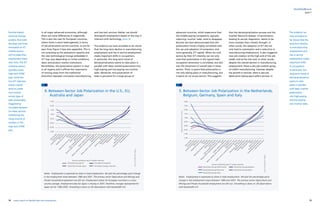
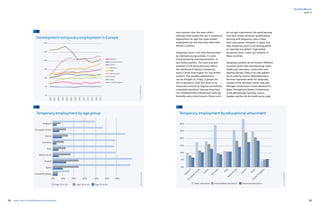
their employment share over time. Figure
4 shows the change in the employment
share of sectors between 1980 and 2007
that are ranked by their ICT capital intensity
for the US, EU, Australia and Japan based
on data from the EU KLEMS database 8,9
.
While there are cross-country differences, a
clear pattern of job polarization emerges,
this time not in terms of occupations,
but in terms of total employment in the
sectors. While in the previous section and
in most other papers, this phenomenon is
discussed in terms of employment change in
occupations ranked by the wage, this shows
that there are other dimensions through
which job polarization can be understood.
(see text box next page)
Figure 4 also shows the direct connection
between job polarization across sectors
and the decline in manufacturing sectors.
Given that sectors with a large share of
routine labor tasks are often part of the
manufacturing industry, we can expect these
to lose employment share over time. On
the other hand, sectors with a large share
of non-routine labor tasks are more often
services with varying levels of technology
present in production. E.g. both child day
care as well as financial consulting. That
is, we find services with rising shares of
employment at both ends of the distribution
of sectors according ICT capital intensity. This
is also suggestive of how these sectors differ
and how they are gaining employment
share for different reasons. The ICT intensive
sectors typically create high-tech STEM jobs,
while the low ICT intensive sectors would
tend to create non-routine service type of
jobs, presumably triggered by increased
demand for these services initiated by the
rising income of workers in the high-tech
STEM jobs. It is striking to note that this
polarization trend has been taking place
part I
The growth of digital
capital performing
certain tasks is a
phenomenon that
changes not only
the size but also
the composition of
sectors.
The scope for
automation of certain
tasks is bounded since
it requires an explicit
knowledge of the
rules that govern
them. The paradox
lies in the fact that,
for now, there still
remain many tasks of
which we have only
a tacit understanding
of how we perform
them. This implies
that they require little
effort for humans to
accomplish but still
pose great difficulty
for computer
programmers to
put into computer
language.
Job polarization
and automation
process forces us to
move away from
the traditional
classification of
the economy into
manufacturing and
non-manufacturing
sectors. Rather we
should think in
terms non-routine
tasks embedded
in jobs versus
routine tasks.
With automation
the latter are
easily replaced
or offshored
to low-wage
countries, while
non-routine tasks
are harder to
substitute with
robots.
II. The Role of
Technology
5 Unfortunately, empirical measures on the ‘routiness’ and ‘offshorability’ of jobs most often overlap, even though they are distinct concept. Given the necessary measurement error inherent to each of these measures, one
must be careful in how much one can claim to disentangle these two forces. 6 Baumol’s [1967] original thesis stated that, if productivity growth is unbalanced across sectors, sectors with lower productivity growth will see
their relative output price as well as their share in total employment increase. Moreover, he argued that unbalanced productivity growth would lead to an increasing share in GDP for less innovative sectors, and thus to a
slowdown in sector-weighted aggregate growth. 7 Polanyi was an economist, philosopher and chemist who in 1966 observed that, “We know more that we can tell”. [Polanyi 1966; Autor 2015] .
8 The latest update of the EU KLEMS data project covers data until 2007. While we do miss information on the last ten years, including the great recession, this data allows us to spot long run trends in job growth and
polarization. To analyze more recent trends, we will therefore be using alternative data sources, including the European Labor Force Survey amongst others. 9 ICT capital intensity is defined as ICT capital compensation
relative to the total income from production measured in value added and is taken from the EU KLEMS data (see data appendix for more details). ICT capital compensation is the product of the ICT capital stock (consisting
of office and computing equipment, communication equipment and software) and its user cost [Timmer et al., 2007]. We define this in the year 2005, but if we take a different year, the ranking remains the same. In the
appendix, table A1, we provide an overview of sectors ranked by their ICT intensity. We can note that sectors like ‘financial intermediation’, ‘post telecom’ are typically among the highest users of ICT, as expected.](https://image.slidesharecdn.com/6c937ee4-9f4e-4f1d-ac63-67d597b4ad02-161025215913/85/Flexibility-work-2016-7-320.jpg)
![20 21yearly report on flexible labor and employment
flexibility@work
2.3. WITHIN-SECTOR ANALYSIS
So far, the evidence shows that the surge
in digital technology enabled by the
implementation of key technologies and
the presence of STEM workers had an
important role in explaining the recent
changes in the composition of the labor
market. In the previous subsection, this has
been shown for changes in the sector level
employment shares. Arguably, the influence
of technology should also be visible in
similar changes in employment away from
routine tasks taking place within sectors.
Therefore, we explore how polarization
takes place within sectors and how this
relates to the ICT intensity of a sector,
returning to employment at the level of
occupations. To this end, we use data from
EUROSTAT on employment in 10 broad
occupational categories in various sectors
for the years 2008-201411
. This data covers
not only the EU 28, but also countries
like Norway, Switzerland and Turkey, 34
countries in total. Following Goos et al
(2014) we group these 10 occupational
categories in three, ‘low-paying’, ‘middle-
paying’ and ‘high-paying’ occupations12
.
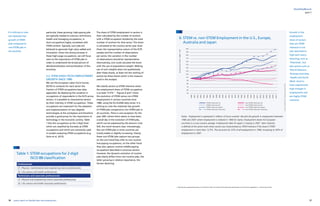
In Table 2 and Table 3 we show, by sector,
the average change in employment
shares for each of these three broad
occupational groups, averaged over all
countries in our sample. The appendix
provides a break-down by country.
While we cover only 7 years of data and
include the ‘great recession’, we find that
even in this relatively short time period
polarization continues to increase. In Table
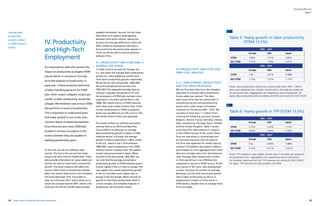
2, we can note that for the major sectors,
Construction, Manufacturing and Services,
the share of middle-paying jobs, associated
with routine tasks, has been declining
between 2008-2014, with 4%, 3.1%
and 3.1% respectively. The share of the
high-paying jobs has been increasing with
5% in construction, 3% in Manufacturing
and 1.5% in Services. Only in Agriculture
we can note a different pattern, but
Agriculture represents only a tiny fraction of
total employment. The share of low-paying
occupations has also gone up, except in
Construction. It is also important to note
that the pattern of job polarization cannot
be pinned down to particular sectors. Job
polarization takes place within most sectors
(see Table 3). Routine jobs (middle-paying)
are on average declining in all sectors, while
most sectors see especially a strong relative
increase in high-paying occupations. For
low-paying occupations we see a mixed
picture, with most of them being either
stable or slightly increasing.
The fact that job polarization is taking place
within sectors indicates that substantial
part I
The fact that
we see such a
strong effect
with high-paying
occupations and
middle-paying
occupations
suggests that it
is technological
change that is
the main trigger,
affecting all sectors
in a similar way.
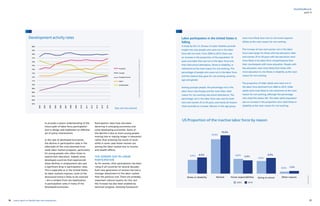
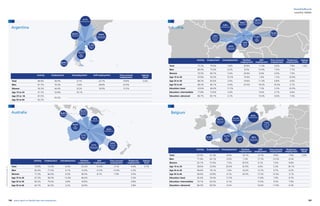
9. Employment shares across STEM intensity in
the Netherlands, Belgium, Germany, Spain, Italy
Notes: Employment is expressed as share in total employment. We plot the percentage point change
in the employment share between 1980 and 2007. The primary sector (Agriculture and Mining) and
Private household employment are left out. Employment shares for European countries is a cross-country
average. The ranking of sectors is based on the average share of STEM employment in EU countries. For
a definition of STEM employment, see AI. Data Appendix. Smoothing is done on 28 observations with
bandwidth 0.8.
Source:EUKLEMS2011ReleaseandEULFS2005
11 Eurostat does not publish data at the level of sector-occupations before 2008. 12 In particular, low-paying: ‘Elementary Occupations’, ‘Service and Sales Workers’, ‘Agricultural, forestry and fishery workers’; middle-
paying: ‘Armed Forced Occupations’, ‘Clerical Support Workers’, ‘Craft and Related Trades.
Workers’, ‘Plant and Machine operators’; high-paying: ‘Technicians and Associate Professionals’, ‘Professionals’, ‘Managers’
heterogeneity exists between firms and
type of occupations within sectors. The
fact that we see such a strong effect with
high-paying occupations and middle-paying
occupations suggests that it is technological
change that is the main trigger, affecting all
sectors in a similar way. We explore the role
of technology for within-sector employment
changes more directly in Figure 10.
Table 2: Job Polarization within Broad Sectoral
Classifications: 2008-2014
Notes : Occupation employment is grouped within a sector by the wage levels
according to the distinction made in Table 1, p4 of Goos, Manning and Salomons
[2014]. The changes across the period 2008-2014 are averaged across EU 28 plus
Norway, Switzerland and Turkey.
Source:EurostatELFS,authors’calculations
Sector High Middle Low
Agriculture -1.6% 0.8% 0.7%
Construction 5.3% -4.0% -1.2%
Manufacturing 3.0% -3.1% 0.0%
Services 1.4% -3.1% 1.7%
2.5%
2.0%
1.5%
1.0%
0.5%
0.0%
-0.5%
-1.0%
-1.5%
Hotelsrestaurants
Motorvehiclesale,maintenancerepair
Wood
Textiles
Realestate
Education
Retailtrade;householdgoodsrepair
Othercomm,socialpersonalservices
Manufacturingnec;recycling
Wholesaletrade
Transportstorage
Food
Financialintermediation
Non-metallicmineral,nec
Paper
Construction
Publicadmindefence
Basicmetals
Rubberplastic
Posttelecomm
Transporteq
Machinery,nec
Electricity,gaswater
Businessactivities
Electricaleq
Chemicals
Refinedpetroleum
Healthsocialwork
Changeemploymentsharesin%-points
Sectors ranked by STEM share
Smoothed change Netherlands Smoothed change Belgium
Smoothed change Germany
Smoothed change Italy
Smoothed change Spain](https://image.slidesharecdn.com/6c937ee4-9f4e-4f1d-ac63-67d597b4ad02-161025215913/85/Flexibility-work-2016-11-320.jpg)
![22 23yearly report on flexible labor and employment
flexibility@work
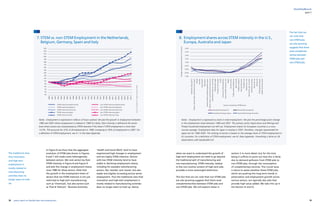
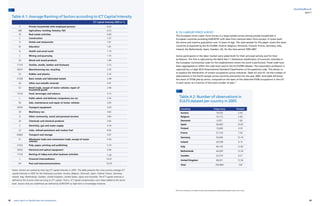
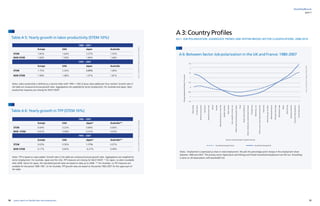
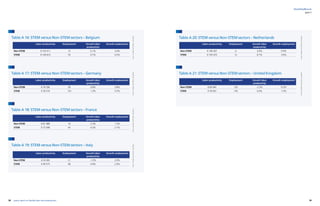
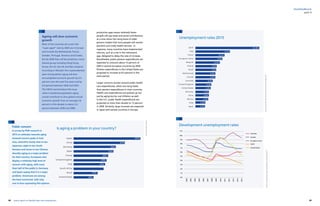
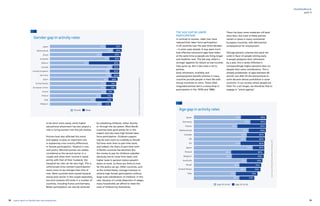
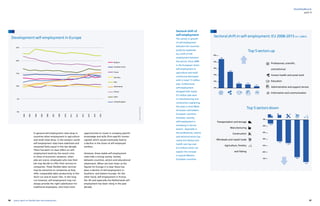
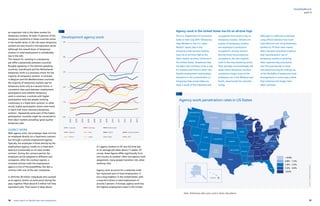
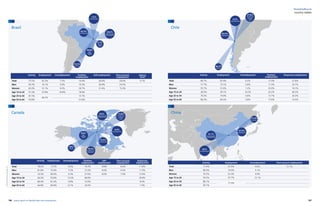
In Figure 10, we document for the years
2008-2014 the extent of job polarization in
various sectors, averaged over all countries in
our sample. On the vertical axis we measure
an index of job polarization, which we
construct by taking the sum of the change
in the employment share of the high-paid
and low-paid occupational groups. Recall
that we observe polarization within each
sector. Therefore, within each sector we
would expect to see a relative increase in
the high-paid as well as in the low-paid
occupations and hence the middle-paid
ones would decline relatively. We therefore
construct a job polarization index by simply
adding the shares of the low and high-paid
occupations and computing their growth
rate over time. Next, we want to explore
whether this relative increase in high-paid
and low-paid occupations within each
sector is correlated with the use of ICT. We
therefore measure on the horizontal axis ICT
intensity by sector. Hence, we rank sectors by
their ICT capital intensity, from low to high.
Each dot in Figure 10 represents the
average change between 2008 and 2014 in
the employment share of high- paid and
low-paid occupations in a particular sector.
Since both types should become relatively
important, we would expect positive
growth rates of their employment shares.
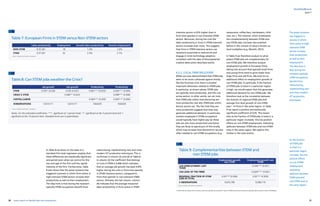
In Figure 10, all points, except for the sector
Agricultural are located above zero, which
indicates that in all sectors polarization, as
measured by our index, has increased. We
obtain three additional important insights
from the pattern shown in Figure 10: First,
there is heterogeneity in polarization across
sectors. For instance, we can note that
polarization is higher in ‘Finance’ then in
‘Retail and Wholesale Trade’. Second this
polarization tends to be correlated with ICT
intensity. We can note a positive correlation
between ICT intensity and our polarization
index. Third, this is not just restricted to
manufacturing sectors, but equally so in
services. In particular, in Figure 10, ‘Financial
Services’ and ‘Telecom, publishing and IT
services’ are among the most intensive
ICT adopters, clearly they seem to also be
experiencing substantial polarization. (10)
So far, we have looked at job polarization
reflected in differential growth rates of
various occupations, where the employment
in the high-tech, typically, high-skilled
and abstract occupations as well as low
paid service jobs tends to have grown
disproportionately at the expense of middle
type, routine occupations. The growth of
both low- and high-tech employment can
be explained by complementarities between
high-skilled and low-skilled non-routine
occupations. This affirms the role of
technology as a main driver for the changes
that are found both within and between
sectors. Taken together, the three types of
measurements reviewed in this section, all
point in the direction of digital technology
driving the aggregate evolution captured
by deindustrialization and job polarization.
This can be explained by the hypothesis
of routine biased technical change where
digital technology substitutes for the routine
task content of employment. Given that
this innovation and presence of routine
tasks cannot be restricted to the traditional
distinction between manufacturing and
services, this evidence calls for a new view
of the labor market where we cut through
the data by looking at task content and
susceptibility to technological change.
part I
10. Employment Share changes, Within-Sectors ranked
by ICT intensity: 2008-2014
Source: Eurostat, EU KLEMS and Authors’ calculations
Notes:ThisfigureplotsthedatainTable3afterrankingsectorsbased
ontheirICTcapitalintensitytakenfromtheEUKLEMSdatabase.
Table 3: Job Polarization within Narrowly
Defined Sectors: 2008-2014
Source:EurostatELFS,authors’calculations
Notes : Occupation employment is grouped within a sectpr by the wage
levels according to the distinction made in Table 1, p4 of Goos, Manning and
Salomons [2014]. The changes across the period 2008-2014 are averaged
across EU 28 plus Norway, Switzerland and Turkey.
Sector High Middle Low
Administrative support -1.3% -1.0% 2.3%
Agriculture -2.5% 1.4% 1.1%
Arts 2.9% -2.9% 0.0%
Construction 4.1% -2.6% -1.4%
Education -0.9% -0.3% 1.3%
Electricity, Gas 12.3% -11.9% -0.4%
Financial 5.6% -6.1% 0.5%
Health 3.2% -1.3% -1.9%
Hotels Restaurants -0.5% -0.4% -0.9%
Household services 1.2% -1.7% 0.5%
Manufacturing 3.0% -3.1% 0.1%
Mining 2.9% -1.9% -1.0%
Other services 3.4% -2.1% -1.3%
Public services 3.2% -3.7% 0.5%
Publishing, Telecom, IT 3.5% -4.6% 1.1%
RD, business services 2.6% -2.2% -0.3%
Real Estate 2.2% -2.8% 0.6%
Transport 1.0% -1.2% 0.1%
Water supply 9.2% -2.7% -6.5%
Wholesale Retail -4.3% -4.1% 8.4%
Extra-territorial organizations 1.0% -7.7% 6.6%
12%
10%
8%
6%
4%
2%
0%
-2%
ICT capital intensity
0% 5% 10% 15%
AGRICULTURE
MINING
MANUFACTURING
ELECTRICITY, GAS
WATER SUPPLYCONSTRUCTION
WHOLESALE RETAIL
TRANSPORT
HOTELS RESTAURANTS
PUBLISHING, TELECOM, IT
FINANCIAL
REAL ESTATE
RD, BUSINESS SERVICES
ADMINISTRATIVE SUPPORT
PUBLIC SERVICES
EDUCATION
HEALTH
ARTS
OTHER SERVICES
HOUSEHOLD
SERVICES](https://image.slidesharecdn.com/6c937ee4-9f4e-4f1d-ac63-67d597b4ad02-161025215913/85/Flexibility-work-2016-12-320.jpg)
![34 35yearly report on flexible labor and employment
flexibility@work
is a STEM occupation. On the other hand,
a manager, which may not be regarded
as high-tech per se, is considered as such
if he or she is working in a high-tech
sector. This generates four components of
high-tech employment: STEM occupations
in high-tech sectors, STEM occupations
outside high-tech sectors, and non-STEM
employment in high-tech sectors.
To take into account that the interpretation
of the empirical results may not be causal
if, for example, there are shocks at the
regional level which affect both high-tech
and other employment, the authors
suggest a correction in constructing
Instrumental Variables. The instruments
are based on taking the average growth
in high-tech employment in the country,
excluding the growth of the region for
which the instrument is calculated. In
addition, this instrument is expanded to
the four different components of high-tech
employment based on their definition. See
Goos et al. (2015, p6-7) for further details.
The authors report the results for the
OLS and IV specification using either or
both of the instruments described for
5-year growth periods. The OLS estimates
suggest that the creation of one high-tech
job leads to the creation of 2.57 jobs in
other employment within that region.
The IV specification provides substantially
larger estimates. Regardless of the
specified instruments, the estimated local
multipliers suggest that for every high-tech
job, 4.75 other jobs are created in the
region. This is robust to restricting the
growth in high-tech employment to STEM
occupations. That is, if we consider growth
in high-tech employment only as the
growth in STEM occupations and exclude
non-STEM employment in high-tech
sectors, the estimated local multiplier
still equals 2.8 when applying OLS and
4.45 when making use of the introduced
instruments17
. The definition of high-tech
employment, which is more specified
towards the presence of innovation may
explain the difference in magnitude of the
estimated job multiplier with respect to the
previous evidence.
In sum, regional growth in high-tech
employment can be connected to an even
stronger growth in other employment,
which may be explained by the presence
of complementarity in consumption
and spillover effects in demand. This
can explain why there is growth also
beyond STEM occupations as a second
order effect of innovation taking place.
The estimates suggest that, on average,
with the introduction of one high-tech
workers between 2.5 and 4.4 jobs are
created outside high-tech employment.
This also implies that policies geared
towards high-tech employment can
boost both employment groups which
we know are under increased demand
due to technological progress and their
non-routine nature. Contrary to what
is sometimes considered, the boosting
of high-tech employment helps rather
than hurts growth of employment at the
bottom.
5.2. STEM EMPLOYMENT AND
HUMAN CAPITAL
Given the evidence of positive spillover
effects of STEM employment and its
robustness to economic shocks, it becomes
increasingly important to understand how
we can gear policy towards supporting the
growth in these occupations. This section
tries to shed some light on the potential
policy implications of the importance of
STEM employment at the country level in
creating higher levels of economy-wide
employment growth which may also prove
to be more resilient to negative shocks in
the economy.
part I
The estimates
suggest that, on
average, with
the introduction
of one high-tech
workers between
2.5 and 4.4 jobs
are created
outside high-tech
employment. This
also implies that
policies geared
towards high-tech
employment
can boost both
employment
groups which
we know are
under increased
demand due to
technological
progress and
their non-routine
nature. Contrary to
what is sometimes
considered,
the boosting
of high-tech
employment
helps rather than
hurts growth of
employment at the
bottom.
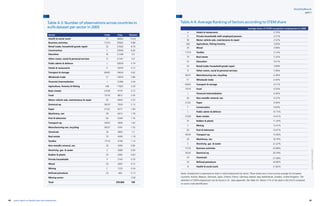
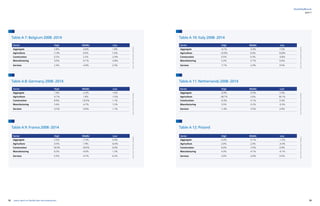
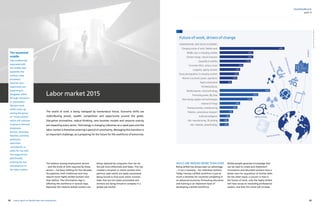
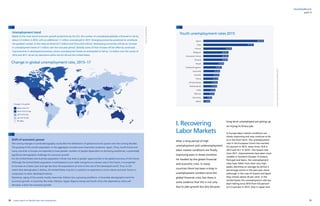
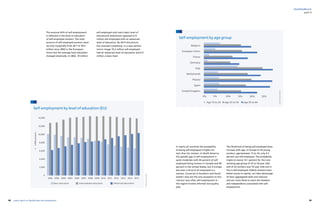
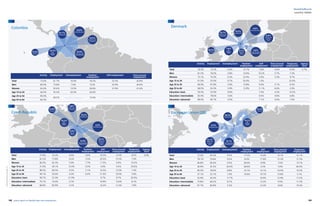
and ‘service non-routine jobs’ becomes
clear from Figure 15, which shows that
high-tech employment is often regionally
concentrated. Typically these tech hubs
are in major urban areas throughout the
continent and in regions with highly skilled
workforces.
Goos et al. (2015) consider therefore
the existence of a local high-tech job
multiplier with regional data at the NUTS
2 level of 27 countries of the European
Union. Moreover, the authors expand
the definition of high-tech employment.
Starting with the high-tech employment
at the sector level, it includes all
workers employed in manufacturing
sectors defined by a high ratio of
RD expenditure over value-added
and in knowledge-intensive services
characterized by a high share of tertiary
educated workforce. In addition,
high-tech employment is determined by
employment in STEM occupations which
are located across both high-tech and
other sectors. This implies that high-tech
employment is captured both through the
specificity of the occupation itself or the
innovation character of sector activity. For
example, we consider an engineer to be
high-tech employment regardless of the
sector he or she is working in because it
17 These results can be found in greater detail in Table 3 of Goos et al. [2015].
15. Regional distribution high-tech jobs
Source:Goos,Hattaway,Konings,Vandeweyer(2013)
High-Tech Jobs Share
13,5% to 20,4%
11% to 13,5%
9% to 11%
6,5% to 9%
3% to 6,5%](https://image.slidesharecdn.com/6c937ee4-9f4e-4f1d-ac63-67d597b4ad02-161025215913/85/Flexibility-work-2016-18-320.jpg)
![36 37yearly report on flexible labor and employment
flexibility@work
Policies on how to boost STEM employment
may remain important as Figure 6 and
7 show that country level differences
in the share of STEM employment are
not decreasing. Goos et al. (2015) also
present the existence and persistence of
regional dispersion both at the country
and regional NUTS-2 level. While they also
argue that convergence between regions
is taking place, it is very slow. At the rate
that the authors estimate it would take
Europe’s lagging regions at least 60 years
to close half of the gap with Europe’s more
high-tech intensive regions.
There exist many possible explanations for
such regional differences, which are very
difficult to detangle and to causally relate.
This section provides some suggestive
evidence taken on the importance of
Human Capital growth for the share of
high-tech employment. Figure 15 plots on
the horizontal axis, a country’s expenditure
on RD in higher education as a share of
GDP in 2011.
A clear positive relationship can be
discerned between the expenditure in
RD in higher education and the share of
high-tech employment across countries.
However, the figure also suggests that
some countries make better use of their
investments than others. While countries
like Lithuania and Portugal spend more or
less equal amounts of investment in RD
as a share of their GDP as countries such
as Belgium and Germany, their high-tech
employment share is only half, which
suggests a potential doubling of their
high-tech employment share by spending
their investments in RD in higher
education more effectively.
The authors provide a second indicator
at the country level for the importance
of high education to boost STEM
employment: the share of tertiary educated
aged 24-64 in a country. These results are
reproduced in Figure 17.
Again, the relationship is positive,
suggesting that a higher share of tertiary
educated can be associated with a high
share in high-tech employment. The
correlation is relatively weak though
indicating that increasing the share
of tertiary educated is less effective in
fostering the growth of STEM occupations
in a country. One reason for this may be
that the quality of the education rather
than the quantity matters for the growth
of high-tech employment. In other words,
the 33% share of tertiary educated in
Spain may have a different content that
the 33% share in the Netherlands or
in Denmark18
.
In sum, low public investment in (higher)
education both in terms of quantity and
quality may be holding back growth in
high-tech employment and is one of the
reasons why there is such persistence
in the differential growth of high-tech
employment between regions. This
suggests that regions should consider
increasing their investment in tertiary
education and in RD in higher education
in particular as means to boost their
high-tech employment growth. Still, the
presence of wide cross-country variation
suggests that some caution is necessary.
Not all expenditure in (higher) education is
equal and countries should consider policy
measures careful, also when adopting them
from other, seemingly successful contexts.
part I
In sum, low public
investment in
(higher) education
both in terms
of quantity and
quality may
be holding
back growth
in high-tech
employment and is
one of the reasons
why there is such
persistence in the
differential growth
of high-tech
employment
between regions.
This suggests that
regions should
consider increasing
their investment in
tertiary education
and in RD in
higher education
in particular as
means to boost
their high-tech
employment
growth.
18 The authors show that the correlation increases when restricting the share of tertiary educated to those with high literacy proficiency levels or when examining the regional differences in tertiary attainment within countries.
16. High-tech employment share in 2011
17. High-tech employment share in 2011
Source:Goosetal[2015,p31]
Source:Goosetal[2015,p32]
16%
14%
12%
10%
8%
6%
4%
2%
0%
16%
14%
12%
10%
8%
6%
4%
2%
0%
AUSTRIA
HUNGARY
DENMARK
MALTA
CYPRUS
LITHUANIA
SPAIN
PORTUGAL
SLOVENIA
BELGIUM
IRELAND
ESTONIA
NETHERLANDS
CZECH REPUBLIC
LUXEMBOURG
FINLAND
ROMANIA
SLOVAKIA
BULGARIA
ITALY
GREECE
POLAND
GERMANY
LATVIA
FRANCE
SWEDEN
UNITED KINGDOM
AUSTRIA
IRELAND
SPAIN
ROMANIA
CYPRUS
LUXEMBOURG
HUNGARY
UNITED KINGDOM
DENMARK
NETHERLANDS
BELGIUM
ITALY
FINLAND
SWEDEN
CZECH REPUBLIC
LATVIA
ESTONIA
POLAND
BULGARIA
LITHUANIA
FRANCE
SLOVENIA
GERMANY
MALTA
GREECEPORTUGAL
Share of population aged 25-64 with tertiary education in 2011
Expenditure on RD in higher education as share of GDP in 2011
HighTechemploymentsharein2011
HighTechemploymentsharein2011HighTechemploymentsharein2011
10%
0.0%
15%
0.1%
20%
0.2%
25%
0.3% 0.4% 0.5% 0.6% 0.7% 0.8% 0.9% 1.0%
30% 45%35% 40%](https://image.slidesharecdn.com/6c937ee4-9f4e-4f1d-ac63-67d597b4ad02-161025215913/85/Flexibility-work-2016-19-320.jpg)
![40 41yearly report on flexible labor and employment
flexibility@work
part I
APPENDIX A 1. Data Appendix
LIST OF FIGURES AND TABLES
Figure A 1: Evolution of Employment in the U.S., Europa, Australia and Japan 46
Figure A 2: Evolution of Employment in the Netherlands, Belgium, Germany, Spain and Italy (10% stem intensity) 47
Figure A 3: Evolution of Employment in the United States (10% stem intensity) 48
Figure A 4: Evolution of Employment in Europe (10% stem intensity) 48
Figure A 5: Evolution of Employment in Japan (10% stem intensity) 49
Figure A 6: Between-Sector Job polarization in the UK and France: 1980-2007 51
Figure A 7: STEM vs. non-STEM employment in the UK and France: 1980-2007 56
Figure A 8: STEM vs. non-STEM employment in the UK and France: 1980-2007 57
Table A 1: Average Ranking of Sectors according to ICT Capital Intensity 42
Table A 2: Number of observations in EULFS dataset per country in 2005 43
Table A 3: Number of observations across countries in EULFS dataset 44
Table A 4: Average Ranking of Sectors according to STEM share 45
Table A 5: Yearly growth in labor productivity (STEM 10%) 50
Table A 6: Yearly growth in TFP (STEM 10%) 51
Table A 7: Belgium 2008 -2014 52
Table A 8:Germany 2008 -2014 53
Table A 9: France 2008 -2014 54
Table A 10: Italy 2008 -2014 53
Table A 11: Netherlands 2008 -2014 53
Table A 12: Poland 53
Table A 13: United Kingdom 2008 -2014 54
Table A 14: Yearly growth in labour productivity (STEM 13.5%) 54
Table A 15: Yearly growth in Total Factor Productivity (STEM 13.5%) 56
Table A 16: STEM versus Non-STEM sectors – Belgium 58
Table A 17: STEM versus Non-STEM sectors – Germany 58
Table A 18: STEM versus Non-STEM sectors – France 58
Table A 19: STEM versus Non-STEM sectors – Italy 58
Table A 20: STEM versus Non-STEM sectors – Netherlands 59
Table A 21: STEM versus Non-STEM sectors – United Kingdom 59
A. EU KLEMS
Based on harmonized data from the National
Statistics of several OECD countries the authors
Timmer et al. [2007] have compiled a country-
sector level dataset over a long period of time,
1970-2007. This dataset contains information
on sectors (ISIC rev 3. which overlaps with NACE
rev. 1) concerning: Value added, output volume,
labor and capital input and output prices (a.o.).
Interesting is that the employed capital can
be split into ICT and non-ICT. This allows us to
compute an indicator on a sector’s susceptibility to
advances in digital technology.
In order to have consistent information between
1980 and 2005/2007, we confine the analysis to
the following 15 countries: Austria, Belgium,
Denmark, Finland, France, Germany, Italy, Ireland,
the Netherlands, Spain, Sweden, UK, United
States, Japan and Australia. Information on the
United States starts in 1980 which is why we take
this as a starting point.
For the majority of summary statistics, a cross-
country average of European countries will be
used. This leaves us with 4 country indicators, EU=
average of European countries, US= United States,
JPN= Japan, AUS=Australia.
In order to deploy the largest variation possible at
the sectors level, we chose the most disaggregated
sector level at which we could still find consistent
information on ICT capital compensation. This
leaves with a total of observations for 31 sectors,
as presented in Table 1. These 31 sectors are
ranked according to their ICT capital intensity,
which is the ICT capital compensation relative
to the total income from production measured
in Value Added. EU KLEMS defines ICT capital
compensation as the product of the ICT capital
stock (consisting of office and computing
equipment, communication equipment and
software) and its user cost. See Timmer et al.
[2007] for details. This measure is an indication
of the importance of ICT in the production
process and therefore also of the potential for
implementation of digital technology. ICT capital
intensity is therefore a number between zero and
one where zero would indicate that ICT capital
does not have any role to play in production
in which case there is also no susceptibility for
advances in digital technology, see Table A1.
Given that the ranking of sectors according to this
measure is consistent over time, we make us of ICT
capital intensity as measures in 2005. Note that to
investigate employment polarization along this
dimension we leave out the primary sector. Also,
we leave out the sector ‘P: Private households with
employed persons’, due to data limitations.
Alternatively we group sectors under.
Manufacturing and Services. Manufacturing
contains the sum of employment that falls under
the sector section ‘D’ while Services encompasses
everything from ‘G’ to ‘P’ as suggested by the
OECD.19
This leaves out the primary sectors Agriculture,
Forestry and Fishing; Mining and Quarrying; Gas,
Water and Electricity Supply; and Construction.
Note that Gas, Water and Electricity Supply and
Construction are included in the statistics on job
polarization where we only make use of the ICT
capital intensity to rank sectors.
19 https://stats.oecd.org/glossary/detail.asp?ID=2432](https://image.slidesharecdn.com/6c937ee4-9f4e-4f1d-ac63-67d597b4ad02-161025215913/85/Flexibility-work-2016-21-320.jpg)


![94 95yearly report on flexible labor and employment
flexibility@work
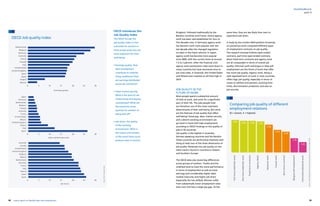
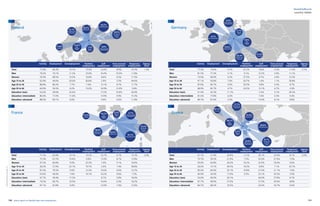
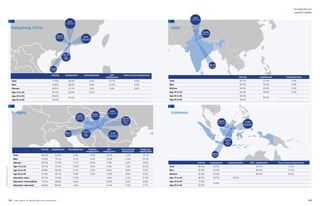
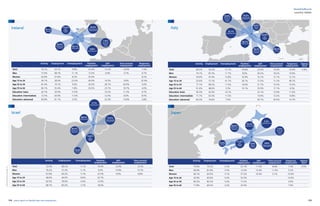
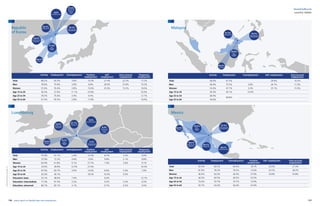
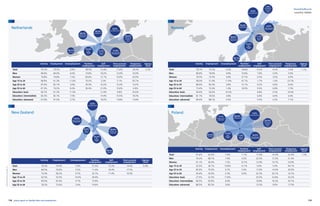
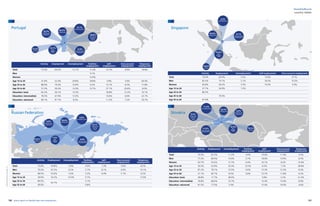
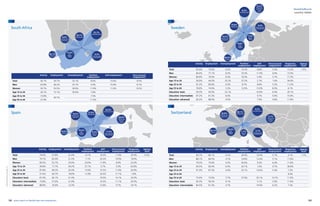
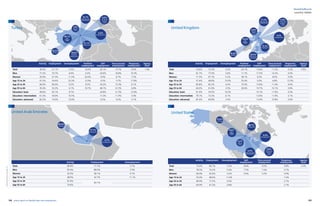
Agency work penetration rates and fte (in 1,000’s)
UK
AU
NL
LU
US
DE[1] FR
BE
JP CH AT
SE PL FI NO SG[1]
CZ MK[1]
IT DK EE MA ES HR
AR
NZ
BG[2]
MX[1]
RO[1]
LT
GR
BR
0,1%
0,2%
0,2%
0,2%
0,3%
0,3%
0,4%
0,4%
0,4%
0,5%
0,7%
0,7%
0,7%
0,9%
0,9%
0,9%
1,0%
1,1%
1,2%
1,3%
1,4%
1,4%
1,6%
1,7%
2,0%
2,0%
2,0%
2,1%
2,2%
2,6%
2,7%
3,7%
3,9%
IE[2]
US
MX
3,192
95
29
65
3,006
21,900
20
1,262
115
EUR
IN
JP
SG
AU
225
MA
BR
AR
Source:CiettEconomicreport2016,data2014
NO
SE
FI
EE
LV
LT
PL
DK
NL
BE
UK
FR
ES
LU
CH
IT
AT
CZ
HU
HR
RO
BG
MK
GR
1,185
90
430
90
208
10
64
29 2O
4
2
0
198
46
6
66
5
47
139
6
75
79
2O
part II
Agency work give employers the opportunity to
adapt the size of their workforce to economic
conditions and at the same time facilitate job
matching by providing initial work experience. This
is particularly true for younger people, either during
their educational period or when starting on the
labor market, but also for the unemployed to find
their way back to the labor market. People who start
doing agency work out of unemployment will often
not return to unemployment after their assignment.
Although there are significant differences between
the countries, each show that agency work is a
stepping stone out of unemployment into work.
Clearly, people use the experience and skills they
obtain while working as an agency worker to make a
next move on the labor market.
People who start working as an agency worker can
do so either from employment or unemployment,
but also from education or inactivity. Through agency
work, they do not only have a good point of entry
to the labor market, but they are also able to stay
in employment after their agency work assignment
ended. In many countries agency workers receive
formal training, either directly through the agency,
or through bipartite funds set up by the agencies
and the trade unions. This makes sure that agency
workers get opportunities to keep developing
themselves in order to take another step on the labor
market. Being close to the labor market, employment
and recruitment agencies are excellently suited to
advice workers on the type of training to follow in
order to enhance their employability.](https://image.slidesharecdn.com/6c937ee4-9f4e-4f1d-ac63-67d597b4ad02-161025215913/85/Flexibility-work-2016-48-320.jpg)


- Deindustrialization and job polarization are two related phenomena capturing rapid changes currently taking place in the labor market. Specifically, job polarization captures how changes in employment shares of high-paid, low-paid and middle-paid jobs can be linked to technological change, which is masked by the traditional distinction between manufacturing and non-manufacturing employment. - Evidence shows that technological change, measured by ICT capital intensity and share of STEM employment, drives between-sector job polarization. Moreover, job polarization also occurs within narrowly defined sectors, consistent with technology being the underlying driving factor. - STEM employment is more resilient during recessions, associated with higher productivity, productivity growth and employment growth. This confirms that


