Download to read offline


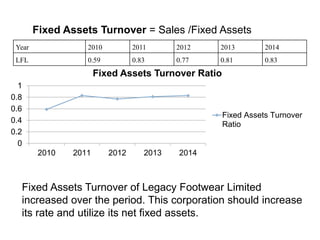
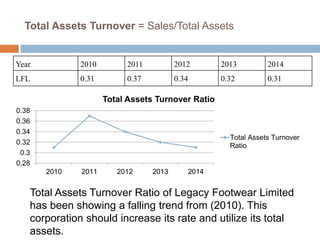


This document analyzes the financial ratios of Legacy Footwear Limited from 2010-2014. It finds that the company's performance was satisfactory in terms of fixed asset turnover, debt ratio, net profit margin, return on assets, return on equity, and market-to-book ratio. However, its current ratio, quick ratio, inventory turnover, days sales outstanding, total asset turnover, and price-to-earnings ratio need improvement over the years. In conclusion, the company needs to better utilize its current assets, reduce inventory levels, improve collection of receivables, and increase total asset utilization and share price.


