Download to read offline


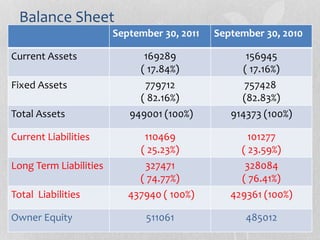
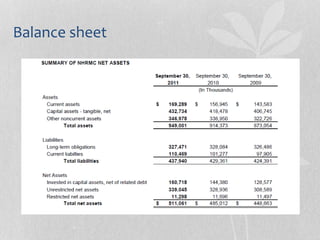
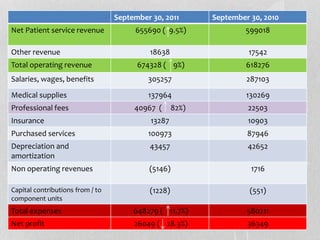
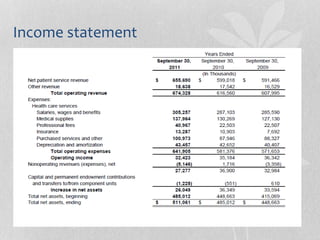
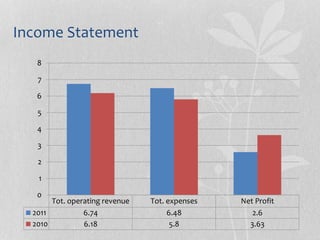
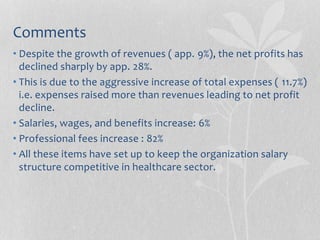
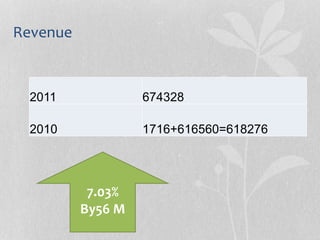
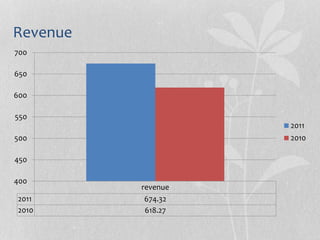
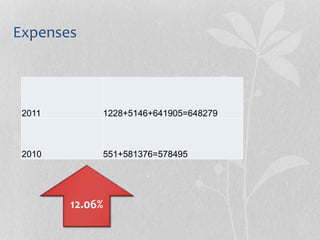
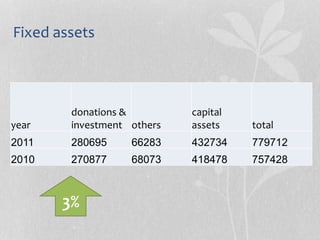
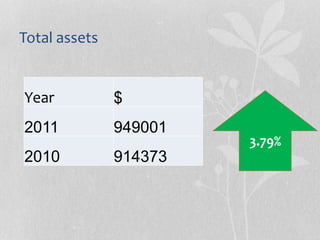
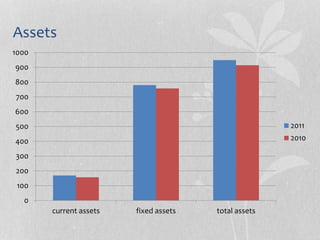

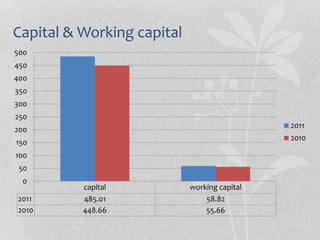


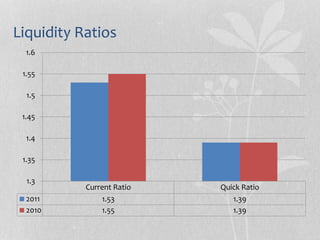
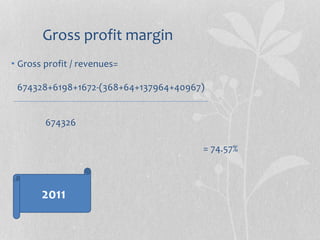
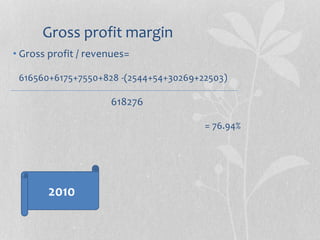
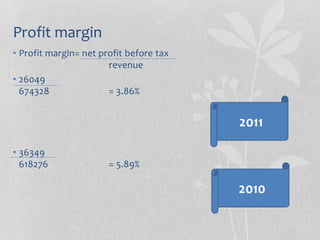
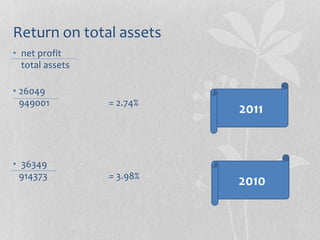
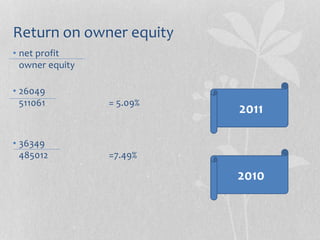
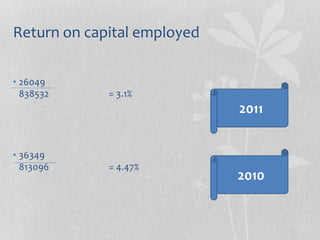
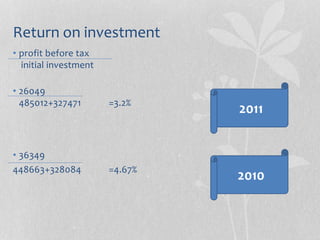
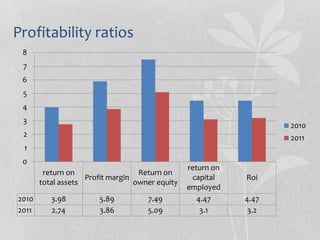
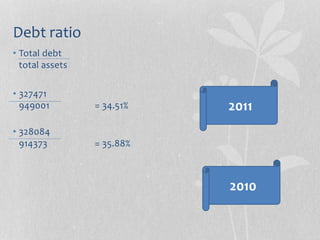

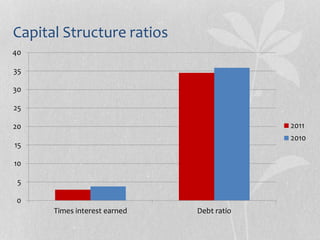
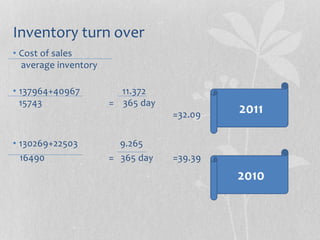


NHRMC is a major nonprofit healthcare provider in southeastern North Carolina. It had revenues of $674 million in 2011 but profits declined 28% to $26 million due to rising expenses outpacing revenue growth. Assets increased 3.8% to $949 million driven by capital improvements. Liquidity and debt ratios were stable while profitability metrics like return on assets declined from the prior year.