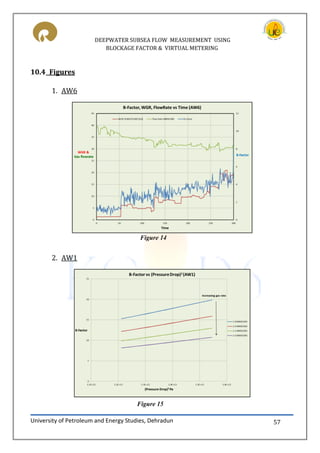
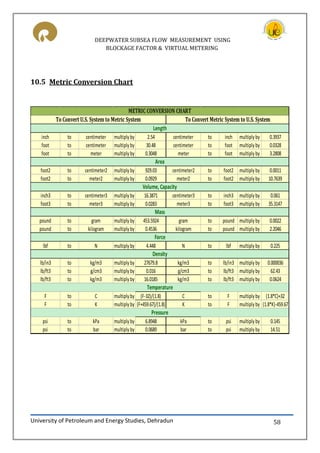
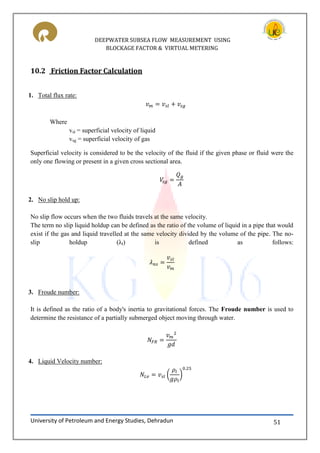
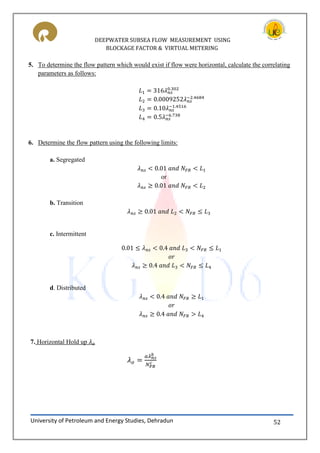
This document is a project report submitted by students to Reliance Industries Limited on developing techniques for subsea flow measurement in deepwater fields. It evaluates using blockage factor and virtual metering to detect blockages in subsea pipelines and estimate water-gas ratio trends. Blockage factor relates the excess pressure drop across a pipeline blockage to the blockage size. Virtual metering determines well flow rates using existing well instrumentation when direct meters are absent. The techniques were tested on the KG D6 gas and oil fields offshore India and can help optimize production and reservoir monitoring in deepwater fields.


![DEEPWATER SUBSEA FLOW MEASUREMENT USING
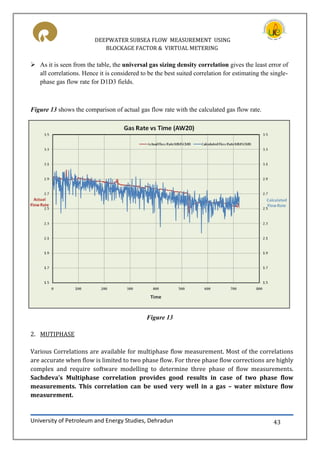
BLOCKAGE FACTOR & VIRTUAL METERING
University of Petroleum and Energy Studies, Dehradun 53
Where a, b and c are determined for each flow pattern from the table
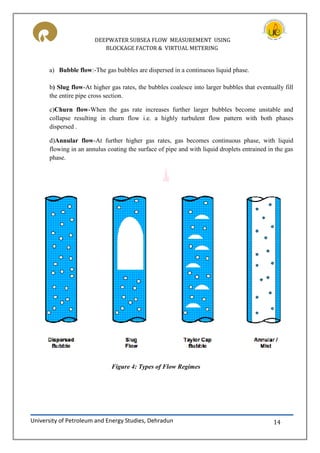
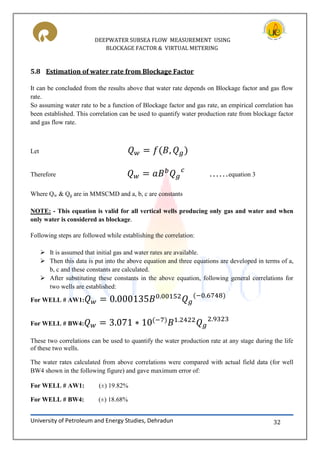
Flow pattern a b c
Segregated 0.98 0.4846 0.0868
Intermittent 0.845 0.5351 0.0173
Distributed 1.065 0.5824 0.0609
8. Calculate the inclination correction factor coefficient
Flow pattern d e f g
Segregated Uphill 0.011 -3.768 3.539 -1.614
Intermittent Uphill 2.96 0.305 -0.4473 0.0978
Distributed Uphill No correction No correction C=0
All flow patterns 4.70 -0.3692 0.1244 -0.5056
9. Calculate the liquid holdup inclination correction factor
[ ]
Where is the deviation from horizontal axis
10. Calculate the liquid holdup
11. Apply Palmer correction factor
12. When flow is in transition pattern, take the average as follows:](https://image.slidesharecdn.com/6370b9ee-2284-466d-8663-4535498a11eb-150821122054-lva1-app6891/85/Final-Report_on_Deep_water_flow_measurement-53-320.jpg)
![DEEPWATER SUBSEA FLOW MEASUREMENT USING
BLOCKAGE FACTOR & VIRTUAL METERING
University of Petroleum and Energy Studies, Dehradun 54
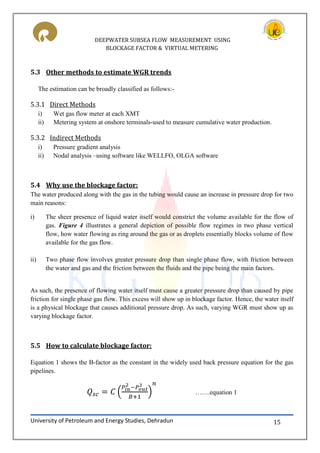
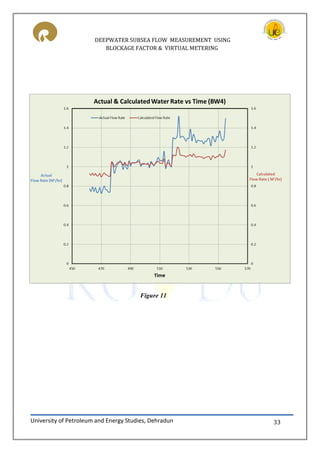
Where
Where the liquid holdup is calculated assuming flow is integrated, is the liquid holdup assuming
the flow is intermittent.
13. Calculate frictional factor ratio
Where s = [ ] [ ]
S becomes unbounded at a point in the interval 1<y<1.2; and for y in this interval, the function S is
calculated from
14. Calculate two phase friction factor
Reynolds Number is a dimensionless number that gives a measure of the ratio of inertial forces to
viscous forces and consequently quantifies the relative importance of these two types of forces for
given flow conditions.
The Reynolds Number is determined as:
μ](https://image.slidesharecdn.com/6370b9ee-2284-466d-8663-4535498a11eb-150821122054-lva1-app6891/85/Final-Report_on_Deep_water_flow_measurement-54-320.jpg)