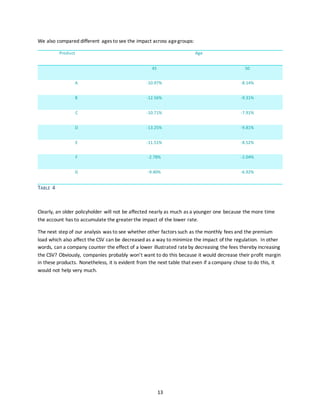
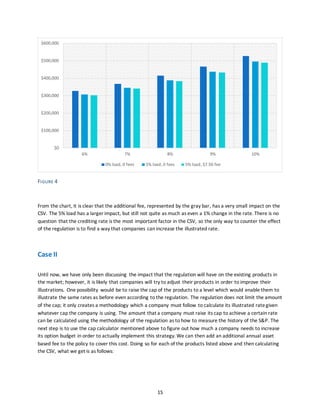
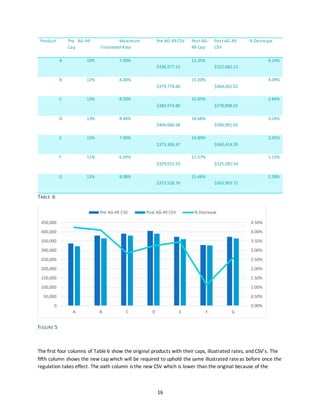
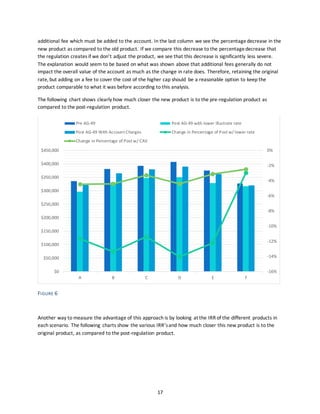
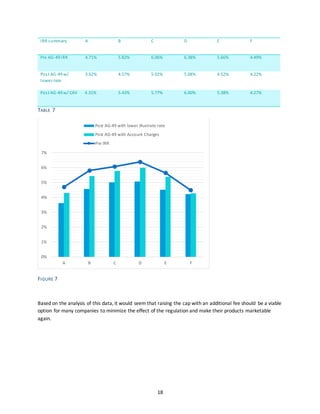
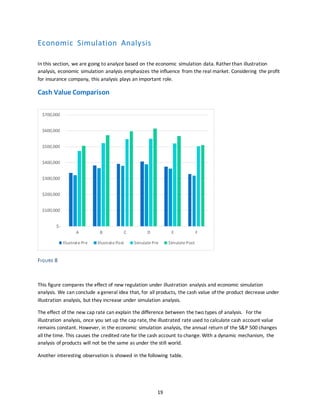
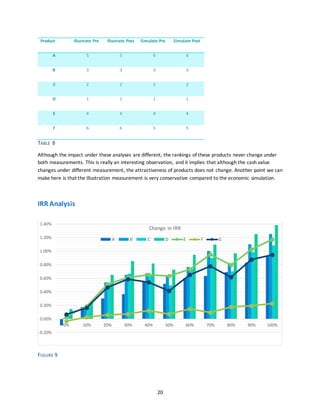
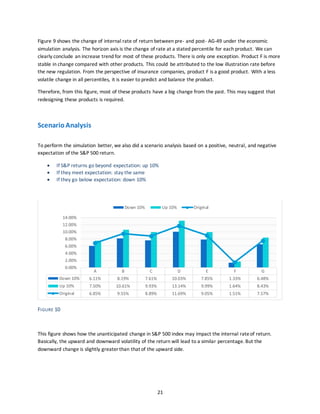
SlideShare a Scribd company logo
Integrated Project
Impact of AG-49 on IUL Product
2015 Summer
GROUP 2
DAVID ZOMBER LIHUA NIE
COLUMBIA UNIVERSITY| Actuarial Science Program
2
Table of Contents
INTRODUCTION...................................................................................................................................3
BACKGROUND.....................................................................................................................................3
CONCERNS AND OBJECTIVES.....................................................................................................................3
IUL PRODUCT ......................................................................................................................................4
FEATURES ..........................................................................................................................................4
NEW REGULATION AG-49.....................................................................................................................5
FEATURES OF THE NEW REGULATION...........................................................................................................5
ASSUMPTIONS AND TOOLS ..................................................................................................................6
ASSUMPTIONS ....................................................................................................................................6
CAP RATE CALCULATOR ..........................................................................................................................6
ACCOUNT VALUE CALCULATOR..................................................................................................................7
ECONOMIC GENERATOR .........................................................................................................................8
ILLUSTRATION ANALYSIS......................................................................................................................8
CASE I ..............................................................................................................................................8
CASE II ...........................................................................................................................................15
ECONOMIC SIMULATION ANALYSIS.....................................................................................................19
CASH VALUE COMPARISON ...................................................................................................................19
IRR ANALYSIS ...................................................................................................................................20
SCENARIO ANALYSIS............................................................................................................................21
SUMMARY........................................................................................................................................22
IMPACT OF ILLUSTRATION .....................................................................................................................22
WARNINGS BASED ON ECONOMIC SIMULATION............................................................................................22
REASONS COMPANIES MAY RESISTNEW CHANGES .........................................................................................22
PREDICTION .....................................................................................................................................23
PROJECT MILESTONES........................................................................................................................23
REFERENCES .....................................................................................................................................23
3
Introduction
Background
Over the last ten years, a number of life insurance companies have introduced a new product to the market
called Indexed Universal Life. In addition to the features of a typical Universal Life policy, which includes a
death benefit as well as a cash account which one can borrow from or use as a retirement savings account, it
also contains an indexed account. The indexed account is credited interest based on the performance of a
particular index, for example the S&P 500, but has a floor which prevents it from losing money if the index
underperforms. The money isn’t actually invested in the market, which keeps the cash value of the account
safe; however, the account can still earn significantly higher rates than a typical bond portfolio would get
because of its relationship to the particular index.
In recent years, this particular form of life insurance, called an IUL, has become increasingly popular, and
companies have begun to offer all sorts of IUL products with numerous different features and varying levels
of rates. Many companies have their own calculations for what the expected rates should be. In 2014, after
several life insurance companies raised concerns that some of the rates being offered were unrealistically
high and the products would never meet consumer expectations, it was suggested that some sort of
regulation be instituted to protect consumers and provide a more standardized system of calculating the
rates. In April 2015, after considerable deliberation, the Life Actuarial Task Force decided upon Regulation
AG-49 as the new standard, which must be followed in IUL Illustrations.
Concerns and objectives
With the adoption of AG-49, our clients’ concern is that it may influence the return of IUL product. For
potential consumers, the illustration plays an important role in explaining how this product may perform.
With a predictable lower illustrated rate, the cash value of the account at the terminal will definitely go down
as well. Although we may expect that companies will redesign their products after this new regulation, we
are still not sure how they may change these products.
Objectives of our project included:
 Understanding the influence of this new regulation on the IUL product
 Estimating the influence of this new regulation on IUL product
 Predicting the trend of new IUL products after this new regulation
4
IUL Product
Features
IUL is a variant of the Universal Life product. It has all of the same features as Universal Life such as:
 Whole life insurance policy + cash value of investment
The IUL product is a combination of two products: a whole life insurance policy and an investment
account. By holding a UL product, the policyholder will benefit from the death benefit and an increasing
investment account.
 Not a real investment –” TaxAdvantage”
The IUL product has an investment account, but this account does not directly invest money into equity
market. Instead, insurance companies use different financial derivatives to set limits of money they need
to pay policyholder. There is no real investment in the market and all involved investment vehicles are
bonds and options. That is where the tax advantage feature comes from. Benefitting from the lower tax
charge of bonds and deferred tax when no withdrawals occur, cash accumulation value in the investment
account would increase faster than in the other account, which is treated as an equity account.
Additionally, there are some unique features of IUL. Such as:
 Interest credited on specific index
Policyholder has options to choose which type of index they would like to set as their target index. The
variety of options can satisfy policyholder’s willingness to allocate their investment based on a rational
expectation of equity market.
 Principal protection
IUL products set a floor for its investment account. For every year, aside from the required fee charges
for the insurance company, the investment account cannot have a credited interest rate lower than the
stated floor rate. Most often, the floor rateis 0%, so the account cannot lose money, but some
companies offer products with 1% - 2% as the floor rate. This is actually a principal protection feature for
this product.
 Flexible choice of premium based on financial capability
For each year, policyholders can adjust the premium they would like to pay based on their current
financial capability. This helps to meet their financial needs while continuing to support an investment
account. Since there is no penalty for uneven payment, flexibility of premium payment is definitely a
good feature for policyholders.
5
Owning to all these advantages described here, IUL products have become an ideal choice for many people.
However, after this new regulation, some of these good features may become less appealing.
New Regulation AG-49
This new regulation was enacted by the LATF in April in response to numerous criticisms of current industry
practices. One complaint by members of the industry was that often companies offering what seems to be
the same exact product illustrate differing rates. The reason for this is that every company has its own system
of calculating the future expectation of the S&P based on its historical performance. This can be very
confusing for consumers who are trying to compare products. Another complaint came primarily from
companies who offer other life insurance products and not IULs that the rates being illustrated for IULs are
too unrealistic and will lead to consumer disappointment that will hurt the entire life insurance industry.
After much deliberation, AG-49 was agreed upon as a first step in regulating the IUL product.
Features of the newregulation
 Only for illustration purposes
This regulation does not directly influence the pricing of IUL product. However, it is reasonable to believe
that to make it appealing for potential customers, the pricing will be adjusted to meet this new
regulation with a better performance in illustration.
 Follow a specific methodology to calculate the illustration rate
In the appendix, the detailed methodology is explained in the original file from the National Association
of Insurance. In all cases, this new regulation asks all insurance companies to follow the same standard
rule to calculate their illustration rates. This means, under this new regulation, the cash value of accounts
in different products aremore comparable, since it removes the effects of varying illustrated rates and is
a better representation of cost and other charges from insurance companies.
 A Benchmark Index Account on the S&P 500, has 100% participation rate, 0% floor, and uses an
annual point-to-point strategy
This is a specific requirement for the definition “Benchmark Index Account”. All products with the
Benchmark Index Account must follow the requirements here.
 Use the averageof 25-year period backward for 65 years
This is the specific year requirement for benchmark index account to calculatethe illustration rate.
Considering that the S&P 500 has been used as an index from the beginning of 1950, this rule asks to use
6
the whole life-span record for the new calculation. According to the data, this would generally lead to a
decrease in the illustration ratefor all companies given the same cap rate.
 A company, which does not offer a Benchmark Index Account, should use actuarialjudgment to
determine an appropriate ratefor that account
This is the only way for actuaries to manipulate the illustration rate. Except the Benchmark Index
Account, which is specifically defined with a method to calculate its illustration rate, other accounts are
still allowed to have illustration rates based on actuarial judgment. There is a way to get a better
illustration rate through setting up an index account other than the Benchmark Index Account.
Assumptions and Tools
Assumptions
To simplify our project and focus solely on the illustration rate, we set up some assumptions here:
 For all products’ calculations, the policyholder’s information is listed here:
o Gender: Male
o Age: 45
o Health Status: Healthy
 Level Premium: $10,000 per year for 20 Years
 Standard setting with new regulation:
o Index Type: S&P 500
o Credit Method: Annual Point-to-Point
 Death benefit
o Type: Whole life insurance
o Payment type: Annual premiums
o Face amount: $500,000
o Mortality rate is provided by mentors
 Surrender charge is included using a fixed schedule
 Interest rateis set to be 4% for all of our products
 No withdrawals from the account in the 20-year period
Cap rate calculator
The cap rate is the greatest credit rate a policyholder can receive from the indexed account each year. For
the insurance company, this cap ratesets the upper limit of the cost to the policyholder. Combined with the
floor rate, they work as a collar strategy.
The objective of getting a proper cap rateis to lock the profit margin at the beginning of each term. In this
way, however the index price changes, the insurance company will be out of exposure based on this change.
As mentioned, an insurance company uses option combinations to set up limits for the product. The
following chart shows how the option budget works for insurance company.
7
FIGURE 1
The transactions involved in this chart are:
 Long a call at Strike price K1, represented with the yellow dot line.
 Short a call at Strike price K2, represented with the green cut line.
With the combination of these two call options, the actualprofit is locked in as shown by the red curve.
Therefore, the insurance company can set up the cap ratewith its own option budget.
In our calculator, we first use the data from proxy products to imply the target spread every company sets for
its IUL product. Then, based on the target spread, we recalculate a new cap ratewith the same illustrated
ratebefore new regulation. With the higher new cap rate, the option budget will increase. The change from
the previous option budget to the higher one is the new set of charges to the policyholder on an annual basis.
Account value calculator
This calculator is used to compute the account value.
Basically, the formula used in the account value calculator is:
∑ (𝐴𝑉𝑘−1 + 𝑃 − 𝐿 − 𝐴𝐶 − 𝐶𝑂𝐼 − 𝐶𝐴𝑉)𝑡
𝑘=𝑡−12
12
× (1 + 𝐶𝑅) − 𝑆𝑅 = 𝐴𝑉𝑡
where
AV = account value;
P = premium;
L = load;
AC = account monthly cost;
Cap Level for our product
Long a call at K1
Short a call at K2
Profit
Strike
8
COI1 = cost of insurance;
CAV = charges based on account value;
CR = interest credited rate;
SR = surrender charge
Economic generator
Assumptions:
 For the historical method, we assume that history will occur in the future. Therefore, it is
representative to choose a historical period to simulate the future.
 For the lognormal method, the daily return is a random variable. It follows a normal distribution,
where the mean equals the long-term mean of daily return, and the variance equals the square of
long-term daily volatility. Here we use the daily returns from 1959 Jan 1st to 2014 Dec 31st.
 Number of paths for simulation: 100
 To make products comparable, we use the same S&P 500 Index return for all products.
 The starting price in our simulation is 2103.84. This is the closing adjusted price of 2015 July 31st.
By combining this economic generator and account value calculator together, we are able to calculate the
cash value of products in any circumstance provided sufficient parameters.
Illustration Analysis
From here, we are going to use all these tools and models described above to analyze the IUL product. Since
the new regulation is for illustration purposes, we will have a detailed analysis from the illustration
perspective.
Case I
In order to properly analyze the impact that AG-49 will have on the current industry’s products, we took
seven of the top-selling IUL products and compared the change in the illustrated ratewhich will result from
the regulation as well as the change in cash surrender value (CSV) which is dependent primarily on the
crediting rate. It is important to reiterate that this change is only in the illustrated rate. The actual crediting
ratethat the policyholder receives is not impacted at all by the regulation only by the true performance of
the corresponding index and the parameters of the policy such as the cap rate, participation rate, and the
floor.
1 Cost of insurance charges for the death
benefit. The calculation based on the use of
an internal mortality table.
9
The products used in our analysis are modeled after realindustry products with each one being a Benchmark
Index Account as defined by the regulation having a cap, a 0% floor, 100% participation rate, an annual point-
to-point crediting strategy, and using the S&P alone as the index. However, the caps of these products do
vary, and each one has its own unique combination of fees and a different illustrated ratethat it offers its
customers. It would seem reasonable that measuring the impact on these products would be fairly
representative of the impact on the industry as a whole.
Here is a list of the seven products used in our analysis:
Product Cap Current Illustrated Rate Monthly Fee Premium Load
A 10% 7% 7.50 5.95%
B 12% 8% 7.50 5.9%
C 13% 8.2% 5.00 6%
D 13% 8.44% 5.00 5.5%
E 12% 7.90% 10.00 6%
F 11% 6.69% 7.50 5%
G 13% 8.08% 20.00 10% in year 1, 6% in years 2+
TABLE 1
To measure the affect that the regulation has on the CSV, we first had to calculate what the new illustrated
ratewill be for these products once the regulation takes effect. Using the parameters of the Benchmark Index
Account, the new illustrated ratewas calculated with the 25 year averages of the 65 years of the S&P as
required by the regulation with the only variable being the cap rate. We also measured the percentage
decrease in the illustrated rate. As is evident from the chart below, generally, the higher the rate, the greater
the decrease.
10
FIGURE 2
We then applied the new rate to the AV calculator given to us by one of our clients, which was described
above and is what companies use to calculate the CSV based on a number of parameters. Several of the
parameters we kept constant for all of our products such as the amount of the death benefit for which we
used $500,000 and an assumed interest rateof 4% used to calculate the whole life insurance death benefit.
In our original analysis, we also assumed that we are dealing with a healthy male age45 paying $10,000 per
year into the account for 20 years until he retires, but we tested other scenarios as well as will be shown
below. Figure 3 shows the comparison of the original products’ CSV with what the new CSV would be under
the regulation:
7.00%
8.00% 8.20% 8.44%
7.90%
6.69%
8.08%
6.01%
6.87%
7.25% 7.25%
6.87%
6.45%
7.25%
0.99% 1.13% 0.95% 1.19% 1.03% 0.24% 0.83%
0.00%
1.00%
2.00%
3.00%
4.00%
5.00%
6.00%
7.00%
8.00%
9.00%
1 2 3 4 5 6 7
Maximum Illustrated Rate
Current Rates New Regulation Rates Impact of AG-49
11
FIGURE 3
One interesting note which comes out from this chart is the change in the rankings of these products which is
shown in the following table.
Product Pre AG 49 Post AG 49 Changes
A 6 7 -
B 3 4 -
C 2 2
D 1 1
E 4 5 -
F 7 6 +
G 5 3 +
TABLE 2
Products C and D, which were ranked the highest because of a high cap rate that resulted in a higher
illustrated rateand a higher CSV, are still ranked the highest. However, Product F jumped ahead of Product A,
10.97%
12.56%
10.71%
13.25%
11.51%
2.78%
9.40%
0.00%
2.00%
4.00%
6.00%
8.00%
10.00%
12.00%
14.00%
0
50,000
100,000
150,000
200,000
250,000
300,000
350,000
400,000
450,000
1 2 3 4 5 6 7
Cash accumulation for 45 year-old with $10,000 premium
Pre AG-49 Post AG-49
Impact of AG-49 in Amount Impact of AG-49 in Percentage
12
because whereas prior to the regulation Product A seems to be a much better deal than Product F offering a
higher illustration rate despite the lower cap; after the regulation Product A with its lower cap than Product F
will be forced to illustrate at a lower rate. This is one of the purposes of the regulation, to act as an
“equalizer” not allowing companies to illustrate what might be considered unreasonably high rates relative to
the cap. Product G also jumped up because its ratewas also low in comparison to other products even
though it had a high cap. From the rankings we see that while all products in the IUL industry arebeing
affected by the regulation to an extent, within the industry the products that seem to be the “best deals” are
being impacted the most.
We then tested different premiums amounts to see if the impact is equal across all levels. While the
differences are indeed very slight, it is interesting to note that the greatest difference in all the products is at
$10,000, with $5,000 and $20,000 being virtually the same.
Product Premium
$5,000 $10,000 $20,000
A -10.85% -10.97% -10.86%
B -12.45% -12.56% -12.44%
C -10.61% -10.71% -10.60%
D -13.13% -13.25% -13.12%
E -11.40% -11.51% -11.40%
F -2.75% -2.78% -2.75%
G -9.32% -9.40% -9.31%
TABLE 3
13
We also compared different ages to see the impact across agegroups:
Product Age
45 50
A -10.97% -8.14%
B -12.56% -9.31%
C -10.71% -7.91%
D -13.25% -9.81%
E -11.51% -8.52%
F -2.78% -2.04%
G -9.40% -6.92%
TABLE 4
Clearly, an older policyholder will not be affected nearly as much as a younger one because the more time
the account has to accumulate the greater the impact of the lower rate.
The next step of our analysis was to see whether other factors such as the monthly fees and the premium
load which also affect the CSV can be decreased as a way to minimize the impact of the regulation. In other
words, can a company counter the effect of a lower illustrated rateby decreasing the fees thereby increasing
the CSV? Obviously, companies probably won’t want to do this because it would decrease their profit margin
in these products. Nonetheless, it is evident from the next table that even if a company chose to do this, it
would not help very much.
14
Product With regular premium loadandfees With 5% loadandnofees
A -10.97% -8.80%
B -12.56% -10.50%
C -10.71% -8.83%
D -13.25% -12.01%
E -11.51% -8.94%
F -2.78% -1.66%
G -9.40% -4.82%
TABLE 5
Even after removing the fees, and lowering the load to 5%, which is the lowest found in the industry, the
effect of the regulation is still pretty significant for most of these products. Only for product G, which charges
much higher fees than the other products. do we see a decrease of almost 50% in the impact of the
regulation by lowering the fees. For most products, the fees do not have a great impact on the CSV relative to
the crediting rate, and this is shown in the following chart.
15
FIGURE 4
From the chart, it is clear that the additional fee, represented by the gray bar, has a very small impact on the
CSV. The 5% load has a larger impact, but still not quite as much as even a 1% change in the rate. There is no
question that the crediting rate is the most important factor in the CSV, so the only way to counter the effect
of the regulation is to find a way that companies can increase the illustrated rate.
Case II
Until now, we have only been discussing the impact that the regulation will have on the existing products in
the market; however, it is likely that companies will try to adjust their products in order to improve their
illustrations. One possibility would be to raise the cap of the products to a level which would enable them to
illustrate the same rates as before even according to the regulation. The regulation does not limit the amount
of the cap; it only creates a methodology which a company must follow to calculate its illustrated rategiven
whatever cap the company is using. The amount that a company must raise its cap to achieve a certain rate
can be calculated using the methodology of the regulation as to how to measure the history of the S&P. The
next step is to use the cap calculator mentioned above to figure out how much a company needs to increase
its option budget in order to actually implement this strategy. We can then add an additional annual asset
based fee to the policy to cover this cost. Doing so for each of the products listed above and then calculating
the CSV, what we get is as follows:
$0
$100,000
$200,000
$300,000
$400,000
$500,000
$600,000
6% 7% 8% 9% 10%
0% load, 0 fees 5% load, 0 fees 5% load, $7.50 fee
16
Product Pre AG-49
Cap
Maximum
Illustrated Rate
Pre AG-49 CSV Post AG-
49 Cap
Post AG-49
CSV
% Decrease
A 10% 7.00%
$336,977.15
12.35%
$322,682.11
4.24%
B 12% 8.00%
$379,778.60
15.20%
$364,261.02
4.09%
C 13% 8.20%
$389,974.80
15.85%
$378,898.02
2.84%
D 13% 8.44%
$404,060.38
16.68%
$390,981.65
3.24%
E 12% 7.90%
$373,306.47
14.89%
$360,414.29
3.45%
F 11% 6.69%
$329,015.33
11.57%
$325,281.54
1.13%
G 13% 8.08%
$373,528.76
15.46%
$363,903.72
2.58%
TABLE 6
FIGURE 5
The first four columns of Table 6 show the original products with their caps, illustrated rates, and CSV’s. The
fifth column shows the new cap which will be required to uphold the same illustrated rateas before once the
regulation takes effect. The sixth column is the new CSV which is lower than the original because of the
0.00%
0.50%
1.00%
1.50%
2.00%
2.50%
3.00%
3.50%
4.00%
4.50%
0
50,000
100,000
150,000
200,000
250,000
300,000
350,000
400,000
450,000
A B C D E F G
Pre AG-49 CSV Post AG-49 CSV % Decrease
17
additional fee which must be added to the account. In the last column we see the percentagedecrease in the
new product as compared to the old product. If we compare this decrease to the percentagedecrease that
the regulation creates if we don’t adjust the product, we see that this decrease is significantly less severe.
The explanation would seem to be based on what was shown above that additional fees generally do not
impact the overall value of the account as much as the change in rate does. Therefore, retaining the original
rate, but adding on a fee to cover the cost of the higher cap should be a reasonable option to keep the
product comparable to what it was before according to this analysis.
The following chart shows clearly how much closer the new product is to the pre-regulation product as
compared to the post-regulation product.
FIGURE 6
Another way to measure the advantage of this approach is by looking at the IRR of the different products in
each scenario. The following charts show the various IRR’sand how much closer this new product is to the
original product, as compared to the post-regulation product.
-16%
-14%
-12%
-10%
-8%
-6%
-4%
-2%
0%
$0
$50,000
$100,000
$150,000
$200,000
$250,000
$300,000
$350,000
$400,000
$450,000
A B C D E F
Pre AG-49 Post AG-49 with lower illustrate rate
Post AG-49 With Account Charges Change in Percentage of Post w/ lower rate
Change in Percentage of Post w/ CAV
18
IRR summary A B C D E F
Pre AG-49 IRR 4.71% 5.82% 6.06% 6.38% 5.66% 4.49%
Post AG-49 w/
lower rate
3.62% 4.57% 5.02% 5.08% 4.52% 4.22%
Post AG-49 w/ CAV 4.31% 5.43% 5.77% 6.00% 5.38% 4.27%
TABLE 7
FIGURE 7
Based on the analysis of this data, it would seem that raising the cap with an additional fee should be a viable
option for many companies to minimize the effect of the regulation and make their products marketable
again.
0%
1%
2%
3%
4%
5%
6%
7%
A B C D E F
Post AG-49 with lower illustrate rate
Post AG-49 with Account Charges
Pre IRR
19
Economic Simulation Analysis
In this section, we are going to analyze based on the economic simulation data. Rather than illustration
analysis, economic simulation analysis emphasizes the influence from the real market. Considering the profit
for insurance company, this analysis plays an important role.
Cash Value Comparison
FIGURE 8
This figure compares the effect of new regulation under illustration analysis and economic simulation
analysis. We can conclude a general idea that, for all products, the cash value of the product decrease under
illustration analysis, but they increase under simulation analysis.
The effect of the new cap rate can explain the difference between the two types of analysis. For the
illustration analysis, once you set up the cap rate, the illustrated rate used to calculate cash account value
remains constant. However, in the economic simulation analysis, the annual return of the S&P 500 changes
all the time. This causes the credited rate for the cash account to change. With a dynamic mechanism, the
analysis of products will not be the same as under the still world.
Another interesting observation is showed in the following table.
$-
$100,000
$200,000
$300,000
$400,000
$500,000
$600,000
$700,000
A B C D E F
Illustrate Pre Illustrate Post Simulate Pre Simulate Post
20
Product Illustrate Pre Illustrate Post Simulate Pre Simulate Post
A 5 5 6 6
B 3 3 3 3
C 2 2 2 2
D 1 1 1 1
E 4 4 4 4
F 6 6 5 5
TABLE 8
Although the impact under these analyses are different, the rankings of these products never change under
both measurements. This is really an interesting observation, and it implies that although the cash value
changes under different measurement, the attractiveness of products does not change. Another point we can
make here is that the illustration measurement is very conservative compared to the economic simulation.
IRR Analysis
FIGURE 9
-0.20%
0.00%
0.20%
0.40%
0.60%
0.80%
1.00%
1.20%
1.40%
0% 10% 20% 30% 40% 50% 60% 70% 80% 90% 100%
Change in IRR
A B C D E F G
21
Figure 9 shows the change of internal rate of return between pre- and post- AG-49 under the economic
simulation analysis. The horizon axis is the change of rate at a stated percentile for each product. We can
clearly conclude an increase trend for most of these products. There is only one exception. Product F is more
stable in change compared with other products. This could be attributed to the low illustration rate before
the new regulation. From the perspective of insurance companies, product F is a good product. With a less
volatile change in all percentiles, it is easier to predict and balance the product.
Therefore, from this figure, most of these products have a big change from the past. This may suggest that
redesigning these products is required.
Scenario Analysis
To perform the simulation better, we also did a scenario analysis based on a positive, neutral, and negative
expectation of the S&P 500 return.
 If S&P returns go beyond expectation: up 10%
 If they meet expectation: stay the same
 If they go below expectation: down 10%
FIGURE 10
This figure shows how the unanticipated change in S&P 500 index may impact the internal rateof return.
Basically, the upward and downward volatility of the return will lead to a similar percentage. But the
downward change is slightly greater than that of the upward side.
A B C D E F G
Down 10% 6.11% 8.19% 7.61% 10.03% 7.85% 1.33% 6.48%
Up 10% 7.50% 10.61% 9.93% 13.14% 9.99% 1.64% 8.43%
Original 6.85% 9.55% 8.89% 11.69% 9.05% 1.51% 7.57%
0.00%
2.00%
4.00%
6.00%
8.00%
10.00%
12.00%
14.00%
Down 10% Up 10% Original
22
Summary
Impact of Illustration
Owning to the new regulation, the calculation of the illustrated rate is now require to follow a specific
standard. If insurance companies directly accept the new regulation without adjusting fees and rates, a lower
illustration rateand a lower illustrated cash value of each policy is predictable to be on the market.
Consumers may purchase policies other than IUL products if the cash value in IUL is no longer attractive.
However, for potential consumers who only consider IUL products, this new regulation has an industrial level
influence. This means that the rankings for IUL products do not change significantly when comparing the pre-
and post-regulation products. Therefore, the impact on illustration is limited without considering the
competition from other similar products.
Warnings basedon Economic Simulation
The conclusion drawn from economic simulation analysis shows that, although an increase in the cap rate
could maintain the current illustration rate, it also increases the cash account value. This leads to a higher
internal rateof return for IUL products and may curtail the profits to meet the increasing credits. Also, from
the observation of cash value simulation distribution, the increase in cash value is not even. So it is hard to
calculate the proper reserve under the new situation.
Actuaries also need to consider the expectation of S&P 500 and its influence on the actualcash value.
Although the product is based on the return of index, consumers may mistakenly believe that the illustration
provided by the insurance company will be a good estimate of the future account value. Therefore, a
reminder of positive and especially negative scenarios is necessary.
Reasons companies may resist anewcharge on account
In our redesign approach, we added a charge on account value annually. Usually companies try to resist doing
so in reality. The reasons can be from two perspectives.
On one hand, a sticky charge may be more welcomed by consumers. It is easy to understand that nobody
likes more charges from his/her account. With an account based on the same index, policyholders always
prefer a lower fee.
On the other hand, a new charge on account value is for the extra exposure after increasing the cap rate.
Insurance company prefers to have a more predictable and balanced cash flow rather than a volatile and
uncertain exposure. The new product will make companies more dependent on high returns which, even if
expected, make companies feel like they are exposing themselves to greater risk.
23
From perspectives of both insurance company and policyholder, a new chargeis unrecommendable.
Prediction
Based on all the analyses above, we suggest that companies may redesign the products with some new costs
rather than simply adjust parameters.
 Probable tactics may include: increase monthly cost, increase premium load, and adjust the cost of
insurance while keeping a high cap rate
 Not suggestive tactics: increase participation rate alone, increase cap rateand chargemore
Project Milestones
 Statement of Intent
 Project Charter
 Excel Calculator for:
o Historical Illustrate Rate
o Cap RateConverter
o Economic Simulation Generator
 Analysis on:
o Illustration Perspective
o Economic Simulation Perspective
 Summary and Prediction
References
Actuarial Guideline [YY] The application of the life illustrations model regulation to polices with index-based
interest, adopted by the Life Actuarial (A) Task Force, 4/16/2015
Wink’s Sales & Market Report 1st Quarter, 2015
Summary of Indexed UL Illustrations Model Regulation (Actuarial Guideline YY), Lion Street, 2015

More Related Content

Viewers also liked

Cuestionario avas ovas-red liseth marín
Cuestionario avas ovas-red liseth marínCuestionario avas ovas-red liseth marín
Cuestionario avas ovas-red liseth marín
Liseth Marin
 
My business presentation
My business presentationMy business presentation
My business presentationhanyessam
 
NSL General HdW.update nov09
NSL General HdW.update nov09NSL General HdW.update nov09
NSL General HdW.update nov09Hans De Wit
 
Ntics
NticsNtics
Curso de español básico para extranjeros
Curso de español básico para extranjeros Curso de español básico para extranjeros
Curso de español básico para extranjeros
Liseth Marin
 
Resumen Ministerio de Educación -OVA
Resumen Ministerio de Educación -OVAResumen Ministerio de Educación -OVA
Resumen Ministerio de Educación -OVA
Angélica María García Benavides
 
Future of Music Coalition: The New Power Trio: Brands Bands and Revenue - mid...
Future of Music Coalition: The New Power Trio: Brands Bands and Revenue - mid...Future of Music Coalition: The New Power Trio: Brands Bands and Revenue - mid...
Future of Music Coalition: The New Power Trio: Brands Bands and Revenue - mid...
midem
 
PLANEACIÓN DEL VERBO TO BE EN INGLÉS Y SU RELACIÓN CON LAS PROFESIONES
PLANEACIÓN DEL VERBO TO BE EN INGLÉS Y SU RELACIÓN CON LAS PROFESIONESPLANEACIÓN DEL VERBO TO BE EN INGLÉS Y SU RELACIÓN CON LAS PROFESIONES
PLANEACIÓN DEL VERBO TO BE EN INGLÉS Y SU RELACIÓN CON LAS PROFESIONES
Carolina Cardoso
 
مسودة مشروع قانون المعاملات الالكترونية الليبي
مسودة مشروع قانون المعاملات الالكترونية الليبيمسودة مشروع قانون المعاملات الالكترونية الليبي
مسودة مشروع قانون المعاملات الالكترونية الليبي
الهيئة الوطنية لأمن وسلامة المعلومات
 
Vocabulario básico para niños
Vocabulario básico para niñosVocabulario básico para niños
Vocabulario básico para niños
Angélica María García Benavides
 
Sintesis informativa 15 de marzo 2017
Sintesis informativa 15 de marzo 2017Sintesis informativa 15 de marzo 2017
Sintesis informativa 15 de marzo 2017
megaradioexpress
 
Sintesis informativa 13 de marzo 2017
Sintesis informativa 13 de marzo 2017Sintesis informativa 13 de marzo 2017
Sintesis informativa 13 de marzo 2017
megaradioexpress
 

Viewers also liked (14)

Cuestionario avas ovas-red liseth marín
Cuestionario avas ovas-red liseth marínCuestionario avas ovas-red liseth marín
Cuestionario avas ovas-red liseth marín
 
Nakornratchsrima
NakornratchsrimaNakornratchsrima
Nakornratchsrima
 
Ajit__Resume
Ajit__ResumeAjit__Resume
Ajit__Resume
 
My business presentation
My business presentationMy business presentation
My business presentation
 
NSL General HdW.update nov09
NSL General HdW.update nov09NSL General HdW.update nov09
NSL General HdW.update nov09
 
Ntics
NticsNtics
Ntics
 
Curso de español básico para extranjeros
Curso de español básico para extranjeros Curso de español básico para extranjeros
Curso de español básico para extranjeros
 
Resumen Ministerio de Educación -OVA
Resumen Ministerio de Educación -OVAResumen Ministerio de Educación -OVA
Resumen Ministerio de Educación -OVA
 
Future of Music Coalition: The New Power Trio: Brands Bands and Revenue - mid...
Future of Music Coalition: The New Power Trio: Brands Bands and Revenue - mid...Future of Music Coalition: The New Power Trio: Brands Bands and Revenue - mid...
Future of Music Coalition: The New Power Trio: Brands Bands and Revenue - mid...
 
PLANEACIÓN DEL VERBO TO BE EN INGLÉS Y SU RELACIÓN CON LAS PROFESIONES
PLANEACIÓN DEL VERBO TO BE EN INGLÉS Y SU RELACIÓN CON LAS PROFESIONESPLANEACIÓN DEL VERBO TO BE EN INGLÉS Y SU RELACIÓN CON LAS PROFESIONES
PLANEACIÓN DEL VERBO TO BE EN INGLÉS Y SU RELACIÓN CON LAS PROFESIONES
 
مسودة مشروع قانون المعاملات الالكترونية الليبي
مسودة مشروع قانون المعاملات الالكترونية الليبيمسودة مشروع قانون المعاملات الالكترونية الليبي
مسودة مشروع قانون المعاملات الالكترونية الليبي
 
Vocabulario básico para niños
Vocabulario básico para niñosVocabulario básico para niños
Vocabulario básico para niños
 
Sintesis informativa 15 de marzo 2017
Sintesis informativa 15 de marzo 2017Sintesis informativa 15 de marzo 2017
Sintesis informativa 15 de marzo 2017
 
Sintesis informativa 13 de marzo 2017
Sintesis informativa 13 de marzo 2017Sintesis informativa 13 de marzo 2017
Sintesis informativa 13 de marzo 2017
 

Similar to final written presentation

167846401 max-project
167846401 max-project167846401 max-project
167846401 max-project
homeworkping8
 
Business Consulting Proposal of i.Master
Business Consulting Proposal of  i.MasterBusiness Consulting Proposal of  i.Master
Business Consulting Proposal of i.MasterXuejiao Yang
 
Hub Group Proposal 20110216 Discussion Draft
Hub Group Proposal 20110216 Discussion DraftHub Group Proposal 20110216 Discussion Draft
Hub Group Proposal 20110216 Discussion Draft
Doug Barnert
 
Regulatory Environment: PwC Top Issues
Regulatory Environment: PwC Top Issues  Regulatory Environment: PwC Top Issues
Regulatory Environment: PwC Top Issues
PwC
 
Insur tech
Insur techInsur tech
Insur tech
stavepartners
 
UlIP
UlIPUlIP
Whole life insurance 0699 2016
Whole life insurance 0699 2016Whole life insurance 0699 2016
Whole life insurance 0699 2016
theBurgessGroup
 
Term Paper on Pran Agricultural Marketing Company ltd
Term Paper on  Pran Agricultural Marketing Company ltdTerm Paper on  Pran Agricultural Marketing Company ltd
Term Paper on Pran Agricultural Marketing Company ltd
Muwas Mia
 
Non-Life Insurance in Singapore, Key Trends and Opportunities to 2016
Non-Life Insurance in Singapore, Key Trends and Opportunities to 2016Non-Life Insurance in Singapore, Key Trends and Opportunities to 2016
Non-Life Insurance in Singapore, Key Trends and Opportunities to 2016ReportsnReports
 
Management Theory & Practice.docx
Management Theory & Practice.docxManagement Theory & Practice.docx
Management Theory & Practice.docx
PIYUSHGoyal764030
 
Hybrid Annuities - A Growth Story
Hybrid Annuities - A Growth StoryHybrid Annuities - A Growth Story
Hybrid Annuities - A Growth Story
Guillaume Briere-Giroux
 
M White Paper: NACI IUL Illustration Guideline Debate
M White Paper: NACI IUL Illustration Guideline DebateM White Paper: NACI IUL Illustration Guideline Debate
M White Paper: NACI IUL Illustration Guideline Debate
M Financial Group
 
Corporate digest-magazine-september (1)
Corporate digest-magazine-september (1)Corporate digest-magazine-september (1)
Corporate digest-magazine-september (1)
Abhishek Kanaujia
 
EQUITY RESEACH ON HOTEL AND AUTO-ANCILLARY
EQUITY RESEACH ON HOTEL AND AUTO-ANCILLARYEQUITY RESEACH ON HOTEL AND AUTO-ANCILLARY
EQUITY RESEACH ON HOTEL AND AUTO-ANCILLARYRahul Shelar
 
Comparison - Unilever Vs P&G- International Business and Marketing Stategies
Comparison - Unilever Vs P&G- International Business and Marketing StategiesComparison - Unilever Vs P&G- International Business and Marketing Stategies
Comparison - Unilever Vs P&G- International Business and Marketing StategiesSwapnil Mali
 
Consequential loss policy in relation with fire insurance
Consequential loss policy in relation with fire insuranceConsequential loss policy in relation with fire insurance
Consequential loss policy in relation with fire insurance
ANMOL GULATI
 

Similar to final written presentation (20)

AIA EIUL Presentation
AIA EIUL PresentationAIA EIUL Presentation
AIA EIUL Presentation
 
p10-14 The Future of Insurance SPR2013
p10-14 The Future of Insurance SPR2013p10-14 The Future of Insurance SPR2013
p10-14 The Future of Insurance SPR2013
 
167846401 max-project
167846401 max-project167846401 max-project
167846401 max-project
 
Business Consulting Proposal of i.Master
Business Consulting Proposal of  i.MasterBusiness Consulting Proposal of  i.Master
Business Consulting Proposal of i.Master
 
Hub Group Proposal 20110216 Discussion Draft
Hub Group Proposal 20110216 Discussion DraftHub Group Proposal 20110216 Discussion Draft
Hub Group Proposal 20110216 Discussion Draft
 
Regulatory Environment: PwC Top Issues
Regulatory Environment: PwC Top Issues  Regulatory Environment: PwC Top Issues
Regulatory Environment: PwC Top Issues
 
Insur tech
Insur techInsur tech
Insur tech
 
Pension solutions 2016
Pension solutions 2016Pension solutions 2016
Pension solutions 2016
 
UlIP
UlIPUlIP
UlIP
 
Whole life insurance 0699 2016
Whole life insurance 0699 2016Whole life insurance 0699 2016
Whole life insurance 0699 2016
 
FNR_UK Motor_Layout_20150703_SinglePage
FNR_UK Motor_Layout_20150703_SinglePageFNR_UK Motor_Layout_20150703_SinglePage
FNR_UK Motor_Layout_20150703_SinglePage
 
Term Paper on Pran Agricultural Marketing Company ltd
Term Paper on  Pran Agricultural Marketing Company ltdTerm Paper on  Pran Agricultural Marketing Company ltd
Term Paper on Pran Agricultural Marketing Company ltd
 
Non-Life Insurance in Singapore, Key Trends and Opportunities to 2016
Non-Life Insurance in Singapore, Key Trends and Opportunities to 2016Non-Life Insurance in Singapore, Key Trends and Opportunities to 2016
Non-Life Insurance in Singapore, Key Trends and Opportunities to 2016
 
Management Theory & Practice.docx
Management Theory & Practice.docxManagement Theory & Practice.docx
Management Theory & Practice.docx
 
Hybrid Annuities - A Growth Story
Hybrid Annuities - A Growth StoryHybrid Annuities - A Growth Story
Hybrid Annuities - A Growth Story
 
M White Paper: NACI IUL Illustration Guideline Debate
M White Paper: NACI IUL Illustration Guideline DebateM White Paper: NACI IUL Illustration Guideline Debate
M White Paper: NACI IUL Illustration Guideline Debate
 
Corporate digest-magazine-september (1)
Corporate digest-magazine-september (1)Corporate digest-magazine-september (1)
Corporate digest-magazine-september (1)
 
EQUITY RESEACH ON HOTEL AND AUTO-ANCILLARY
EQUITY RESEACH ON HOTEL AND AUTO-ANCILLARYEQUITY RESEACH ON HOTEL AND AUTO-ANCILLARY
EQUITY RESEACH ON HOTEL AND AUTO-ANCILLARY
 
Comparison - Unilever Vs P&G- International Business and Marketing Stategies
Comparison - Unilever Vs P&G- International Business and Marketing StategiesComparison - Unilever Vs P&G- International Business and Marketing Stategies
Comparison - Unilever Vs P&G- International Business and Marketing Stategies
 
Consequential loss policy in relation with fire insurance
Consequential loss policy in relation with fire insuranceConsequential loss policy in relation with fire insurance
Consequential loss policy in relation with fire insurance
 

final written presentation

  • 1. Integrated Project Impact of AG-49 on IUL Product 2015 Summer GROUP 2 DAVID ZOMBER LIHUA NIE COLUMBIA UNIVERSITY| Actuarial Science Program
  • 2. 2 Table of Contents INTRODUCTION...................................................................................................................................3 BACKGROUND.....................................................................................................................................3 CONCERNS AND OBJECTIVES.....................................................................................................................3 IUL PRODUCT ......................................................................................................................................4 FEATURES ..........................................................................................................................................4 NEW REGULATION AG-49.....................................................................................................................5 FEATURES OF THE NEW REGULATION...........................................................................................................5 ASSUMPTIONS AND TOOLS ..................................................................................................................6 ASSUMPTIONS ....................................................................................................................................6 CAP RATE CALCULATOR ..........................................................................................................................6 ACCOUNT VALUE CALCULATOR..................................................................................................................7 ECONOMIC GENERATOR .........................................................................................................................8 ILLUSTRATION ANALYSIS......................................................................................................................8 CASE I ..............................................................................................................................................8 CASE II ...........................................................................................................................................15 ECONOMIC SIMULATION ANALYSIS.....................................................................................................19 CASH VALUE COMPARISON ...................................................................................................................19 IRR ANALYSIS ...................................................................................................................................20 SCENARIO ANALYSIS............................................................................................................................21 SUMMARY........................................................................................................................................22 IMPACT OF ILLUSTRATION .....................................................................................................................22 WARNINGS BASED ON ECONOMIC SIMULATION............................................................................................22 REASONS COMPANIES MAY RESISTNEW CHANGES .........................................................................................22 PREDICTION .....................................................................................................................................23 PROJECT MILESTONES........................................................................................................................23 REFERENCES .....................................................................................................................................23
  • 3. 3 Introduction Background Over the last ten years, a number of life insurance companies have introduced a new product to the market called Indexed Universal Life. In addition to the features of a typical Universal Life policy, which includes a death benefit as well as a cash account which one can borrow from or use as a retirement savings account, it also contains an indexed account. The indexed account is credited interest based on the performance of a particular index, for example the S&P 500, but has a floor which prevents it from losing money if the index underperforms. The money isn’t actually invested in the market, which keeps the cash value of the account safe; however, the account can still earn significantly higher rates than a typical bond portfolio would get because of its relationship to the particular index. In recent years, this particular form of life insurance, called an IUL, has become increasingly popular, and companies have begun to offer all sorts of IUL products with numerous different features and varying levels of rates. Many companies have their own calculations for what the expected rates should be. In 2014, after several life insurance companies raised concerns that some of the rates being offered were unrealistically high and the products would never meet consumer expectations, it was suggested that some sort of regulation be instituted to protect consumers and provide a more standardized system of calculating the rates. In April 2015, after considerable deliberation, the Life Actuarial Task Force decided upon Regulation AG-49 as the new standard, which must be followed in IUL Illustrations. Concerns and objectives With the adoption of AG-49, our clients’ concern is that it may influence the return of IUL product. For potential consumers, the illustration plays an important role in explaining how this product may perform. With a predictable lower illustrated rate, the cash value of the account at the terminal will definitely go down as well. Although we may expect that companies will redesign their products after this new regulation, we are still not sure how they may change these products. Objectives of our project included:  Understanding the influence of this new regulation on the IUL product  Estimating the influence of this new regulation on IUL product  Predicting the trend of new IUL products after this new regulation
  • 4. 4 IUL Product Features IUL is a variant of the Universal Life product. It has all of the same features as Universal Life such as:  Whole life insurance policy + cash value of investment The IUL product is a combination of two products: a whole life insurance policy and an investment account. By holding a UL product, the policyholder will benefit from the death benefit and an increasing investment account.  Not a real investment –” TaxAdvantage” The IUL product has an investment account, but this account does not directly invest money into equity market. Instead, insurance companies use different financial derivatives to set limits of money they need to pay policyholder. There is no real investment in the market and all involved investment vehicles are bonds and options. That is where the tax advantage feature comes from. Benefitting from the lower tax charge of bonds and deferred tax when no withdrawals occur, cash accumulation value in the investment account would increase faster than in the other account, which is treated as an equity account. Additionally, there are some unique features of IUL. Such as:  Interest credited on specific index Policyholder has options to choose which type of index they would like to set as their target index. The variety of options can satisfy policyholder’s willingness to allocate their investment based on a rational expectation of equity market.  Principal protection IUL products set a floor for its investment account. For every year, aside from the required fee charges for the insurance company, the investment account cannot have a credited interest rate lower than the stated floor rate. Most often, the floor rateis 0%, so the account cannot lose money, but some companies offer products with 1% - 2% as the floor rate. This is actually a principal protection feature for this product.  Flexible choice of premium based on financial capability For each year, policyholders can adjust the premium they would like to pay based on their current financial capability. This helps to meet their financial needs while continuing to support an investment account. Since there is no penalty for uneven payment, flexibility of premium payment is definitely a good feature for policyholders.
  • 5. 5 Owning to all these advantages described here, IUL products have become an ideal choice for many people. However, after this new regulation, some of these good features may become less appealing. New Regulation AG-49 This new regulation was enacted by the LATF in April in response to numerous criticisms of current industry practices. One complaint by members of the industry was that often companies offering what seems to be the same exact product illustrate differing rates. The reason for this is that every company has its own system of calculating the future expectation of the S&P based on its historical performance. This can be very confusing for consumers who are trying to compare products. Another complaint came primarily from companies who offer other life insurance products and not IULs that the rates being illustrated for IULs are too unrealistic and will lead to consumer disappointment that will hurt the entire life insurance industry. After much deliberation, AG-49 was agreed upon as a first step in regulating the IUL product. Features of the newregulation  Only for illustration purposes This regulation does not directly influence the pricing of IUL product. However, it is reasonable to believe that to make it appealing for potential customers, the pricing will be adjusted to meet this new regulation with a better performance in illustration.  Follow a specific methodology to calculate the illustration rate In the appendix, the detailed methodology is explained in the original file from the National Association of Insurance. In all cases, this new regulation asks all insurance companies to follow the same standard rule to calculate their illustration rates. This means, under this new regulation, the cash value of accounts in different products aremore comparable, since it removes the effects of varying illustrated rates and is a better representation of cost and other charges from insurance companies.  A Benchmark Index Account on the S&P 500, has 100% participation rate, 0% floor, and uses an annual point-to-point strategy This is a specific requirement for the definition “Benchmark Index Account”. All products with the Benchmark Index Account must follow the requirements here.  Use the averageof 25-year period backward for 65 years This is the specific year requirement for benchmark index account to calculatethe illustration rate. Considering that the S&P 500 has been used as an index from the beginning of 1950, this rule asks to use
  • 6. 6 the whole life-span record for the new calculation. According to the data, this would generally lead to a decrease in the illustration ratefor all companies given the same cap rate.  A company, which does not offer a Benchmark Index Account, should use actuarialjudgment to determine an appropriate ratefor that account This is the only way for actuaries to manipulate the illustration rate. Except the Benchmark Index Account, which is specifically defined with a method to calculate its illustration rate, other accounts are still allowed to have illustration rates based on actuarial judgment. There is a way to get a better illustration rate through setting up an index account other than the Benchmark Index Account. Assumptions and Tools Assumptions To simplify our project and focus solely on the illustration rate, we set up some assumptions here:  For all products’ calculations, the policyholder’s information is listed here: o Gender: Male o Age: 45 o Health Status: Healthy  Level Premium: $10,000 per year for 20 Years  Standard setting with new regulation: o Index Type: S&P 500 o Credit Method: Annual Point-to-Point  Death benefit o Type: Whole life insurance o Payment type: Annual premiums o Face amount: $500,000 o Mortality rate is provided by mentors  Surrender charge is included using a fixed schedule  Interest rateis set to be 4% for all of our products  No withdrawals from the account in the 20-year period Cap rate calculator The cap rate is the greatest credit rate a policyholder can receive from the indexed account each year. For the insurance company, this cap ratesets the upper limit of the cost to the policyholder. Combined with the floor rate, they work as a collar strategy. The objective of getting a proper cap rateis to lock the profit margin at the beginning of each term. In this way, however the index price changes, the insurance company will be out of exposure based on this change. As mentioned, an insurance company uses option combinations to set up limits for the product. The following chart shows how the option budget works for insurance company.
  • 7. 7 FIGURE 1 The transactions involved in this chart are:  Long a call at Strike price K1, represented with the yellow dot line.  Short a call at Strike price K2, represented with the green cut line. With the combination of these two call options, the actualprofit is locked in as shown by the red curve. Therefore, the insurance company can set up the cap ratewith its own option budget. In our calculator, we first use the data from proxy products to imply the target spread every company sets for its IUL product. Then, based on the target spread, we recalculate a new cap ratewith the same illustrated ratebefore new regulation. With the higher new cap rate, the option budget will increase. The change from the previous option budget to the higher one is the new set of charges to the policyholder on an annual basis. Account value calculator This calculator is used to compute the account value. Basically, the formula used in the account value calculator is: ∑ (𝐴𝑉𝑘−1 + 𝑃 − 𝐿 − 𝐴𝐶 − 𝐶𝑂𝐼 − 𝐶𝐴𝑉)𝑡 𝑘=𝑡−12 12 × (1 + 𝐶𝑅) − 𝑆𝑅 = 𝐴𝑉𝑡 where AV = account value; P = premium; L = load; AC = account monthly cost; Cap Level for our product Long a call at K1 Short a call at K2 Profit Strike
  • 8. 8 COI1 = cost of insurance; CAV = charges based on account value; CR = interest credited rate; SR = surrender charge Economic generator Assumptions:  For the historical method, we assume that history will occur in the future. Therefore, it is representative to choose a historical period to simulate the future.  For the lognormal method, the daily return is a random variable. It follows a normal distribution, where the mean equals the long-term mean of daily return, and the variance equals the square of long-term daily volatility. Here we use the daily returns from 1959 Jan 1st to 2014 Dec 31st.  Number of paths for simulation: 100  To make products comparable, we use the same S&P 500 Index return for all products.  The starting price in our simulation is 2103.84. This is the closing adjusted price of 2015 July 31st. By combining this economic generator and account value calculator together, we are able to calculate the cash value of products in any circumstance provided sufficient parameters. Illustration Analysis From here, we are going to use all these tools and models described above to analyze the IUL product. Since the new regulation is for illustration purposes, we will have a detailed analysis from the illustration perspective. Case I In order to properly analyze the impact that AG-49 will have on the current industry’s products, we took seven of the top-selling IUL products and compared the change in the illustrated ratewhich will result from the regulation as well as the change in cash surrender value (CSV) which is dependent primarily on the crediting rate. It is important to reiterate that this change is only in the illustrated rate. The actual crediting ratethat the policyholder receives is not impacted at all by the regulation only by the true performance of the corresponding index and the parameters of the policy such as the cap rate, participation rate, and the floor. 1 Cost of insurance charges for the death benefit. The calculation based on the use of an internal mortality table.
  • 9. 9 The products used in our analysis are modeled after realindustry products with each one being a Benchmark Index Account as defined by the regulation having a cap, a 0% floor, 100% participation rate, an annual point- to-point crediting strategy, and using the S&P alone as the index. However, the caps of these products do vary, and each one has its own unique combination of fees and a different illustrated ratethat it offers its customers. It would seem reasonable that measuring the impact on these products would be fairly representative of the impact on the industry as a whole. Here is a list of the seven products used in our analysis: Product Cap Current Illustrated Rate Monthly Fee Premium Load A 10% 7% 7.50 5.95% B 12% 8% 7.50 5.9% C 13% 8.2% 5.00 6% D 13% 8.44% 5.00 5.5% E 12% 7.90% 10.00 6% F 11% 6.69% 7.50 5% G 13% 8.08% 20.00 10% in year 1, 6% in years 2+ TABLE 1 To measure the affect that the regulation has on the CSV, we first had to calculate what the new illustrated ratewill be for these products once the regulation takes effect. Using the parameters of the Benchmark Index Account, the new illustrated ratewas calculated with the 25 year averages of the 65 years of the S&P as required by the regulation with the only variable being the cap rate. We also measured the percentage decrease in the illustrated rate. As is evident from the chart below, generally, the higher the rate, the greater the decrease.
  • 10. 10 FIGURE 2 We then applied the new rate to the AV calculator given to us by one of our clients, which was described above and is what companies use to calculate the CSV based on a number of parameters. Several of the parameters we kept constant for all of our products such as the amount of the death benefit for which we used $500,000 and an assumed interest rateof 4% used to calculate the whole life insurance death benefit. In our original analysis, we also assumed that we are dealing with a healthy male age45 paying $10,000 per year into the account for 20 years until he retires, but we tested other scenarios as well as will be shown below. Figure 3 shows the comparison of the original products’ CSV with what the new CSV would be under the regulation: 7.00% 8.00% 8.20% 8.44% 7.90% 6.69% 8.08% 6.01% 6.87% 7.25% 7.25% 6.87% 6.45% 7.25% 0.99% 1.13% 0.95% 1.19% 1.03% 0.24% 0.83% 0.00% 1.00% 2.00% 3.00% 4.00% 5.00% 6.00% 7.00% 8.00% 9.00% 1 2 3 4 5 6 7 Maximum Illustrated Rate Current Rates New Regulation Rates Impact of AG-49
  • 11. 11 FIGURE 3 One interesting note which comes out from this chart is the change in the rankings of these products which is shown in the following table. Product Pre AG 49 Post AG 49 Changes A 6 7 - B 3 4 - C 2 2 D 1 1 E 4 5 - F 7 6 + G 5 3 + TABLE 2 Products C and D, which were ranked the highest because of a high cap rate that resulted in a higher illustrated rateand a higher CSV, are still ranked the highest. However, Product F jumped ahead of Product A, 10.97% 12.56% 10.71% 13.25% 11.51% 2.78% 9.40% 0.00% 2.00% 4.00% 6.00% 8.00% 10.00% 12.00% 14.00% 0 50,000 100,000 150,000 200,000 250,000 300,000 350,000 400,000 450,000 1 2 3 4 5 6 7 Cash accumulation for 45 year-old with $10,000 premium Pre AG-49 Post AG-49 Impact of AG-49 in Amount Impact of AG-49 in Percentage
  • 12. 12 because whereas prior to the regulation Product A seems to be a much better deal than Product F offering a higher illustration rate despite the lower cap; after the regulation Product A with its lower cap than Product F will be forced to illustrate at a lower rate. This is one of the purposes of the regulation, to act as an “equalizer” not allowing companies to illustrate what might be considered unreasonably high rates relative to the cap. Product G also jumped up because its ratewas also low in comparison to other products even though it had a high cap. From the rankings we see that while all products in the IUL industry arebeing affected by the regulation to an extent, within the industry the products that seem to be the “best deals” are being impacted the most. We then tested different premiums amounts to see if the impact is equal across all levels. While the differences are indeed very slight, it is interesting to note that the greatest difference in all the products is at $10,000, with $5,000 and $20,000 being virtually the same. Product Premium $5,000 $10,000 $20,000 A -10.85% -10.97% -10.86% B -12.45% -12.56% -12.44% C -10.61% -10.71% -10.60% D -13.13% -13.25% -13.12% E -11.40% -11.51% -11.40% F -2.75% -2.78% -2.75% G -9.32% -9.40% -9.31% TABLE 3
  • 13. 13 We also compared different ages to see the impact across agegroups: Product Age 45 50 A -10.97% -8.14% B -12.56% -9.31% C -10.71% -7.91% D -13.25% -9.81% E -11.51% -8.52% F -2.78% -2.04% G -9.40% -6.92% TABLE 4 Clearly, an older policyholder will not be affected nearly as much as a younger one because the more time the account has to accumulate the greater the impact of the lower rate. The next step of our analysis was to see whether other factors such as the monthly fees and the premium load which also affect the CSV can be decreased as a way to minimize the impact of the regulation. In other words, can a company counter the effect of a lower illustrated rateby decreasing the fees thereby increasing the CSV? Obviously, companies probably won’t want to do this because it would decrease their profit margin in these products. Nonetheless, it is evident from the next table that even if a company chose to do this, it would not help very much.
  • 14. 14 Product With regular premium loadandfees With 5% loadandnofees A -10.97% -8.80% B -12.56% -10.50% C -10.71% -8.83% D -13.25% -12.01% E -11.51% -8.94% F -2.78% -1.66% G -9.40% -4.82% TABLE 5 Even after removing the fees, and lowering the load to 5%, which is the lowest found in the industry, the effect of the regulation is still pretty significant for most of these products. Only for product G, which charges much higher fees than the other products. do we see a decrease of almost 50% in the impact of the regulation by lowering the fees. For most products, the fees do not have a great impact on the CSV relative to the crediting rate, and this is shown in the following chart.
  • 15. 15 FIGURE 4 From the chart, it is clear that the additional fee, represented by the gray bar, has a very small impact on the CSV. The 5% load has a larger impact, but still not quite as much as even a 1% change in the rate. There is no question that the crediting rate is the most important factor in the CSV, so the only way to counter the effect of the regulation is to find a way that companies can increase the illustrated rate. Case II Until now, we have only been discussing the impact that the regulation will have on the existing products in the market; however, it is likely that companies will try to adjust their products in order to improve their illustrations. One possibility would be to raise the cap of the products to a level which would enable them to illustrate the same rates as before even according to the regulation. The regulation does not limit the amount of the cap; it only creates a methodology which a company must follow to calculate its illustrated rategiven whatever cap the company is using. The amount that a company must raise its cap to achieve a certain rate can be calculated using the methodology of the regulation as to how to measure the history of the S&P. The next step is to use the cap calculator mentioned above to figure out how much a company needs to increase its option budget in order to actually implement this strategy. We can then add an additional annual asset based fee to the policy to cover this cost. Doing so for each of the products listed above and then calculating the CSV, what we get is as follows: $0 $100,000 $200,000 $300,000 $400,000 $500,000 $600,000 6% 7% 8% 9% 10% 0% load, 0 fees 5% load, 0 fees 5% load, $7.50 fee
  • 16. 16 Product Pre AG-49 Cap Maximum Illustrated Rate Pre AG-49 CSV Post AG- 49 Cap Post AG-49 CSV % Decrease A 10% 7.00% $336,977.15 12.35% $322,682.11 4.24% B 12% 8.00% $379,778.60 15.20% $364,261.02 4.09% C 13% 8.20% $389,974.80 15.85% $378,898.02 2.84% D 13% 8.44% $404,060.38 16.68% $390,981.65 3.24% E 12% 7.90% $373,306.47 14.89% $360,414.29 3.45% F 11% 6.69% $329,015.33 11.57% $325,281.54 1.13% G 13% 8.08% $373,528.76 15.46% $363,903.72 2.58% TABLE 6 FIGURE 5 The first four columns of Table 6 show the original products with their caps, illustrated rates, and CSV’s. The fifth column shows the new cap which will be required to uphold the same illustrated rateas before once the regulation takes effect. The sixth column is the new CSV which is lower than the original because of the 0.00% 0.50% 1.00% 1.50% 2.00% 2.50% 3.00% 3.50% 4.00% 4.50% 0 50,000 100,000 150,000 200,000 250,000 300,000 350,000 400,000 450,000 A B C D E F G Pre AG-49 CSV Post AG-49 CSV % Decrease
  • 17. 17 additional fee which must be added to the account. In the last column we see the percentagedecrease in the new product as compared to the old product. If we compare this decrease to the percentagedecrease that the regulation creates if we don’t adjust the product, we see that this decrease is significantly less severe. The explanation would seem to be based on what was shown above that additional fees generally do not impact the overall value of the account as much as the change in rate does. Therefore, retaining the original rate, but adding on a fee to cover the cost of the higher cap should be a reasonable option to keep the product comparable to what it was before according to this analysis. The following chart shows clearly how much closer the new product is to the pre-regulation product as compared to the post-regulation product. FIGURE 6 Another way to measure the advantage of this approach is by looking at the IRR of the different products in each scenario. The following charts show the various IRR’sand how much closer this new product is to the original product, as compared to the post-regulation product. -16% -14% -12% -10% -8% -6% -4% -2% 0% $0 $50,000 $100,000 $150,000 $200,000 $250,000 $300,000 $350,000 $400,000 $450,000 A B C D E F Pre AG-49 Post AG-49 with lower illustrate rate Post AG-49 With Account Charges Change in Percentage of Post w/ lower rate Change in Percentage of Post w/ CAV
  • 18. 18 IRR summary A B C D E F Pre AG-49 IRR 4.71% 5.82% 6.06% 6.38% 5.66% 4.49% Post AG-49 w/ lower rate 3.62% 4.57% 5.02% 5.08% 4.52% 4.22% Post AG-49 w/ CAV 4.31% 5.43% 5.77% 6.00% 5.38% 4.27% TABLE 7 FIGURE 7 Based on the analysis of this data, it would seem that raising the cap with an additional fee should be a viable option for many companies to minimize the effect of the regulation and make their products marketable again. 0% 1% 2% 3% 4% 5% 6% 7% A B C D E F Post AG-49 with lower illustrate rate Post AG-49 with Account Charges Pre IRR
  • 19. 19 Economic Simulation Analysis In this section, we are going to analyze based on the economic simulation data. Rather than illustration analysis, economic simulation analysis emphasizes the influence from the real market. Considering the profit for insurance company, this analysis plays an important role. Cash Value Comparison FIGURE 8 This figure compares the effect of new regulation under illustration analysis and economic simulation analysis. We can conclude a general idea that, for all products, the cash value of the product decrease under illustration analysis, but they increase under simulation analysis. The effect of the new cap rate can explain the difference between the two types of analysis. For the illustration analysis, once you set up the cap rate, the illustrated rate used to calculate cash account value remains constant. However, in the economic simulation analysis, the annual return of the S&P 500 changes all the time. This causes the credited rate for the cash account to change. With a dynamic mechanism, the analysis of products will not be the same as under the still world. Another interesting observation is showed in the following table. $- $100,000 $200,000 $300,000 $400,000 $500,000 $600,000 $700,000 A B C D E F Illustrate Pre Illustrate Post Simulate Pre Simulate Post
  • 20. 20 Product Illustrate Pre Illustrate Post Simulate Pre Simulate Post A 5 5 6 6 B 3 3 3 3 C 2 2 2 2 D 1 1 1 1 E 4 4 4 4 F 6 6 5 5 TABLE 8 Although the impact under these analyses are different, the rankings of these products never change under both measurements. This is really an interesting observation, and it implies that although the cash value changes under different measurement, the attractiveness of products does not change. Another point we can make here is that the illustration measurement is very conservative compared to the economic simulation. IRR Analysis FIGURE 9 -0.20% 0.00% 0.20% 0.40% 0.60% 0.80% 1.00% 1.20% 1.40% 0% 10% 20% 30% 40% 50% 60% 70% 80% 90% 100% Change in IRR A B C D E F G
  • 21. 21 Figure 9 shows the change of internal rate of return between pre- and post- AG-49 under the economic simulation analysis. The horizon axis is the change of rate at a stated percentile for each product. We can clearly conclude an increase trend for most of these products. There is only one exception. Product F is more stable in change compared with other products. This could be attributed to the low illustration rate before the new regulation. From the perspective of insurance companies, product F is a good product. With a less volatile change in all percentiles, it is easier to predict and balance the product. Therefore, from this figure, most of these products have a big change from the past. This may suggest that redesigning these products is required. Scenario Analysis To perform the simulation better, we also did a scenario analysis based on a positive, neutral, and negative expectation of the S&P 500 return.  If S&P returns go beyond expectation: up 10%  If they meet expectation: stay the same  If they go below expectation: down 10% FIGURE 10 This figure shows how the unanticipated change in S&P 500 index may impact the internal rateof return. Basically, the upward and downward volatility of the return will lead to a similar percentage. But the downward change is slightly greater than that of the upward side. A B C D E F G Down 10% 6.11% 8.19% 7.61% 10.03% 7.85% 1.33% 6.48% Up 10% 7.50% 10.61% 9.93% 13.14% 9.99% 1.64% 8.43% Original 6.85% 9.55% 8.89% 11.69% 9.05% 1.51% 7.57% 0.00% 2.00% 4.00% 6.00% 8.00% 10.00% 12.00% 14.00% Down 10% Up 10% Original
  • 22. 22 Summary Impact of Illustration Owning to the new regulation, the calculation of the illustrated rate is now require to follow a specific standard. If insurance companies directly accept the new regulation without adjusting fees and rates, a lower illustration rateand a lower illustrated cash value of each policy is predictable to be on the market. Consumers may purchase policies other than IUL products if the cash value in IUL is no longer attractive. However, for potential consumers who only consider IUL products, this new regulation has an industrial level influence. This means that the rankings for IUL products do not change significantly when comparing the pre- and post-regulation products. Therefore, the impact on illustration is limited without considering the competition from other similar products. Warnings basedon Economic Simulation The conclusion drawn from economic simulation analysis shows that, although an increase in the cap rate could maintain the current illustration rate, it also increases the cash account value. This leads to a higher internal rateof return for IUL products and may curtail the profits to meet the increasing credits. Also, from the observation of cash value simulation distribution, the increase in cash value is not even. So it is hard to calculate the proper reserve under the new situation. Actuaries also need to consider the expectation of S&P 500 and its influence on the actualcash value. Although the product is based on the return of index, consumers may mistakenly believe that the illustration provided by the insurance company will be a good estimate of the future account value. Therefore, a reminder of positive and especially negative scenarios is necessary. Reasons companies may resist anewcharge on account In our redesign approach, we added a charge on account value annually. Usually companies try to resist doing so in reality. The reasons can be from two perspectives. On one hand, a sticky charge may be more welcomed by consumers. It is easy to understand that nobody likes more charges from his/her account. With an account based on the same index, policyholders always prefer a lower fee. On the other hand, a new charge on account value is for the extra exposure after increasing the cap rate. Insurance company prefers to have a more predictable and balanced cash flow rather than a volatile and uncertain exposure. The new product will make companies more dependent on high returns which, even if expected, make companies feel like they are exposing themselves to greater risk.
  • 23. 23 From perspectives of both insurance company and policyholder, a new chargeis unrecommendable. Prediction Based on all the analyses above, we suggest that companies may redesign the products with some new costs rather than simply adjust parameters.  Probable tactics may include: increase monthly cost, increase premium load, and adjust the cost of insurance while keeping a high cap rate  Not suggestive tactics: increase participation rate alone, increase cap rateand chargemore Project Milestones  Statement of Intent  Project Charter  Excel Calculator for: o Historical Illustrate Rate o Cap RateConverter o Economic Simulation Generator  Analysis on: o Illustration Perspective o Economic Simulation Perspective  Summary and Prediction References Actuarial Guideline [YY] The application of the life illustrations model regulation to polices with index-based interest, adopted by the Life Actuarial (A) Task Force, 4/16/2015 Wink’s Sales & Market Report 1st Quarter, 2015 Summary of Indexed UL Illustrations Model Regulation (Actuarial Guideline YY), Lion Street, 2015