SlideShare a Scribd company logo
1 of 148
Page | 1
PROJECT REPORT
Generation Gap at workplace; a case study of
Allied Bank
SUBMITTED TO:
PROF. Dr Ali Askari
Course Supervisor
SUBMITTED BY:
AMUN ARIF (03)
SABA SHAUKAT (44)
MARIJ ZAFAR (57)
COURSE: PROJECT REPORT
CLASS: BBA (8TH SEMESTER)
KARACHI UNIVERSITY BUSINESS SCHOOL
UNIVERSITY OF KARACHI
DATE OF SUBMISSION: 16th November 2015
Page | 2
ACKNOWLEDGEMENT
We owe many thanks to a great many people who helped and supported us during
the completion of this project. My deepest thanks to our Course Incharge,
Professor Dr. Ali Askari, for giving us an opportunity to do such work and then for
guiding and correcting the various documents of the report with attention and care.
He has given his precious time to go through the project and make necessary
correction as and when needed.
We express our thanks to Karachi University Business School, University of
Karachi for extending its support for granting us permissions and letters for the
report.
Also, we would like to thank all those links and contacts who helped us gathering
up the data and making it an ease for us in completing this research project.
Page | 3
EXECUTIVE SUMMARY
The main aim of this research is to find out if generation gap exists at workplaces; to
determine different characteristics which are found in the generations: the veterans, the
baby boomers, the generation X, and the generation Y; and to compare different
motivational factors related to work which are required by the employees who belong to
these four age groups, respectively. This research was conducted on a quantitative basis,
questionnaire based survey method was used to gather responses from 75 employees who
belonged to Allied Bank. The results are analyzed by making pie charts. The findings
revealed that generation gap exists at workplaces. In the Generation Y group, the highest
rated characteristics are: inflexible, demand personal growth, competitive, like
challenges and easily accept new ideas. In the Generation X group, the highest rated
characteristics are: demand family and work life balance, loyalty to work place,
respectful, self-reliant and highly committed to work. In the Baby Boomers, the
characteristics with the highest ratings are: demand family and work life balance, loyalty
to workplace, respectful, hardworking and highly committed to work. In the motivational
factors that are required by the employees, training and retirement plan were the most
highly rated ones; training was highly rated for the Generation X group while retirement
plan was highly rated for the Baby Boomers.
Page | 4
TABLE OF CONTENT
S.no TOPIC Pg.no
II Acknowledgement………………………………………………………………………………………………………II
III Executive summary……………………………………………………………………………………………………..III
CHAPTER 1: INTRODUCTION………………………………………………………………………………………..………………1
1.1 Background………………………………………………………………………………………………………………..2
1.2 ProblemStatement………………………………………………………….………………………………………..3
1.3ResearchObjectives……………………………………………………………………………………………………4
1.4 ResearchQuestions……………………………………………………………………………………………………4
1.5 Purpose of the Study………………………………………………………………………………………………….4
1.6 Definitions ………………………………………………………………………………………………………………5
1.7 Structure of the thesis………………………………………………………………………………………………7
1.8 ChapterReferences………………………………………………………………………………………………….8
CHAPTER 2: LITERATURE REVIEW……………………………………….……………………………………………………..9
2.1 Four generationsof Employees……………………………………….…………………………………......10
2.1.1 The Traditional generation……………………………………………………………….10
2.1.2 The Baby Boomgeneration………………………………………………………………11
2.1.3 GenerationX…………………………………………………………………………………….13
2.1.4 GenerationY…………………………………………………………………………………….14
2.2 Possible Generational DifferencesAndSimilarities…………………………………….15
2.2.1 Attitudestowardswork…………………………………………..……………………….15
2.2.2 Loyaltytowardsthe employer……………………………………………………………………….17
Page | 5
2.2.3 Attitudesregardingrespectandauthority…………………………………………………….20
2.2.4 Desire fora betterwork/life balance……………………………………………………………21
2.2.5 Attitudestowardssupervision……………………………………………………………………..22
2.2.6 Othersourcesof differences………………………………………………………………………..22
2.3 LeadershipStyles…………………………………………………………………………………………………..23
2.4 DifferencesBetweenGenerations………………………………….…………................26
2.5 MotivationAndTrainingOf Generations………………………….………………………27
CHAPTER 3: RESEARCH METHODOLOGY……………………………………………………………………………….28
3.1 ResearchApproach……………….........…………………………………………………………………..29
3.2 ResearchPurpose……………………………………………………………………………………………….30
3.3 Research Design……………………………………………………………………………………………………30
3.4 ResearchMethodology…………………………………………………………………………………………30
3.5 Sample Size andTargetPopulation……………………………………………………………………….31
3.6 SamplingTechnique……………………………………………………………………………………………..31
3.7 Data Source…………………..………………………………………………………………………………………32
3.8 SamplingUnit..………………………………………………………………………………………………………32
3.9 Data CollectionMethod…………………………………………………………………………………………32
3.10 InstrumentforData Collection…………………………………………………………………………….33
3.11 Statistical Technique/Tool…………………….…………………………………………………………….33
3.12 Hypothesis………………………………………………………………………………………………………….33
3.13 Ethical Considerations…………………………………………………………………………………………33
3.14 Reliability…………………………………………………………………………………………………………….34
3.15 Validity…………………………………………………………………………………………………………………35
3.16 Limitations……………………………………………………………………………………………………………36
Page | 6
3.17 Timescale……………………………………………………………………………………………………………..37
3.18 ChapterReferences……………………………………………………………………………………………..38
CHAPTER 4: MARKET RESEARCH AND ANALYSIS……………………………………………………………………..39
4.1 SWOT Analysis……………………………………………………………………………………………………….40
4.1.1 Strengths……………………………………………………………………………………………40
4.1.2 Weaknesses……………………………………………………………………………………….41
4.1.3 Opportunities…………………………………………………………………………………….42
4.1.4 Threats………………………………………………………………………………………………42
4.2 PEST Analysis………………………………………………………………………………………………………..43
4.2.1 Political……………………………………………………………………………………………..43
4.2.2 Economical………………………………………………………………………………………..44
4.2.3 Social…………………………………………………………………………………………………44
4.2.4 Technology……………………………………………………………………………………….44
4.3 Comparative Analysisof ABLandMCB………………………………………………………………….45
4.4 Conclusion……………………………………………………………………………………………………………50
4.5 Analysisof the Research……………………………………………………………………………………….54
4.6 ChapterReferences……………………………………………………………………………………………..72
CHAPTER 5: FINANCIALANALYSIS………………………………………………………………………………………….75
5.1 UnconsolidatedStatementof Financial Position…………………………………………………..76
5.2 UnconsolidatedProfitandLossAccount………………………………………………………………78
5.3 UnconsolidatedStatementof CashFlow………………………………………………………………79
5.4 Income Statement………………………………………………………………………………………………..81
5.5 Balance Sheet……………………………………………………………………………………………………….81
5.6 RatiosAnalysis……………………………………………………………………………………………………..81
Page | 7
5.7 Interpretation………………………………………………………………………………………………………82
5.8 ProjectCostEstimation…………………………………………………………………………………………82
5.9 Chapterreferences……………………………………………………………………………………………….83
CHAPTER 6: ORGANIZATIONAND MANAGEMENT…………………………………………………………..…….84
6.1 CompanyInformation…………………………………………………………………………………………..85
6.2 Profile of Directors………………………………………………………………………………………………..86
6.3 Organogram………………………………………………………………………………………………………….90
6.4 Branch Structure…………………………………………………………………………………………………..92
6.5 Corporate whistle blowingstrategy………………………………………………………………………93
6.6 ChapterReferences………………………………………………………………………………………………102
CHAPTER 7: CONCLUSION………………………………………………………………………………………………………103
7.1 Deductions……………………………………………………………………………………………………………104
7.2 Myths AboutOlderWorkers…………………………………………………………………………………107
7.3 Bestpracticesfor leadingandmanagingintergenerational workforce…………………108
7.4 ChapterReferences………………………………………………………………………………………………111
CHAPTER 8: RECOMMENDATIONS…………………………………………………………………………………..……..112
8.1 How to Bridge GenerationalDifferencesatworkplace………………………………………….113
8.2 RecommendationsforHumanResource Managers………………………………………………114
8.3 Recommendationsforfuture study………………………………………………………………………115
CHAPTER 9: REFERENCES…………………………………………………………………………………………………………116
CHAPTER 10: BIBLIOGRAPHY…………………………………………………………………………………………………126
APPENDIX- QUESTIONNAIRE…………………………………………..………………….………………………………….137
Page | 8
CHAPTER 1
INTRODUCTION
Page | 9
CHAPTER 1: INTRODUCTION
1.1 BACKGROUND:
Allied Bank is a commercial bank in Pakistan. Allied Bank, with its registered Offices in
Karachi and Lahore, is one of the largest banks within the country with over 1000 branches,
connected to an online network. It was the first Muslim bank established in Pakistan before
independence (1942) with the name of Australasia Bank. It was named as Allied Bank of
Pakistan from Australasia Bank Limited in 1974, and Sarhad Bank Ltd, Lahore Commercial
Bank Ltd and Pak Bank Ltd were also merged in it.
Generation Gaps in the Workplace
There are four distinct generations in the workplace, each with its own worldview and its own
work ethic. Some are fiercely loyal to the company, while others just want a steady paycheck.
Here is a quick breakdown of each generation's attitude toward work, management style and
preferred methods of communication:
• Veterans (born 1922-1945) When it comes to work, the company comes first. The
veteran believes in starting from the bottom, paying dues, and working your way up through
experience and seniority. The best education is on-the-job training. The veteran's management
style is firm and direct, and he or she prefers face-to-face or phone communication.
• Baby Boomers (born 1946-1964) Baby boomers have a strong work ethic, though they
may not be loyal to one company. They believe strongly in education. When it comes to
management, boomers are all about meetings; employees should feel part of a team and consider
annual progress reports a great source of feedback. Boomers are available on phone 24/7. They
Page | 10
always check and leave voicemail messages, check e-mail a couple times a day and always
respond by the end of the day (it's only polite).
• Generation X (born 1965-1980) Education and creativity count for something with
Generation X; you shouldn't have to start from the bottom even if you have fresh ideas.
Generation Xers have never understood why they should care about company "traditions." They
work hard for the company, but wouldn't hesitate to switch jobs if a better offer comes along.
Work-life balance is important to them. Generation Xers believe that people will produce the
best results if they're given the freedom to be creative. They like explaining the reasoning behind
their decisions; this motivates employees in a way that they can understand. When it comes to
communication, e-mail is the king.
• Generation Y (born 1981-2000) Generation Y members believe they have some great
ideas (at least that's what they've been told), so they just want to do their thing and the results
will follow. They like their work places just fine -- until they get bored. Working from home is
as good as the office as long as work gets done. Management is a snap -- everyone simply checks
in with the online project management tool and updates his or her status. Texting is best if you
want to get in touch with a Generation Y member. These people may never check voicemails --
in fact, they're perfectly OK with never meeting a colleague in person.
1.2 PROBLEM STATEMENT:
A generation gap in the workplace can make workers both young and old feel inferior, as well as
hamper productivity and teamwork. Differences between generations can be seen in work ethics,
habits and communication styles. Younger workers might fear not being taken seriously by their
older colleagues, while older workers might fear that their experience is not valued but replaced
by workers with knowledge of more current technology. However, members of each generation
Page | 11
can close the gap between them if they're willing to meet one another halfway. There is a
generation gap between all the generations that impacts today’s work environment. The impact is
a negative one because it decreases the efficiency of the work environment. To solve the
problems of inefficiency within the generation gap, leaders in the workplace must understand the
differences between all the generations and know how to deal with them.
1.3 RESEARCH OBJECTIVES
1. To identify whether generation gap exist in the workplace or not
2. To compare the characteristics of different age group.
3. To identify the areas of conflicts among different age groups
1.4 RESEARCH QUESTIONS
1) Does generation gap exist in the workplace or not?
2) What are the characteristics of different age groups?
3) Compare the characteristics of all the age groups
4) What are the issues that arise between generations?
1.5 PURPOSE OF THE STUDY
This research is conducted to identify different characteristics and motivational factors of young,
middle and, old generations at workplace and to find out the reasons of conflict among three
generations.
1.6 DEFINITIONS
Generation Gap
Page | 12
The difference in attitudes and beliefs among the two generations. (English Language Dictionary
of American Heritage)
o The years separating the preceding generation from the following generation especially
when characterized by different attitudes and perceptions. (Collin‟s Dictionary).
o Generations representing differences in viewpoints, expectations and habits because of
diverse and distinct life experiences. (X and Y: THE IMPACT OF THE GAP)
Veterans
Veterans are considered among the most loyal workers. They are highly dedicated and the most
risk averse. Their values were shaped by the Great Depression, World War II, and the postwar
boom years. Veterans possess a strong commitment to teamwork and collaboration and have
high regard for developing interpersonal communications skills. Veterans now consist of the
most affluent elderly population in history due to their willingness to conserve and save after
recovering from the financial impact of the postwar era.
Baby Boomers
Boomers are the first generation to actively declare a higher priority for work over personal life.
They generally mistrust authority and large systems. Their values were shaped primarily by a
rise in civil rights activism, Viet Nam, and inflation. They are more optimistic and open to
change than the prior generation, but they are also responsible for the “Me Generation,” with its
pursuit of personal satisfaction, which often shows up as a sense of entitlement in today’s work
force.
Page | 13
Because of the fall of the dot.com marketplace, retirement savings of Baby Boomers were
destroyed and many now find themselves having to work longer than they had planned.
Generation Xers
Generation Xers are often considered the “time-wasting” generation. They naturally
question authority about the figures and are responsible for creating the work/life balance
concept. Born in a time of declining population growth, this generation of workers possesses
strong technical skills and is more independent than the prior generations.
Because Gen Xers place a lower priority on work, many company leaders from the Baby
Boomer generation assume these workers are not as dedicated; however, Gen Xers are willing to
develop their skill sets and take on challenges and are perceived as very adaptive to job
instability in the post-downsizing environment.
Millennials or Generation Ys
This group is the first global-centric generation, because of the rapid growth of the
Internet and an increase in global terrorism in their era. They are among the toughest individuals
in directing change.
Generational dissonance
Negative attitude, beliefs and feelings about people not belonging from same generation
based merely on generational difference. (X and Y: THE IMPACT OF THE GAP)
Organizational setting
Page | 14
It is the organizational environment in which the employees work. (X and Y: THE IMPACT OF
THE GAP)
1.7 STRUCTURE OF THE THESIS:
This project report is divided into ten chapters and an appendix section. The first chapter
provides an introduction to the topic chosen, the significance of the study, its aims & objectives
and the purpose for the study. It also includes the definitions of the variables. Chapter two
presents a comprehensive review of the various literatures. The third chapter deals with the
methodologies used dealing with the analysis of the data presented, the validation strategies, the
ethical issues and time needed to complete this research. Chapter four presents the analysis
regarding the essence of the study, the topic chosen, the literatures provided and the importance
of the study. Chapter five consists of the financial analysis of Allied Bnak and the cost incurred
in completing this project. Chapter 6 describes the organizational structure of Allied Bank and its
management. Chapter seven concludes the research by highlighting the results that have been
found out through analysis. Chapter 8 presents the recommendations that will help in future
research on this topic. Chapter nine and ten includes the references and bibliography. There is an
appendix section that contains the questionnaire.
Page | 15
1.8 CHAPTER REFERENCES
BACKGROUND:
 https://www.abl.com/ (information of Allied Bank)
 Raines, C. (2003). Connecting generations - The sourcebook for a new workplace.Menlo
Park,CA: Crisp Publications. (Introduction of generations)
 ASAE: Uncommon Threads: Mending the Generation Gap at Work (Four generations)
DEFINITIONS:
 Jennings, L. (2000, Mar/April). Trends in the Multigenerational Workplace. Futurist,
34(2), 60-61
Page | 16
CHAPTER 2
REVIEW OF
LITERATURE
Page | 17
REVIEW OF LITERATURE
AUTHOR: Zemke, R., Raines, C., & Filipczak, B. (1999).
TITLE: Generations at work: Managing the clash of veterans, boomers, Xers, and nexters in
your workplace. New York: AMACOM.
A generation being defined as an identifiable group that shares birth years, age, location,
and significant life events at critical developmental stages, divided by five to seven years into:
the first wave, core group, and last wave. There are at least two views regarding generational
differences in the workplace. The first presumes that shared events influence and defines each
generation while individuals in different generations are diverse; they nevertheless share certain
thoughts, values, and behaviors because of the shared events. Furthermore, these values,
reactions, and behaviors presumably differ across generations.
The alternative view assumes that although there might be variations throughout an
employee’s life cycle or career stage, ultimately employees may be “generic” in what they want
from their job and bifurcation of employees by generations may be misguided.
In this report, the four generations of workers are described, generational differences and
similarities are identified, and implications for employers are discussed.
2.1 FOUR GENERATIONS OF EMPLOYEES
AUTHOR: Niemiec, S. (2000)
TITLE: Finding common ground for all ages. Security Distributing and Marketing, pg. 30.
2.1.1 The Traditional generation
The Traditional generation is the oldest generation in the workplace, although most are
now retired. Also known as the veterans, the Silents, the Silent generation, the matures, the
Page | 18
greatest generation. This generation includes individuals born before 1945, and some sources
place the earliest birth year to 1922. Members of this generation were influenced by the great
depression and World War II among other events and have been described as being conservative
and disciplined, as having a sense of obligation, and as observing economic limitation.
The National Oceanographic and Atmospheric Association Office of Diversity (2006)
characterized members of this generation as the private, silent generation, who believe in paying
their dues, for whom their
word is their bond, who prefer formality, have a great deal of respect for authority, like social
order and who love their things and tend to hoard stuff. Members of this generation have also
been characterized as loyal workers, highly dedicated, averse to risk and strongly committed
toward teamwork and collaboration. They have also been described as having a high regard for
developing communication skills, and as the most affluent elderly population in the U.S., due to
their tendency to save and conserve. At work, they are presumed to show consistency and
uniformity, seek out technological advancements, be past-oriented, display command-and-
control leadership, and prefer hierarchical organizational structures. They are likely to continue
to view horizontal structures in a hierarchical way. They are also likely to be stable, detail
oriented, thorough, loyal, and hardworking, although they may be not skilled with ambiguity and
change management, reluctant to blame the system, uncomfortable with conflict, and controlled
when they disagree.
2.1.2 The Baby Boom generation
AUTHOR: O’Bannon, G. (2001).
Page | 19
TITLE: Managing our future: The generation X factor. Public Personnel Management, pg. 30,
pg. 95–109
Most sources identify Baby Boomers as people born between 1943 and 1965. This
generation is referred to as the Baby Boom, because of the extra seventeen million babies born
during that period relative to previous census figures. It had the largest impact on our society due
to its size — roughly 78 million- and the period during which it came of age. Boomers witnessed
and participated in the political and social turmoil of their time: the Vietnam War, the civil rights
riots, the Kennedy and King assassinations.
Boomers were raised to respect authority figures, but as they witnessed their weakness
was “trust anyone over 30.” They grew up in an era of “prosperity and optimism and
strengthened by the sense that they are a special generation capable of changing the world, have
dependency in work with self-worth, contribution and personal fulfillment”. The oldest Baby
Boomers turned 62 in 2008, and as a whole, this generation is now in the mid to late part of their
careers. The totality of this generation will reach the traditional retirement age of 65 within the
next 25 years.
AUTHOR: Glass, 2007;
TITLE: The National Oceanographic and Atmospheric Association Office of Diversity, 2006;
Zemke et al., 2000
Boomers have been characterized as individuals who believe that hard work and sacrifice
are the price
to pay for success. They started the workaholic trend, believed in paying their dues and step-by-
step promotion. They also like teamwork, collaboration and group decision-making, are
competitive and do believe in loyalty toward their employers. Boomers are often confident task
Page | 20
completers and may be insulted by constant feedback, although they want their achievement to
be recognized. Some have described them as being more process- than result-oriented, although
they have also been characterized as being goal-oriented. Many are accepting diversity. They are
liberal, and conflict avoidant. They value health and wellness as well as personal growth and
personal satisfaction, and seek job security. Finally, Boomers have been described as having a
sense of entitlement, and as being good at relationships, reluctant to go against peers and
judgments of others who do not see things their way. They also thrive on the possibility for
change, and will fight for a cause even though they do not like problems. They value the chain of
command, may be technically challenged and expect authority.
2.1.3 Generation X
AUTHOR: Karp, H., Fuller, C., & Sirias, D. (2002).
TITLE: Bridging the boomer Xer gap. Creating authentic teams for high performance at work.
Palo Alto, CA: DaviesBlack Publishing.
In a study about Generation X, the U.S. Census Bureau defined this segment of the
population as consisting of individuals born between 1968 and 1979. However, the upper limit of
Generation X in some cases has been as high as 1982, while the lower limit has been as low as
1963. This generation was also called the baby bust generation, because of its small size relative
to the generation that preceded it, the Baby Boom generation. Members of Generation X are the
children of older boomers, who grew up in a period of financial and societal insecurity.
They witnessed their parents get laid off. They grew up with a stagnant job market,
corporate downsizing, and limited wage mobility, and are the first individuals predicted to earn
less than their parents did. They have grown up in homes where both parents worked, or in single
Page | 21
parent household because of high divorce rates, and as such, became latchkey kids who were
forced to fend for themselves. They were influenced by MTV, AIDS and worldwide competition
and are adapted to receiving instant feedback from playing computer and video games.
They aspire more than previous generations to achieve a balance between work and life.
They are more independent, autonomous and self-reliant than previous generations having grown
up as latchkey kids. They are not overly loyal to their employers although they have strong
feelings of loyalty towards their family and friends. They value continuous learning and skill
development.
They have strong technical skills and are result-focused. Xers naturally question authority
about the figures and are not frightened by them. Money does not necessarily motivate members
of this generation, but the absence of money might lead them to lose motivation. They like to
receive feedback, are adaptable to change and prefer flexible schedules. They can tolerate work
as long as it is fun. They are entrepreneurial, practical, and creative. Although they are
individualistic, they may also like teamwork more than boomers.
2.1.4 Generation Y
AUTHOR:Crampton, S. M., & Hodge, J. W. (2006).
TITLE: The supervisor and generational differences. Proceedings of the Academy of
Organizational Culture, Communications and Conflict, pg. 11, pg. 19–22
The lower limit for Generation Y may be as low as 1978, while the upper limit may be as
high as 2002, depending on the source. Members of Generation Y may include individuals born
between 1980 and 2002. The label associated with this generation is not yet finalized. Current
labels include Millenials, Nexters, Generation www, and the Digital generation, Generation E,
Page | 22
Echo Boomers, N-Gens and the Net Generation. Members of the generation have labeled
themselves as the Non-Nuclear Family generation, the NothingIs-Sacred Generation, the
Wannabees, the Feel-Good Generation, Cyberkids, the Do-or-Die Generation, and the Searching-
for-an-Identity Generation.
This generation has been shaped by computers, and dramatic technological advances.
One of the most frequently reported characteristics of this generation is their comfort with
technology. In general, Generation Y shares many of the characteristics of Xers. They are
supposed to value team work and collective action, embrace diversity, be optimistic, and be
adaptable to change. Furthermore, they seek flexibility, are independent, desire a more balanced
life, are multi-talented, and are the most highly educated generation. They also value training.
They have been characterized as demanding, and as the most confident generation. Like Xers,
they are also supposed to be entrepreneurial, and as being less process focused.
2.2 POSSIBLE GENERATIONAL DIFFERENCES AND SIMILARITIES
AUTHOR: (The National Oceanographic and Atmospheric Office of Diversity, 2006)
TITLE: Tips to improve the interaction among the generations: Traditionalists, boomers, X’ers
and nexters
2.2.1 Attitudes towards work
The perceived decline in work ethic is perhaps one of the major contributors of
generational conflicts in the workplace. Generation X for instance, has been labeled the ‘slacker’
generation, and employers complain that younger workers are uncommitted to their jobs and
work only the required hours and little more. Conversely, Boomers may be workaholics and
reportedly started the trend while Traditionals have been characterized as the most hardworking
Page | 23
generation. Indeed, the prevailing stereotype is that younger workers do not work as hard as
older workers do. Whether the younger generations do not work as hard as previous ones is
debatable.
A cross-sectional comparison of 27 to 40 year olds versus 41 to 65 year olds in 1974 and
1999 indicated that both age groups felt that it was less important that a worker feel a sense of
pride in one’s work in 1999 than in 1974. In both age groups, work values among managers
declined between 1974 and 1999.
Both age groups were also less likely in 1999 to indicate that they believed that how a
person did his or her job was indicative of this individual’s worth. In 1999, both age groups were
also less likely to believe that work should be an important part of life or working hard made one
a better person. Furthermore, older employees had a less idealized view of work than younger
workers did. Indeed, it was postulated that after witnessing the lack of employer loyalty toward
employees, the latter consequently developed a less idealized view of work. Other sources of
evidence do not support the claim that there is a decline in work ethics among younger
generations. For instance, Tang and Tzeng (1992) found that as age increased, reported work
ethic decreased, indicating that younger workers reported higher work ethics than older workers.
Similarly, the 1998 General Social Survey, National Opinion Research Center Survey
indicated that 44% of those aged 18 to 24 indicated that they would choose to spend more time at
work, compared to 23% of workers of all ages, indicating that most younger workers were
willing to try to work more, more so than the average worker. However, these findings are not
very recent. The possibility that the perceptions about the decline in work ethics is accurate, but
Page | 24
simply unsubstantiated by research due to lack of research in the area therefore remains.
Nevertheless, numerous factors beyond generational factors affect the work ethics of employees.
For instance, work ethic varies with education level, whether a person works full-time or
part-time, income level and marital status. The lower the level of education of an employee, the
higher their work ethic has been found to be. People with full-time jobs were found to be less
likely to endorse a protestant work ethic than people with part-time jobs; and people with low
incomes and those who were married tended to report stronger protestant work ethic. The
perception of how hard one works may also be associated with how individuals themselves
approach tasks as well. For instance, boomers have often been characterized as being process-
oriented, while younger generations, as being results-focused, irrespective of where and when
the task
is done. While younger workers focus on high productivity, they may be happier with the
flexibility of completing a task at their own pace and managing their own time, as long as they
get the job done right and by the deadline. Current empirical evidence does not address this
particular point however.
AUTHOR: (The National Oceanographic and Atmospheric Office of Diversity, 2006)
TITLE: Tips to improve the interaction among the generations: Traditionalists, boomers, X’ers
and nexters
2.2.2 Loyalty towards the employer
Another point of contention among generations regards loyalty towards employers. While
Traditionals and Boomers have been characterized as being extremely loyal toward their
employers, the lack of loyalty of younger workers, especially Xers has been noted. For instance,
Page | 25
it has been postulated that Xers may value their relationship with their co-workers above the
relationship with their company, especially if this co-worker is a friend, and that giving the
employer two-weeks’ notice may be an Xer’s idea of loyalty towards the employer. In addition,
Xers presumably view job-hopping as a valid career advancement method. Xers presumably
learned that loyalty to an employer did not guarantee job security, from witnessing job losses
among parents who were loyal to their employers and played by the rules. Xers more so than
boomers have been found to report that remaining loyal to an employer was outdated and were
significantly less likely to report being loyal to their employer.
However, in that particular study, the Xers interviewed were graduate students and the
extent to which such results are applicable to non-graduate students is of course debatable.
Nevertheless, loyalty towards
employers has been found to decrease, depending on how ‘new’ the generation was: the younger
the generation, the least loyal the generation appeared to be. For instance, about 70% of
traditionals reported that they would like to stay with their current organization for the rest of
their working life compared with 65% of boomers, 40% of Xers, and 20% of Yers.
However, such a finding may make intuitive sense, given that humans tend to prefer the
familiar and seek stability as they grow older. Consequently, they may be less desirous of going
through the process of socializing into a new organization at a later stage in their lives. Smola
and Sutton (2002) also found younger employees to be less loyal to their company and more
‘me’ oriented. They wanted to be promoted more quickly than older workers, were less likely to
feel that work should be an important part of their life and
reported higher intention of quitting their job if they won a large amount of money. However, the
perception of loyalty may be context dependent. Firstly, compared with older generations, Xers
Page | 26
and Yers do not change jobs more frequently than older people did at the same age. Furthermore,
the frequency with which individuals change jobs may also be related to the economy, as people
are more likely to change jobs if the economy is good and opportunities are numerous.
Finally, younger workers typically hold several jobs while still studying, but tend to
stabilize with one employer as they get older. Therefore, loyalty (or lack of thereof) may be more
a matter of age or other contextual circumstances than a generational trait. Although the extent to
which employees feel loyal towards their organizations appears to differ across generations,
members of all generations reportedly share similar reasons for staying in their organization. In
her book, Retiring the Generation Gap, which provides a wealth of information about
generational differences in the workforce, Deal (2007) reported that other factors likely to
increase employees’ loyalty included for instance, opportunities for advancement and
promotions, opportunities to learn new skills and develop a challenging job, as well as better
compensation such as higher salaries or benefits.
Employees were also more likely to stay if the company’s values matched their own. For
instance, how a business handles organizational change and manages itself as well as whether the
business creates
opportunities for a better quality of life, better communication, and improvements such as more
autonomy, control and greater contribution to their specific job were cited as company values
that mattered. Individuals were also more likely to remain with an organization if the
organization respected older people with experience more than younger people, and if
organizations respected younger people, at least for their talents.
Page | 27
2.2.3 Attitudes regarding respect and authority
Xers complain about managers who ignore ideas from employees, and ‘do-it because I
said so’ management. While younger workers complain that there is a lack of respect towards
them in the workplace, older workers share similar complaints, especially regarding the attitudes
of younger and newer employees toward management. Deal (2007) examined the attitudes of
members of different generations relative to authority finding that 13% of members of the
traditional generation included authority among their top 10 values, compared to 5% of boomers,
6% of Xers and 6% of Yers.
This suggests that authority might be valued more by members of the traditional
generation than members of other generations. Although the percentages are small, they lend
some support to the prevailing stereotypes that Traditionals display command-and-control
leadership reminiscent of military operations and prefer hierarchical organizational structures.
However, these figures do not support the claim that
Boomers presumably also prefer a top-down approach to management. Most importantly, these
figures indicate that the characteristics that are often attributed to a generation as a whole are
often shared by only a small percentage of individuals within that generation.
The popular literature contains more information about how younger generations interact
with authority, as opposed to how they act when in position of authority. For example, both Xers
and Yers are comfortable with authority figures and are not impressed with titles or intimidated
by them. They find it natural to interact with their superiors, unlike their older counterparts and
to ask questions. Yers in particular have been taught to ask questions, and questioning from their
perspective does not equate with disrespect. Similarly, Yers believe that respect must be earned
Page | 28
and do not believe in unquestionable respect. While there is not an empirical basis regarding the
behaviors of Yers and Xers when in position of authority, only a small percentage of the younger
generations feel a need to exert authority.
Younger workers like their older counterparts want to be respected, although the
understanding of respect among older and younger workers differs. Older workers want their
opinions to be given more weight because of their experience and for people to do what they are
told, while younger workers want to be listened to and have people pay attention to what they
have to say. Furthermore, older people may not appreciate equal respect showed to all, and may
want to be treated with more respect than one would show someone at a lower level in the
hierarchy or with less experience. Therefore, meeting the expectations of respect that individuals
hold may be a genuine challenge in the workplace.
2.2.4 Desire for a better work/life balance
One characteristic often attributed to younger workers, perhaps more so to Xers, is their
desire for balance between work and life. As children, Xers reportedly saw their parents lose
their jobs, despite making sacrifices for their careers, and grew up to value a balance between
work and life. Although much of the evidence is anecdotal, 45% of workers aged 18 to 24, 37%
of workers aged 25 to 34, and 37% of workers of all ages who participated in the 1998 General
Social Survey, National Opinion Research Center indicated that they worked hard, but did not let
work interfere with the rest of their lives.
Page | 29
The youngest workers were most likely to try not to let work interfere with the rest of
their lives. Only 37% of the younger members of Generation X reported doing the best work
they could even if it interfered with the rest of their lives, as opposed to 54% of all workers,
again confirming that younger workers were attempting not to let work interfere with the rest of
their lives. However, although older Xers are most likely to want a work/life balance, members
of other age groups to varying extent also aspire to the same thing.
2.2.5 Attitudes towards supervision
Workers appear to differ in the extent to which they appreciate supervision and require
feedback. For instance, younger workers presumably dislike micromanagement, but do want
strong leadership with clear instructions. A study comparing Xers, Boomers and Traditionals in
the public sector workforce indicated that boomers valued freedom from supervision
significantly more than Xers. However, there was no difference
between Xers and Traditionals or Boomers and Traditionals in the extent to which they wanted
freedom from supervision. Workers from each generation also differ in the extent to which they
require feedback. While younger workers prefer regular feedback, older workers may be insulted
by it.
2.2.6 Other sources of differences
Other elements of the workplace across which members of the four generations differ
include their perception of what contributes to success in the workplace, and their preferred
leadership attributes. Traditionals believe that in order to be successful in the workplace, they
have to meet deadlines, whereas the three younger generations believe that success rests in the
use of computers. While Traditionals, Boomers, and Xers prefer a leader who has credibility,
Yers prefer a leader who listens well.
Page | 30
While there may be differences across generations, those differences are often context or
age dependent rather than generational traits per se. Furthermore, there are similarities among
generations. For instance, the generations share similar concerns about change, reasons for
staying in an organization, values, and preferred mode of communication. Similarly, workers
from all generations want the freedom to set their own hours, if the work is done, indicating that
this is not a preference of the young only. The majority of workers believe that fairness is the
most important aspect of workplace culture, and that feeling valued, recognized, and appreciated
and being in a supportive environment encourage happiness in the workplace. Generational
differences may not manifest themselves in the workplace as much as postulated by the popular
literature.
For instance, Xers, Boomers and Traditionals all want to benefit society, engage in
satisfying leisure, exercise leadership, have friendly and congenial associates, have a high salary,
high prestige, and status, make contributions to important decisions, have a stable and secure
future, variety in work assignments, and work as part of a team.
2.3 LEADERSHIP STYLES:
AUTHOR: (The National Oceanographic and Atmospheric Office of Diversity, 2006)
TITLE: Tips to improve the interaction among the generations: Traditionalists, boomers, X’ers
and nexters
DIFFERENT GENERATIONS IN THE SHRM ARTICLE LEADERSHIP STYLES:
Generational Differences, by Nancy R. Lockwood,the author stresses the importance of using
flexible leadership styles to address the needs and expectations of multiple generations at work.
The article recommends the following best practices to better equip leaders and managers and to
increase productivity and retention.
Page | 31
 Silents
• Create positive working relationships by gaining trust and respecting their experience without
being intimidated by it.
• Gain their confidence by demonstrating compassion and understanding.
 Baby Boomers
• Preferred leadership style is collegial and consensual.
• Gain their confidence by demonstrating compassion and understanding.
• Approach them with respect for their achievements.
• Involve them in participating in the organization’s direction and implementation of change
initiatives.
• Challenge them to contribute as part of a team to solve organizational problems.
• Offer opportunities to serve as a coach as part of the change process.
• Support work–life balance.
 Gen Xers
• Respect the experiences that have shaped their beliefs and thinking.
• Tell them the truth.
• Honor sense of work–life balance.
• Offer mentoring programs.
• Clearly communicate that repetitive tasks and quality checks are part of the job.
• Offer learning opportunities.
 Gen Yers
• Take time to orient with respect to the organization’s culture.
• Provide structure and strong leadership.
Page | 32
• Be clear about expectations and long-term goals.
• Offer mentoring programs.
Page | 33
Tr d o
or 1925 1945
b oom r
or 1946 1964
M
MM
B
B
B M
B
B
M M
M
M B
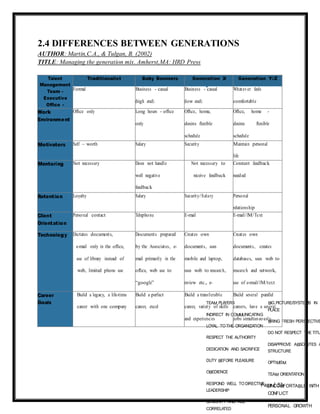
2.4 DIFFERENCES BETWEEN GENERATIONS
AUTHOR: Martin,C.A., & Tulgan, B. (2002)
TITLE: Managing the generation mix. Amherst,MA: HRD Press
Talent
Management
Team -
Executive
Office -
United
Nations Joint
Staff Pension
Fund ire
Traditionalist Baby Boomers Generation X Generation Y/Z
Formal Business - casual
(high end)
Business - casual
(low end)
Whatever feels
comfortable
Work
Environment
Office only Long hours - office
only
Office, home,
desires flexible
schedule
Office, home -
desires flexible
schedule
Motivators Self – worth Salary Security Maintain personal
life
Mentoring Not necessary Does not handle
well negative
feedback
Not necessary to
receive feedback
Constant feedback
needed
Retention Loyalty Salary Security/Salary Personal
relationship
Client
Orientation
Personal contact Telephone E-mail E-mail/IM/Text
Technology Dictates documents,
e-mail only in the office,
use of library instead of
web, limited phone use
Documents prepared
by the Associates, e-
mail primarily in the
office, web use to
“google”
Creates own
documents, uses
mobile and laptop,
uses web to research,
review etc., e-
mail/mobile 24/7
Creates own
documents, creates
databases, uses web to
research and network,
use of e-mail/IM/text
24/7Career
Goals
Build a legacy, a life-time
career with one company
Build a perfect
career, excel
Build a transferable
career, variety of skills
and experiences
Build several parallel
careers, have a several
jobs simultaneously
Page | 34
2.5 MOTIVATION AND TRAINING OF GENERATION X AND Y
How to
motivate
Generation X
How to
effectively train
Generation X
How to motivate
Generation Y
How to effectively
train Generation Y
They tend to avoid
corporate politics
They are generally not
very interested in
traditional perks
They are motivated by the
prospects of independence,
the lack of corporate
structure and lack of
rigidity
They are motivated by the
possibility of the latest
technological advances
They need to be made
clear what you are looking
for
Allow them to question the
experts and the authority
Web-based training
Allow them to ask
questions and challenge
the concepts
Keep the training
materials brief and easy
to read
Offer multi-media
learning opportunities
Ensure access to
simple, logically
organized knowledge
database
Sensitive to design and
graphics
This group maintains
short attention span
They love a
challenge
They function well as
team members
They want to be
heroes
They want to be
surrounded by bright,
creative people
They want it right now
They are looking for the
empowerment
They thrive in multi-media
environment
They can learn any time anywhere
They need flexibility
Multi-tasking
Enable internet reliance (Webinars,
IM, Blogs, Podcasts, Avatars,
YouTube)
Enable social networking through
internet (My Space, Friendster)
Provide with simulations
Provide with the structured
learning regardless of the form
Connect me with everything
True team players
Page | 35
CHAPTER 3
Research
Methodology
Page | 36
CHAPTER 3: RESEARCH METHODOLOGY
INTRODUCTION
Generation gaps in the workplace are nothing new. Changes in the work force bring about a need
for change in management styles. Treating everyone the same is not so important anymore.
Treating everyone fairly is critical. Lack of attention to generational differences will make any
company less attractive to recruits, resulting in higher recruiting costs and greater difficulty in
finding the right employees. The critical management skills will involve understanding
generational differences in order to strengthen work relationships between and among
employees.
Understanding how these generations are actually coming together should help
companies design work/life programs that can help them train, develop, and retain employees. It
should also lead to ideas on how the generations can work together most effectively and
efficiently. Due to the above, we thought that it is significant for Human Resource Managers in
the business world today to understand and realize the difference between the four generations of
employees. We also studies how well the organization in today’s work force deals with this gap.
3.1 Research Approach
An effective strategy has been used to collect most of the information and data from
various sources. The research is termed as “primary research “as different methods are used to
collect information from employees of Allied Bank.
Page | 37
3.2 Research Purpose
In order to carry out the current research work, quantitative research methods has been
used. Quantitative method uses numbers to examine data or information. It is one of the methods
used by the
science. The quantitative data are those that are shown numerically, such as statistics,
percentages, etc. The quantitative method is opposite to qualitative method or qualitative
research, which takes wider questions and gathers information from study participants who
cannot translate it into numbers, but only in words. The quantitative methods are often used in
the social sciences such as psychology, economics, sociology, political science, and to a lesser
extent, anthropology and history.
The purpose of this research work is to identify the impact of generation gap at
workplaces. Therefore, in order to find out the factor of influence the researcher has opted for
using quantitative method so that the data can be gathered through questionnaire and analyzed
using statistical technique.
3.3 Research Design
Research design is divided into various types of designs including investigational,
fundamental, correlational, and expressive research. They help in identifying different types of
research methods. But the most prominent and appropriate research method which has been
applied in this research paper is investigational research.
3.4 Research Methodology
There are several methods of conducting research which are generally used by the
researchers while carrying out their respective researches. However, the two most commonly
Page | 38
used research methods are quantitative and qualitative research methods. In carrying out the
current research work, we have opted for quantitative research methods. In the current research,
we have gathered quantitative data from questionnaire and interview.
3.5 Sample Size and Target Population
With the purpose of collecting secondary data, information is gathered from sample size
which consisted of 75 employees. The data has been gathered with the help of closed ended
questionnaire based on Likert Scale. The target population of our research work is employees of
Allied bank working in Gulshan Branch, Shahrah-e-Faisal Branch, Jauhar branch and
M.A.Jinnah Road branch.
3.6 Sampling Technique
Before moving on to data collection, it is necessary to understand that sampling is an
essential phase. Sampling, as it name tells refers to make a sample. Here the sample is referred to
the population. Population is people who are considered to be respondents or the people from
whom the primary data is to be collected. There are some cases where sampling may fail when
there is a very less population, in such cases the whole population is to be considered.
In order to have more précised sample size, and to follow survey methodology in
statistics, a sampling technique is identified. We have opted for simple random sampling for our
research project.
Page | 39
 Simple Random Sampling
In the present research work, we have followed simple random sampling technique. The
required sample size has been identified using SRS-simple random sampling. In this technique
there is an equal probability for all the subsets of the frame. Every element holds equal
opportunity to be selected. In addition to the any provided pair has equal chance for selection in
comparison to any other pair. This technique reduces the biasness and helps in simplifying
analysis. Moreover, the difference among the results obtained from individuals within the
defined sample becomes an indicator of variance in the whole population that facilitates in
making it easier to assess the results accuracy.
3.7 Data Source
Primary data has been collected in order to carry out this study. The data has been
gathered by us using questionnaires. Close ended questionnaire method has been taken into
consideration by us. The key point here is that the data collected by us is unique and must not be
accessible unless it is published.
3.8 Sampling Unit
The unit of analysis is individuals.
3.9 Data Collection Method
Methods of data collection refer to the ways through which both primary and secondary
information has been collected for the research completion and selection of the appropriate
method. However, the selection of method varies on the nature of study that is being conducted,
on the data that needs to be gathered, the financial limitations and time that the researcher has
faced while conducting research.
Page | 40
 QUESTIONNAIRE FORMATION
Since the questionnaire is chosen to be the instrument for primary data collection, it should be
kept in mind that there are few considerations and requirements by the in-charge of the report to
be kept in mind when making a questionnaire.
3.10 Instrument for Data Collection
Survey has been carried out through questionnaires. Closed-ended questionnaire is
designed based on Likert Scale. The questionnaire included two main sections; first section is
based on background information, however, second section is based on the questions that have
helped in gathering required data. Interview was also held with the top management employees.
3.11 Statistical Technique/Tool
For the analysis of the data gathered, different charts will be formulated on the basis of
data gathered from the questionnaire survey.
3.12 Hypothesis
Our alternate hypothesis is as follows:
H1: Generation Gap exists at workplaces (Allied Bank)
Our null hypothesis is:
HO: Generation Gap does not exist at workplaces (Allied Bank)
3.13 Ethical Considerations
Although there are no identifiable risks in the course for the preparation of this paper, certain
considerations are recognized for anyone participating in the study, directly or indirectly.
Page | 41
The considerations are duly noted and are used extensively in the research design stage.
However, certain precautions are observed for the safety and security of anyone directly affected
by the study or the conduct of the research. We are completely conscious of the ethical
consequences implied in this research. Obligation for all processes and ethical consequences
associated with the research remains with the primary researchers. Study was carried on in such a
way that the reliability of the research project was preserved and negative impacts which may
reduce the prospective for succeeding studies are avoided.. The research study is based on an
intellectual issue.
We have been aware of the possible effects that can be harmful in various circumstances
and the method that has been adopted after consulting our supervisor Sir Ali Askari. The
research method was completely justified.
3.14 Reliability
Reliability as to the materials or information used is guaranteed. Reliability as to the results of
the interviews, surveys and other means of obtaining data is also assured since it is us who
personally undertakes these activities. Reliability is a psychological concept that refers to the
consistency of a measure. A test is considered reliable if we get the same result repeatedly. For
example, if a test is designed to measure a trait (such as introversion), then each time the test is
administered to a subject, the results should be approximately the same. Unfortunately, it is
impossible to calculate reliability exactly, but it can be estimated in a number of different ways.
The concept of reliability is not of too much concern supposedly since the research is
somewhat limited in scope without digging into the details of complicated and scientific means.
Page | 42
The research does seek to explain a theory out of the methodology results about generational gap
at workplaces since it only provides a bird’s eye view which means it is broad enough. It tells us
what generational gap is and how it is impacting at workplaces. In general, the research is just an
“eye-opener” for us. However, reliability should still be observed to avoid confusion of facts and
misinterpretations of information and data obtained.
3.15 Validity
Essentially, validity entails the question, “does your measurement process, assessment, or
project actually measure what you intend it to measure?” The related topic of reliability
addresses whether repeated measurements or assessments provide a consistent result given the
same initial circumstances. In research, validity has two essential parts: internal and external.
Internal validity includes whether the results of the study (e.g. mean difference between
treatment and control groups) are genuine because of the way the groups were selected, data was
recorded or analysis performed. For example, a study may have poor internal validity if testing
was not performed the same way in treatment and control groups or if confusing variables were
not accounted for in the study design or analysis. External validity, often called
“generalizability”, involves whether the results given by the study are transferable to other
groups (i.e. populations) of interest.
Validity can be correlated and paired with reliability in that both have the same purpose of
confirming the integrity of the research methodologies used as well as the materials and
information obtained and integrated in the research. Validity essentially deals with the
“truthfulness” of the information and the results of interviews, surveys and tests conducted. The
validity of the research can be tested by anyone who has a stake in the study or whose interest in
it forms part of their educational development. The researcher is still obliged to observe the
Page | 43
necessary rules in validating all information and data used to prevent undesirable consequences
when the research is eventually reviewed by peers and other interested stakeholders.
3.16 Limitations
The research is done with the need of extensive travel and additional funds, the common
limitations of all forms of research. In addition, the research is conducted only in a particular
community with a representative population deemed sufficient for scientific reliability and
validity. However, the only limitation that would greatly affect the conduct of the research is the
sourcing of participants for the different methodologies in the community. This may not be an
uninteresting process but requires a focus of attention since it can be time-consuming which also
limits the period of completing the research.
Other limitations include:
 Budget for research is not allocated and all expenses will be paid on our own
costs.
 The amount of time to complete this research is limited as we have to submit and
present the data/finding in 12-weeks’ time.
 This will be our first research work so we will be lacking the experience to do the
research.
Page | 44
3.17 TIMESCALE
1. Approval of research strategy and topic with supervisor = August
2. Proposal Drafting = August
3. Review and draft of literature = End of August till start of September
4. Approval of formal access to organization for collection of primary data = End of September
5. Administer questionnaire = October
6. Final collection of questionnaire = End of October
7. Data analysis = End of October
8. Final writing of project report = First week of November
9. Report Submission = 16TH November, 2015
Page | 45
3.18 Chapter References:
INTRODUCTION:
 Broderick, A. (1998, May/June.). Managing Diversity. Women in Business, 44(3), 13-14.
 Coolidge, S. D. (1999, August. 9). Generations Apart. Christian Science Monitor,
91(177), 11.
 Ruch, W. (2000, April.). How to Keep Gen X Employees From Becoming X-Employees.
Training & Development, 40-43.
VALIDITY:
 Creswell, J. W. (1998). Qualitative inquiry and research design: Choosing among five
designs. Thousand Oaks, CA: Sage.
 Cohen, L. Manion, L. and Morrison, K.R.B. (2007) Research methods in education, 6th
Edition. Routledge.
 Cooper, D.R. and Schindler, P.S. (2006) Business Research Method, 9th Edition. Boston:
McGraw-Hill Irwin.
RELIABILITY
 Edris, T., & Meidan, A. (1990). On the Reliability of Psychographic Research:
Encouraging Signs for Measurement Accuracy and Methodology in Consumer Research.
European Journal of Marketing , 24 (3), pp. 23-41.
 Cherry, K. (no date). What is reliability? About.com Pscyhology online. Retrieved on
February 6, 2013 from
http://psychology.about.com/od/researchmethods/f/reliabilitydef.htm
Page | 46
CHAPTER 4
MARKET
RESEARCH AND
ANALYSIS
Page | 47
4.1 SWOT ANALYSIS
SWOT analysis is an acronym that stands for Strengths, Weaknesses, Opportunity and Threats.
This is a careful evaluation of an organization’s strengths to avail an opportunity by overcoming
its weaknesses and phasing out all he threats to its survival in order to grow and survive.
4.2.1 Strengths
• This branch is provided with 3 fax machines, more than 7 telephone connections, which make
communication easier with different branches
• The branch is linked through an online network of 755 BRANCHES, thus enabling them to
serve customer in better way.
• This branch is provided with latest computer which increases the speed of computer work.
• The branch is situated in the commercial hub of Rawalpindi. This location provides a
competitive edge to the Branch.
• The branch is situated in commercial area were business activities perform greater as compare
to residential area. Thus it increases the number of customers.
• The Branch has the most experienced and the least experienced staff, which is a good
combination of experienced heads and exuberance of youth.
• The branch is the main branch in the areas, which is another plus point for the Branch.
• It holds the Hundi Accounts, where the payments are made through checks. This process
provides an opportunity to the Branch to have more of the Hundi customers as the Bank
customers.
Page | 48
4.2.2 Weaknesses
• The Branch has a good staff combination on the basis of experience, but their training
capabilities are not up to the requirements of the fast changing banking environment.
• The customer’s Long-term contacts are not maintained with customers.
• The technical training of the staff is negligible e.g. in case of the absence of computer there is
no alternate trained personal who can record the daily transactions.
• The organization is very much mechanistic and provides no flexibility to encourage creativity.
• The lower staff is non cooperative as compared the lower staff of other branches.
• The control of manager is not effective.
• The discretionary powers of manger are very low to offer more incentives and value added
services to its customers.
• There is a lack of commitment and professionalism on part of the employees. The staff is
always in a hurry to leave the bank as soon as possible. They were also observed to starting their
operations comparatively late.
• The organizational culture is not cooperative
• Nepotism was observed on part of the manger as well as the top management towards some
staff members.
• The branch has no industrial accounts.
• The level of technology management in the branch is very low. The technology available is not
maintained well mainly because of the lack of technically trained staff. For instance the scanner,
in spite of its availability has not been used for scanning the specimen signature cares.
• In spite of the presence of technology many jobs are done manually such as the letters, drafts
for fax messages and other calculations, which could be easily, done in MS Word and MS Excel.
Page | 49
• The branch lacks some physical facilities such as clean washrooms which can affect
employee’s performance
• The layout of the branch is such that it is hindering the flow of work on one hand and the
documents are lying exposed which can be easily taken away by any person entering the branch.
4.2.3 Opportunities
• The biggest opportunity for the ABL, Tench Bazaar branch Rawalpindi is the greater number
of Christine customers who get their payments through ABL, Bank Tench Bazaar branch. These
customers can be easily convinced to open their accounts with ABL.
• A considerable portion of the labor force of the area is serving overseas. Their families can be
encouraged to use ABL as channel for remittances.
• The Internet facility in the area provides an opportunity to ABL to get Online.
• The Bank has the basic infrastructure, which can facilitate the online process.
• The location of the ABL, Tench Bazaar branch itself provides an opportunity to ABL to get
more and less cost deposits.
• The group from its survey and analysis of IT companies has found out that there are many
companies which are not satisfied with its current bank, so Tench branch with its superior service
quality and long working hours can capture those customers
4.2.4 Threats
• The biggest threat to the operational success of the branch is the better competitor’s services.
Many private sector banks are offering higher rates of return to customers than Allied Bank of
Pakistan.
Page | 50
• Cannibalization of profits is yet another threat to the success of Bank Tench Bazaar branch.
The branch of
Allied Bank is located very close to the Soneri Bank Tench Bazaar branch. All these branches
are taking away each other’s customers.
• One of the biggest to the ABL, Tench Bazaar branch is the increasing rate of dissatisfies
customers. Most of these customers were observed to be dissatisfied with the delays in their
servicing.
• The greatest threats to the performance of ABL, Tench Bazaar branch are the decreasing
morale of employees. They feel that they are not provided with bonuses. They are not given
proper attention to have a say in the annual meetings. The proxy forms are signed on their behalf
without letting them know.
• High-pressure interest groups are developing which poses a constant threat to Allied Bank.
4.2 PEST ANALYSIS
4.3.1 POLITICAL
Pakistan despite all international and public perceptions, today is a functioning democracy and
gradually there is a change in complexion and composition of legislatures with more educated
people and women (27% of National Assembly and17% of Senate) entering into politics.
Similarly it helps in designing best strategies to implement that could support the revival of bank
Page | 51
industry. Like in the era of nationalization banks had to suffer as other industries that’s why that
impact is still found in the performance of this industry.
4.3.2 ECONOMICAL
Although banking sector development is important at the early stage of economic growth,
general liberalization presuming a homogeneous bank role may not necessarily promote growth.
The estimated cost structure indicates that state-owned commercial banks are large enough,
while development financial institutions and private banks can expect to obtain cost-saving
advantages by expanding their operations. Since scope economies are significant, portfolio
diversification generally increases bank profits. In addition, privatized banks are the most
efficient, followed by foreign and private banks. Public banks are the least efficient.
4.3.3 SOCIAL
Banks always helped people in improvement of living condition of poor people in various forms
like giving loans to poor for starting business or directly providing them the instruments that
could enhance their living conditions. Similarly Allied Bank always tried to provide the needy
people loans on soft terms and also helped to eradicate unemployment by providing job
opportunities Recent high growth trends coupled with enhanced spending on social and005/2006
has together begun to pay some dividends as evident from the reversal in poverty incidence
trends and social indicators.
4.3.4 TECHNOLOGY
The Banking sector in Pakistan has experienced a rapid transformation. Just about a decade back
this sector was limited to the Sarkari (read nationalized) and co-operative banks. Then came the
multi-national banks, but these were confined to serving an elite few. One could regard the past
Page | 52
as the 'medieval ages' in the banking industry, wherein every branch of the same bank acted as an
independent information silo and multi-channel banking (ATMs, Net banking, Tele-banking,
etc.) was almost non-existent.
Today banks have to look much beyond just providing a multi-channel service platform for its
customers. There are other pressing issues that banks need to address in order to chalk-out a
roadmap for the future. Here are the top three concerns in the mind of every bank's CEO. The
customer is interested in how he/she can benefit from the bank and its products. That's why it
becomes necessary for a bank to differentiate its products from the others. Some of the ways in
which differentiation can be introduced are through specialization, new products, and increasing
the added value
4.3 A COMPARATIVE STUDY OF ALLIED BANK OF
PAKISTAN AND MUSLIM COMMERCIAL BANK OF
PAKISTAN
A comparative study is made between the Allied bank Limited and the
Muslim Commercial Bank in pre-privatization period (1980-1991) and the post-
privatization era (1991-2000). Four components are selected to assess the impact of
privatization on both banks and the reliability of components in both eras.
Nonparametric tests, regression and Reliability models are applied to see the
progress within banks and within the nationalization and privatization periods. The
results show that the investment of ABL increased and surpassed the investment of
Page | 53
MCB in post-private period. However, the deposits of the MCB enhanced in post-
privatization period as compared to the ABL. The income has no significant impact of
privatization on both the banks. The ABL significantly improved its pre-tax profit as
compared to the MCB.
Table 1: Profitability of ABL and MCB in both periods
Allied Bank Limited Muslim Commercial Bank
Pre-Privatization Post-Privatization Pre-Privatization Post-Privatization
Deposit 90408 497288 195274 956451
Income 9198 58755 31814 23016
Pre-Tax
Profit
337 269456 1595 7444
Investment 32994 569354 66768 388334
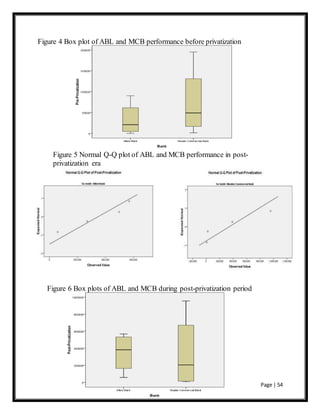
The following figures show a comparative analysis of the progress of the
components of both banks in both study periods. The box plots clearly illustrate the
overall evolution of the banks. The efficacy of the MCB in general is has been
increased rapidly after the bank was privatized.
Figure 2,3 Normal Q-Q Plot of pre-privatization of ABL and MCB
Page | 54
Figure 4 Box plot of ABL and MCB performance before privatization
Figure 5 Normal Q-Q plot of ABL and MCB performance in post-
privatization era
Figure 6 Box plots of ABL and MCB during post-privatization period
Page | 55
Table 6.46 Paired Samples Statistics of pre and post-privatization of indicators and Banks
Mean N Std. Deviation Std. Error Mean
Pair 1 Pre-Privatization 53548.50 8 65478.424 23150.119
Indicators 2.50 8 1.195 .423
Pair 2 Post-Privatization 346262.25 8 328312.702 116076.069
Indicators 2.50 8 1.195 .423
Pair 3 Pre-Privatization 53548.50 8 65478.424 23150.119
Bank 1.50 8 .535 .189
Pair 4 Post-Privatization 346262.25 8 328312.702 116076.069
Bank 1.50 8 .535 .189
Pair 5 Pre-Privatization 53548.50 8 65478.424 23150.119
Post-Privatization 346262.25 8 328312.702 116076.069
Table 6.47 Paired Samples Correlations of Indicators and Banks
Correlation Sig.N
Pair 1 Pre-Privatization & Indicators 8 -.545 .163
Pair 2 Post-Privatization & Indicators 8 -.235 .575
Pair 3 Pre-Privatization & Bank 8 .332 .422
Pair 4 Post-Privatization & Bank 8 -.008 .985
Pair 5 Pre-Privatization & Post-
Privatization
8 .860 .006
Table 6.48 Paired Samples Test Indicators and Banks in pre and post-privatization periods
Paired Differences
95% Confidence
Interval of the
Difference
Mean Std.
Deviation
Std.
Er
ror Mean
Lower Upper t df
Sig.
(2-
tailed
)
53546.000 65479.075 23150.349 -1195.877 108287.87
7
2.313 7 .054Pair 1 Pre-Privatization -
Indicators
Pair 2 Post-Privatization -
Indicators
346259.750 328312.983 116076.168 71783.227 620736.27
3
2.983 7 .020
Pair 3 Pre-Privatization – Bank 53547.000 65478.247 23150.056 -1194.184 108288.18
4
2.313 7 .054
Pair 4 Post-Privatization – Bank 346260.750 328312.706 116076.070 71784.459 620737.04
1
2.983 7 .020
Pair 5 Pre-Privatization - Post-
Privatization
-292713.750 274009.993 96877.162 -
521791.837
-63635.663 -3.021 7 .019
Page | 56
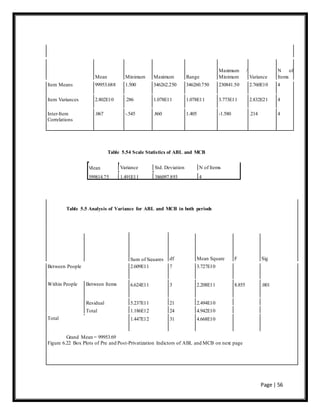
Mean Minimum Maximum Range
Maximum /
Minimum Variance
N of
Items
Item Means 99953.688 1.500 346262.250 346260.750 230841.50 2.760E10 4
Item Variances 2.802E10 .286 1.078E11 1.078E11 3.773E11 2.832E21 4
Inter-Item
Correlations
.067 -.545 .860 1.405 -1.580 .214 4
Table 5.54 Scale Statistics of ABL and MCB
Mean Variance Std. Deviation N of Items
399814.75 1.491E11 386097.893 4
Table 5.5 Analysis of Variance for ABL and MCB in both periods
Sum of Squares df Mean Square F Sig
Between People 2.609E11 7 3.727E10
6.624E11 3 2.208E11 8.855 .001Within People Between Items
Residual 5.237E11 21 2.494E10
Total 1.186E12 24 4.942E10
1.447E12 31 4.668E10Total
Grand Mean = 99953.69
Figure 6.22 Box Plots of Pre and Post-Privatization Indictors of ABL and MCB on next page
Page | 57
Figure 6.23 Comparison of performance of Banks in both periods
4.4 CONCLUSION
A comparative analysis was conducted by taking two banks i.e. Allied Bank Limited
and Muslim Commercial Bank into consideration. The focus was given on the impact
assessment of privatization on both banks during the period mentioned in the research
Page | 58
from 1980 to 2000. The results obtained were mixed. The indicators analyzed individually
at first instance to examine their validity, reliability, efficacy and growth in both the
periods of nationalization and privatization. Thereafter, the components of the bank
performance were compared from bank to bank and era to era. In the end the overall
progress of two banks were taken and measured their stability, reliability, development
and efficacy in both, pre-privatization and post-privatization periods. The analysis is
concluded as under:
Both the banks i.e. Allied Bank and The Muslim Commercial Bank had their own
competitive environment before the privatization. The banks improved regularly the
deposits, investment, pre-tax profit and assets. The government of Pakistan from the
year 1991 took measures to raise capital and bring the financial institutions into an
open environment of competency. In wake of financial reforms, the privatization program
was launched which proved to be landmark in the development of economy of Pakistan in
1990s.
Some indicators like employment rate and the income were progressing slowly and
remained unchanged even after the privatization process. That is to say that the
privatization process brought about no impact on some of the components of banking
development. Reason behind this lacking may be the policy reforms in financial matters
by the frequently changing governments and legal obligations of the privatization process.
The Allied Bank Limited showed a slow progress as compared to the Muslim
Page | 59
Commercial Bank throughout the privatization period. The reasons explored are the
transfer of the bank from pre-nationalization to the nationalization without taking in
account of the capital dividends on certain vivid policy measures. The other reason found
that the bank shares were sold to its own employees and the employees despite of
showing honest struggle could not achieved the high targets as compared to the Muslim
Commercial bank, which was sold to group of companies. It was only in 2004 that the
shares of the ABL were relocated to a group of companies.
The progress of the Muslim Commercial Bank was satisfactory even in the pre-
privatization era. Therefore, overall development in the indicators under study
remained satisfactory after the privatization act. The performance increased not in the
technical efficacy but in technological incursion in the environment of competition
client satisfaction. The sampled banks were privatized during 1996-1999 and were
compared in terms of their performance before and after their privatization.
The time series model is applied in order to examine the sequential trend of
privatization before and after the task was accomplished. The plot of the model shows
that the deposits and investment declined before privatization whereas less or more the
pre-tax profit, income and expenditure remained persistently in growth throughout the
pre-privatization period. On the contrary, in the post-privatization era, the deposits and
investment jerked to high level.
Page | 60
4.4 ResearchAnalysis:
Answer 1:
The total number of respondents was 75 out of which 64% of them were male and 36% of them
were female. The method that we used for sampling was non-probability random sampling,
which allowed us to randomly pick the respondent without any restrictions.
36%
64%
Gender
Female
Male
Page | 61
Answer 2:
The total numbers of respondents for the questionnaire were 75. To be able to better interpret the
results, we have divided the age groups for our questionnaire into three brackets which are from
20 to 35, 36 to 50 and 51 to 70 years.
The number of respondents that filled the questionnaire from the age bracket of 20 to 35 was i-e,
56%, from 36 to 50 the percentage was 32% and from 51 to 70 the percentage was 12%. High
percentage in the 20 to 35 age bracket, which is 56%, is observed because most of the employees
in the bank are from that age group. However, there are employees who belong to the age group
of 36 to 50. In addition to that, the age group of 51 to 70 had the least number of respondents
because the employees of this age group are mostly of higher designations.
56%32%
12%
Age Groups
20-35
36-50
51-70
Page | 62
Answer 3:
The total number of respondents was 75, amongst which 28% had studied till intermediate. The
major chunk which is 40% had done their bachelors, 24% of the respondents had studied till
masters and 8% of the respondents marked their education as others.
28%
40%
24%
8%
Education
Intermediate
Bachelors
Masters
Others
Page | 63
Answer 5
Out of the total respondents, 72% claimed that Generation Gap does exist at their workplace.
16% claimed that there is no such thing as Generation gap at their workplace, whereas 12% of
the total respondents said they don’t know whether there exists generational gap at their
workplace or not.
72%
16%
12%
Generation Gap exists at workplace?
Yes
No
Don't know
Page | 64
Answer 6:
When asked what they think are the main reasons behind disputes amongst generations, 48% of
the respondents ranked Intolerance as the most important reason behind generational disputes at
workplace. 22% of the respondents said that the main reason behind generation gap which leads
to disputes and conflicts at workplace is due to difference in perspectives amongst employees of
different age groups. Lack of respect for others was considered the main reason behind disputes
amongst generations at workplace by 18% of the respondents.12% of the respondents thought the
main reason behind disputes amongst different generations at workplace is acceptance vs. non
acceptance of rules, as it is believed that the new generation cares less about rules and
regulations as compared to the baby.
18%
48%
22%
12%
Main Reason for Disputes Amongst
Generations
Lack of Respect for others
Intolerance
Difference in Perspectives
Acceptance/Non Acceptance of
Rules
Page | 65
Answer 7:
When asked about do they think Decision making is among the main Conflicts and tensions
amongst generations at workplace, 72% of the respondents answered with a yes as they do
believe that generational disputes arise due to the different power of different generations
(depending upon their authority and designations). Members from Generation X and Generation
Y having low tolerance level feel that they are being controlled when they don’t have authority
to take decisions for themselves. This arises tensions and can lead to conflicts as well. 20% of
the respondents responded negatively and justified their answers with saying that decision
making has nothing to do with age group the person belongs to and completely resides with the
authority the designation given to an individual. The percentage that said they are unaware of
whether decision making is a conflict amongst different generations at workplace or not was 8%.
72%
20%
8%
Main conflicts and tensions amongst
Generations
1. Decision Making
Yes
No
Don't Know
Page | 66
Answer 7:
When asked about do they think Communication is among the main Conflicts and tensions
amongst generations at workplace, 76% of the respondents answered with a yes as they do
believe that generational disputes arise due to the Communication Gap. Communication Gap was
considered to be minimal between the ay Boomers and Generation X but a huge Communication
Gap exists between Generation Y and baby Boomers due to their different styles of
Communicating. This gap in communication leads to tensions and conflicts amongst different
generations at workplace. Though majority of respondents answered the question with a Yes,
16% of the respondents believed that Communication gap has nothing to do with age group the
person belongs to and completely depends upon individuality. The percentage that said they are
unaware of whether decision making is a conflict amongst different generations at workplace or
not was 8%.
76%
16%
8%
Main conflicts and tensions amongst
Generations
2. Communication
Yes
No
Don't Know
Page | 67
Answer 7:
When asked about do they think Difference in working styles is among the main Conflicts and
tensions amongst generations at workplace, 64 % of the respondents answered with a yes as they
do believe that generational disputes arise due to the different working styles of different
generations. The Baby Boomers are very professional and give their full determination to the
work whereas the members of Generation X are more inclined towards their families as they
have comparatively younger kids so their energy is not fully devoted towards professional life.
Talking about Generation Y employees, they want ore work life balance and are seemingly less
professional. This difference in working styles leads sometimes to conflicts and tensions
amongst generations at workplace. 32% of the respondents responded negatively and said that
working style has nothing to do with age group the person belongs to and should not be
considered as a conflict or tension amongst generations at workplace. The percentage that said
64%
32%
4%
Main Conflicts and Tensions Amongst
Generations
3. Different Working Styles
Yes
No
Don't Know
Page | 68
they are unaware of whether difference in working style is a conflict amongst different
generations at workplace or not was 4%.
Answer7:
When asked about do they think Attitude is among the main Conflicts and tensions amongst
generations at workplace, 84% of the respondents answered with a yes as they do believe that
generational disputes arise due to the difference in attitudes of different generations. This arises
tensions and can lead to conflicts as well. 12% of the respondents said attitude has nothing to do
with age group the person belongs to. The percentage that said they are unaware of whether
attitude is a conflict amongst different generations at workplace or not was 8%.
84%
12%
4%
Main Conflicts and Tensions Amongst
Generations
4. Attitude
Yes
No
Don't Know
Page | 69
Answer 7:
When asked about do they think Work Ethics is among the main Conflicts and tensions amongst
generations at workplace, 64% of the respondents answered with a yes as they do believe that
generational disputes arise due to the different power of different generations. The Baby
Boomers are believed to have strong work ethics as compared to Generation X and Generation
Y. 20% of the respondents responded negatively and said work ethics has nothing to do with age
group the person belongs to and it should be taken on individual basis. The percentage that said
they are unaware of whether ethics at work is a conflict amongst different generations at
workplace or not was 8%.
64%
28%
8%
Main Conflicts and Tensions Amongst
Generations
5. Work Ethics
Yes
No
Don't Know
Page | 70
Answer 8:
Baby Boomers (born 1946-1964)
Employees from each generation were asked to give their views about characteristics of their
generations. When asked about accepting new ideas, majority of respondents disagreed. When
asked about Loyalty to workplace, this generation according to respondents is the most loyal one.
They tend to be more devoted and dedicated to their workplace than any other generation.
3
4
8
6
4
6
5
1
3
5
0
1
2
3
4
5
6
7
8
9
accept new ideas flexibility loyalty to
workplace
accept new
challenges
adapt
technological
changes
Yes
No
Page | 71
Answer: 8
Generation X (born 1965-1980)
When Generation Y employees were asked about accepting new ideas, majority of respondents
agreed. When asked about Loyalty to workplace, the number of respondents who were positive
was high. This generation also accepts new challenges and can adapt to technological changes
easily.
18
12
21
13
15
6
12
3
11
9
0
5
10
15
20
25
acept new ideas flexibility loyalty to
workplace
accept new
challenges
adapt
technological
changes
Yes
No
Page | 72
Answer : 8
Generation Y (born 1981-2000)
When Generation Y employees were asked about these characteristics, the results show that
these employees are more open to technological changes and excepting new ideas. Loyalty to the
workplace is least as these respondents are in a continuous quest of getting higher salaries, so
they don’t bother leaving their organization for a better package.
36
21
13
6
37
6
21
29
16
5
0
5
10
15
20
25
30
35
40
acept new ideas flexibility loyalty to
workplace
accept new
challenges
adapt
technological
changes
Yes
No
Page | 73
Answer 9:
Baby Boomers (born 1946-1964)
When asked about the motivational factors related to work, the ratings given to retirement plan
by majority of the Baby Boomers was highest, which means that retirement plan is the most
important thing for this generation. Salary was given rating of 4 by the respondents, which eans
salary at this age matters a lot. Benefits were rated at 3, Personal recognition at fourth. Training
according to them was the least important factor as employees at this age are already having
great experience.
4
2
1
5
3
0
1
2
3
4
5
6
Salary Personal
Recognition
Training Retirement Plan Benefits
Page | 74
Answer 9:
Generation X (born 1965-1980)
When asked about the motivational factors related to work, the ratings given to Salary by
majority of Generation Y employees was highest, which means that Salary is the most important
thing for this generation. Benefits were given rating of 4 by the respondents, which means
Benefits at this age matter a lot. Personal Recognition was rated at 3, Training at fourth.
Retirement Plan according to them was the least important factor as employees at this age are not
much concerned about retirement.
5
3
2
1
4
0
1
2
3
4
5
6
Salary Personal
Recognition
Training Retirement Plan Benefits
Page | 75
Answer 9:
Generation Y (born 1981-2000)
When asked about the motivational factors related to work, the ratings given to Salary by majority of
Generation Y employees was highest, which means that Salary is the most important thing for this generation.
Personal Recognition was given rating of 4 by the respondents, which means Personal recognition is very
important for this generation. Training was rated at 3, as it is also very significant for the employees to learn
new things in this ever changing business world. Benefits were ranked at 2.Retirement Plan according to them
was the least important factor as employees at this age are not even thinking about retirement. Answer 10:
Answer: 10
5
4
3
1
2
0
1
2
3
4
5
6
Salary Personal
Recognition
Training Retirement Plan Benefits
Page | 76
Out of the total respondents, 60 % considered that Generation Gap is a major social problem where as 36% of
total respondents said that they do not consider Generation Gap as a social problem. 4% of the total
respondents said they don’t know whether Generational Gap is a social problem or not.
60%
36%
4%
Generation Gap is a Major Social Problem?
Yes
No
Don't Know
Page | 77
Answer 11:
When asked about whether Generation Gap can be diminished/ lessened or lowered, 56% of the total
respondents said yes whereas 36% of them responded in negative. 8% respondents were not sure.
56%
36%
8%
Can Generation Gap be
Diminished/Lessened/Lowered?
Yes
No
Don't Know
Page | 78
Answer 12:
When asked about what steps can be taken to diminish/lessen/lower Generation Gap at workplace 50% of the
respondents voted in favor of Social events. They feel that if Social Events are organized it can help
employees to interact in informal gatherings and this can aid in minimizing the Communication gap which is
present among generations at workplace. 19% of respondents said that generation gap can be eliminated to
some extent by giving training to the employees at workplace about the matter.31% respondents said that
when issues arise due to generation gap the best way to resolve them is discussion. Partied involved in dispute
or tension should be sat together and the matter should be discussed, this they believe can help in diminishing
Generation Gap at workplace to some extent.
50%
19%
31%
Steps that can be used to
Diminsh/Lessen/Lowergeneration Gap
Social Events
Training
Discussion
Page | 79
4.6 Chapter References
SWOT ANALYSIS:
 Fare, R., S. Grosskopf and W.L. Weber. 2004. The Effect of Risk Based Capital
Requirements on Profit Efficiency in Banking. Applied Economics. 36: 1731-43.
 Ahmed, T. and N. Bebe. 2007. Role of Commercial Banks in the Economic Development
of Pakistan. Proceedings of the Bangkok Conference 2007: Issues in Global Research in
Business and Economics. December 27-29, 2007, Bangkok, Thailand.
 Alam, Quamrul, A.M. (1989): “Privatization Policy and the
Problem of Industrial Development in Bangladesh”, Journal of
South Asian Studies, December.
 Ayadi, O.F., A.O. Adebayo and E. Omolehinwa. 1998. Bank Performance
 Measurement in a Developing Economy: An Application of Data Envelopment Analysis.
Managerial Finance. Vol. 24. No.7. pp. 5-16
 Baig, S.A. 1999. Banking System in Pakistan (Part – I).
Finance and Markets. Available at
http://www.pakistaneconomist.com/issue1999/issue49/f&m.htm (verified 24 Nov. 2006)
PEST ANALYSIS:
 Beck, J., R. Cull and A. Jerome. 2005. Bank Privatization and Performance Empirical
Evidence from Nigeria. World Bank Policy Research Working Paper 3511.
 Allen, L. and A. Rai. 1996. Operational efficiency in Banking: An international
Comparison. Journal of Banking and Finance 20: 655-72.
 Grigorian, D.A and V. Manole. 2002. Determinants of Commercial Bank Performance in
Transition: An Application of Data Envelopment Analysis. World Bank Policy Research
working Paper 2850.
Page | 80
 Elyasiani, E. and S.M. Mehdian. 1990. A Nonparametric Approach to
Measurement of Efficiency and Technological Change: The Case of Large U.S.
Commercial Banks. Journal of Financial Services Research. pp-157-68.
 Burki, A.A. and G.S.K. Niazi. 2003. The Effects of Privatization. Competition and
Regulation on Banking Efficiency in Pakistan, 1991-2000. CRC Conference on:
Regulatory Impact Assessment: Strengthening Regulation Policy and Practice. Chancellors
Conference Centre, 26-27 November, University of Manchester, UK.
 Carter, D.A. and J.E. MeNulty. 2005. Deregulation, Technological Change and The
Business – Lending Performance of Large and Small Banks. Journal Banking and Finance
20: II 13-30.
 Government of Pakistan 2001. Pakistan Economic Survey 2000-01, Economic
Advisor’swing, Finance Division, Islamabad.
 Cooper, W.W. and L.M. Seiford and J. Zhu. 2004. Data Envelopment Analysis History, Models
and Interpretations.P. 1-39 In: Cooper, W.W., L.M. Seiford and J. Zhu (ed.). 2004 Handbook on
Data Envelopment Analysis. Kluwer Academic Publishers. Boston. USA.
COMPARATIVE ANALYSIS OF ABL AND MCB:
 Demirguc-Kunt, A and H. Huizinga. 2004. Financial Structure and Bank Profitability. Pp
243-61. In Demirguc-Kunt, A and R. Levine (ed.) Financial Structure and Economic
Growth A Cross Country Comparison of Banks. Markets and Development. Pearson
Education. Delhi. India.
 Fare, R.S., S. Grosskopf and J. Logan. 1985b. The Relative Performance of Publicly
Owned and Privately Owned Electric Utilities. Journal of Public Economics. 26.89-106.
 Akhtar, M.A. 2002. X-efficiency Analysis of Commercial Banks in Pakistan: A
Preliminary Investigation. The Pakistan Development Review. Vol.41. No.4 pp. 567-80.
 Galagedera, D. U. A. and P. Edirisuriya. 2004. Performance of Indian Commercial
final thesis
final thesis
final thesis
final thesis
final thesis
final thesis
final thesis
final thesis
final thesis
final thesis
final thesis
final thesis
final thesis
final thesis
final thesis
final thesis
final thesis
final thesis
final thesis
final thesis
final thesis
final thesis
final thesis
final thesis
final thesis
final thesis
final thesis
final thesis
final thesis
final thesis
final thesis
final thesis
final thesis
final thesis
final thesis
final thesis
final thesis
final thesis
final thesis
final thesis
final thesis
final thesis
final thesis
final thesis
final thesis
final thesis
final thesis
final thesis
final thesis
final thesis
final thesis
final thesis
final thesis
final thesis
final thesis
final thesis
final thesis
final thesis
final thesis
final thesis
final thesis
final thesis
final thesis
final thesis
final thesis
final thesis
final thesis
final thesis

More Related Content

Viewers also liked

Comptia Exam Diego Cardenas
Comptia Exam Diego CardenasComptia Exam Diego Cardenas
Comptia Exam Diego Cardenasdiegofcardenas
 
360 Degree Evaluation Form FINAL
360 Degree Evaluation Form FINAL360 Degree Evaluation Form FINAL
360 Degree Evaluation Form FINALAmun Arif
 
Navigating the workplace generation gap in transportation
Navigating the workplace generation gap in transportationNavigating the workplace generation gap in transportation
Navigating the workplace generation gap in transportationHNI Risk Services
 
Generation gap at workplace in todays world
Generation gap at workplace in todays worldGeneration gap at workplace in todays world
Generation gap at workplace in todays worldKartik Chauhan
 
Lesson 4 Bridging The Generation Gap
Lesson 4 Bridging The Generation GapLesson 4 Bridging The Generation Gap
Lesson 4 Bridging The Generation GapElaisa Moina
 
Bridging the Generation Gap in the Workplace
Bridging the Generation Gap in the WorkplaceBridging the Generation Gap in the Workplace
Bridging the Generation Gap in the Workplacebeatyaall
 

Viewers also liked (8)

report
reportreport
report
 
Certificate
CertificateCertificate
Certificate
 
Comptia Exam Diego Cardenas
Comptia Exam Diego CardenasComptia Exam Diego Cardenas
Comptia Exam Diego Cardenas
 
360 Degree Evaluation Form FINAL
360 Degree Evaluation Form FINAL360 Degree Evaluation Form FINAL
360 Degree Evaluation Form FINAL
 
Navigating the workplace generation gap in transportation
Navigating the workplace generation gap in transportationNavigating the workplace generation gap in transportation
Navigating the workplace generation gap in transportation
 
Generation gap at workplace in todays world
Generation gap at workplace in todays worldGeneration gap at workplace in todays world
Generation gap at workplace in todays world
 
Lesson 4 Bridging The Generation Gap
Lesson 4 Bridging The Generation GapLesson 4 Bridging The Generation Gap
Lesson 4 Bridging The Generation Gap
 
Bridging the Generation Gap in the Workplace
Bridging the Generation Gap in the WorkplaceBridging the Generation Gap in the Workplace
Bridging the Generation Gap in the Workplace
 

Similar to final thesis

Driving Staff Engagement
Driving Staff EngagementDriving Staff Engagement
Driving Staff EngagementOlivier Serrat
 
gen-y-guide-01-14
gen-y-guide-01-14gen-y-guide-01-14
gen-y-guide-01-14Alex Ridley
 
Simpler Way: Future of Work Study
Simpler Way: Future of Work StudySimpler Way: Future of Work Study
Simpler Way: Future of Work StudyArik Rizer
 
PA Career Guide 2011-12
PA Career Guide 2011-12PA Career Guide 2011-12
PA Career Guide 2011-12PAPartners
 
25925524.pdf
25925524.pdf25925524.pdf
25925524.pdfjdgf3
 
Frederick Herzberg’s two factor theory - to what extent is money a motivator?
Frederick Herzberg’s two factor theory - to what extent is money a motivator? Frederick Herzberg’s two factor theory - to what extent is money a motivator?
Frederick Herzberg’s two factor theory - to what extent is money a motivator? Zil Shah
 
project report employee welfare (mithun kumar sheel
project report employee welfare (mithun kumar sheelproject report employee welfare (mithun kumar sheel
project report employee welfare (mithun kumar sheelmithun sheel
 
Career introduction to students between high school and college
Career introduction to students between high school and collegeCareer introduction to students between high school and college
Career introduction to students between high school and collegePrakash B
 
Brackett EDP Research Final 6-18-14
Brackett EDP Research Final 6-18-14Brackett EDP Research Final 6-18-14
Brackett EDP Research Final 6-18-14Derby Brackett
 
Strategies for Informed Decision Making.pptx
Strategies for Informed Decision Making.pptxStrategies for Informed Decision Making.pptx
Strategies for Informed Decision Making.pptxBimal Raturi
 
ORGANIZATIONAL CULTURE.pptx
ORGANIZATIONAL CULTURE.pptxORGANIZATIONAL CULTURE.pptx
ORGANIZATIONAL CULTURE.pptxYangTiemsem
 
Corporate Governance - Coca Cola
Corporate Governance - Coca ColaCorporate Governance - Coca Cola
Corporate Governance - Coca ColaZara Siddiqui
 
FINANCIAL PLANNING OF AN INDIVIDUAL
FINANCIAL PLANNING OF AN INDIVIDUALFINANCIAL PLANNING OF AN INDIVIDUAL
FINANCIAL PLANNING OF AN INDIVIDUALAnjaliSingh748
 
Future of Work: 2015-2020: Unleashing You. Making the Future Work. Now.
Future of Work: 2015-2020: Unleashing You. Making the Future Work. Now.Future of Work: 2015-2020: Unleashing You. Making the Future Work. Now.
Future of Work: 2015-2020: Unleashing You. Making the Future Work. Now.Bill Jensen
 
Do You Really Understand Diversity And Inclusion?
Do You Really Understand Diversity And Inclusion?Do You Really Understand Diversity And Inclusion?
Do You Really Understand Diversity And Inclusion?Roman 3
 
HHW-CurriculumUpdated
HHW-CurriculumUpdatedHHW-CurriculumUpdated
HHW-CurriculumUpdatedTitusAsh
 
Employee engagement can do or will do
Employee engagement can do or will doEmployee engagement can do or will do
Employee engagement can do or will doNabduan Duangmanee
 
Leadership in a VUCA World - AICPA PSTECH 2016
Leadership in a VUCA World - AICPA PSTECH 2016Leadership in a VUCA World - AICPA PSTECH 2016
Leadership in a VUCA World - AICPA PSTECH 2016Tom Hood, CPA,CITP,CGMA
 
Ryerson 2015-2016 guide
Ryerson 2015-2016 guideRyerson 2015-2016 guide
Ryerson 2015-2016 guideJesse Gerva
 

Similar to final thesis (20)

Driving Staff Engagement
Driving Staff EngagementDriving Staff Engagement
Driving Staff Engagement
 
gen-y-guide-01-14
gen-y-guide-01-14gen-y-guide-01-14
gen-y-guide-01-14
 
Simpler Way: Future of Work Study
Simpler Way: Future of Work StudySimpler Way: Future of Work Study
Simpler Way: Future of Work Study
 
PA Career Guide 2011-12
PA Career Guide 2011-12PA Career Guide 2011-12
PA Career Guide 2011-12
 
25925524.pdf
25925524.pdf25925524.pdf
25925524.pdf
 
Frederick Herzberg’s two factor theory - to what extent is money a motivator?
Frederick Herzberg’s two factor theory - to what extent is money a motivator? Frederick Herzberg’s two factor theory - to what extent is money a motivator?
Frederick Herzberg’s two factor theory - to what extent is money a motivator?
 
project report employee welfare (mithun kumar sheel
project report employee welfare (mithun kumar sheelproject report employee welfare (mithun kumar sheel
project report employee welfare (mithun kumar sheel
 
Career introduction to students between high school and college
Career introduction to students between high school and collegeCareer introduction to students between high school and college
Career introduction to students between high school and college
 
Brackett EDP Research Final 6-18-14
Brackett EDP Research Final 6-18-14Brackett EDP Research Final 6-18-14
Brackett EDP Research Final 6-18-14
 
Strategies for Informed Decision Making.pptx
Strategies for Informed Decision Making.pptxStrategies for Informed Decision Making.pptx
Strategies for Informed Decision Making.pptx
 
ORGANIZATIONAL CULTURE.pptx
ORGANIZATIONAL CULTURE.pptxORGANIZATIONAL CULTURE.pptx
ORGANIZATIONAL CULTURE.pptx
 
Corporate Governance - Coca Cola
Corporate Governance - Coca ColaCorporate Governance - Coca Cola
Corporate Governance - Coca Cola
 
FINANCIAL PLANNING OF AN INDIVIDUAL
FINANCIAL PLANNING OF AN INDIVIDUALFINANCIAL PLANNING OF AN INDIVIDUAL
FINANCIAL PLANNING OF AN INDIVIDUAL
 
Future of Work: 2015-2020: Unleashing You. Making the Future Work. Now.
Future of Work: 2015-2020: Unleashing You. Making the Future Work. Now.Future of Work: 2015-2020: Unleashing You. Making the Future Work. Now.
Future of Work: 2015-2020: Unleashing You. Making the Future Work. Now.
 
Do You Really Understand Diversity And Inclusion?
Do You Really Understand Diversity And Inclusion?Do You Really Understand Diversity And Inclusion?
Do You Really Understand Diversity And Inclusion?
 
HHW-CurriculumUpdated
HHW-CurriculumUpdatedHHW-CurriculumUpdated
HHW-CurriculumUpdated
 
Employee engagement can do or will do
Employee engagement can do or will doEmployee engagement can do or will do
Employee engagement can do or will do
 
Leadership in a VUCA World - AICPA PSTECH 2016
Leadership in a VUCA World - AICPA PSTECH 2016Leadership in a VUCA World - AICPA PSTECH 2016
Leadership in a VUCA World - AICPA PSTECH 2016
 
Vietnam gen y 2014 launch combined
Vietnam gen y 2014 launch   combinedVietnam gen y 2014 launch   combined
Vietnam gen y 2014 launch combined
 
Ryerson 2015-2016 guide
Ryerson 2015-2016 guideRyerson 2015-2016 guide
Ryerson 2015-2016 guide
 

final thesis

  • 1. Page | 1 PROJECT REPORT Generation Gap at workplace; a case study of Allied Bank SUBMITTED TO: PROF. Dr Ali Askari Course Supervisor SUBMITTED BY: AMUN ARIF (03) SABA SHAUKAT (44) MARIJ ZAFAR (57) COURSE: PROJECT REPORT CLASS: BBA (8TH SEMESTER) KARACHI UNIVERSITY BUSINESS SCHOOL UNIVERSITY OF KARACHI DATE OF SUBMISSION: 16th November 2015
  • 2. Page | 2 ACKNOWLEDGEMENT We owe many thanks to a great many people who helped and supported us during the completion of this project. My deepest thanks to our Course Incharge, Professor Dr. Ali Askari, for giving us an opportunity to do such work and then for guiding and correcting the various documents of the report with attention and care. He has given his precious time to go through the project and make necessary correction as and when needed. We express our thanks to Karachi University Business School, University of Karachi for extending its support for granting us permissions and letters for the report. Also, we would like to thank all those links and contacts who helped us gathering up the data and making it an ease for us in completing this research project.
  • 3. Page | 3 EXECUTIVE SUMMARY The main aim of this research is to find out if generation gap exists at workplaces; to determine different characteristics which are found in the generations: the veterans, the baby boomers, the generation X, and the generation Y; and to compare different motivational factors related to work which are required by the employees who belong to these four age groups, respectively. This research was conducted on a quantitative basis, questionnaire based survey method was used to gather responses from 75 employees who belonged to Allied Bank. The results are analyzed by making pie charts. The findings revealed that generation gap exists at workplaces. In the Generation Y group, the highest rated characteristics are: inflexible, demand personal growth, competitive, like challenges and easily accept new ideas. In the Generation X group, the highest rated characteristics are: demand family and work life balance, loyalty to work place, respectful, self-reliant and highly committed to work. In the Baby Boomers, the characteristics with the highest ratings are: demand family and work life balance, loyalty to workplace, respectful, hardworking and highly committed to work. In the motivational factors that are required by the employees, training and retirement plan were the most highly rated ones; training was highly rated for the Generation X group while retirement plan was highly rated for the Baby Boomers.
  • 4. Page | 4 TABLE OF CONTENT S.no TOPIC Pg.no II Acknowledgement………………………………………………………………………………………………………II III Executive summary……………………………………………………………………………………………………..III CHAPTER 1: INTRODUCTION………………………………………………………………………………………..………………1 1.1 Background………………………………………………………………………………………………………………..2 1.2 ProblemStatement………………………………………………………….………………………………………..3 1.3ResearchObjectives……………………………………………………………………………………………………4 1.4 ResearchQuestions……………………………………………………………………………………………………4 1.5 Purpose of the Study………………………………………………………………………………………………….4 1.6 Definitions ………………………………………………………………………………………………………………5 1.7 Structure of the thesis………………………………………………………………………………………………7 1.8 ChapterReferences………………………………………………………………………………………………….8 CHAPTER 2: LITERATURE REVIEW……………………………………….……………………………………………………..9 2.1 Four generationsof Employees……………………………………….…………………………………......10 2.1.1 The Traditional generation……………………………………………………………….10 2.1.2 The Baby Boomgeneration………………………………………………………………11 2.1.3 GenerationX…………………………………………………………………………………….13 2.1.4 GenerationY…………………………………………………………………………………….14 2.2 Possible Generational DifferencesAndSimilarities…………………………………….15 2.2.1 Attitudestowardswork…………………………………………..……………………….15 2.2.2 Loyaltytowardsthe employer……………………………………………………………………….17
  • 5. Page | 5 2.2.3 Attitudesregardingrespectandauthority…………………………………………………….20 2.2.4 Desire fora betterwork/life balance……………………………………………………………21 2.2.5 Attitudestowardssupervision……………………………………………………………………..22 2.2.6 Othersourcesof differences………………………………………………………………………..22 2.3 LeadershipStyles…………………………………………………………………………………………………..23 2.4 DifferencesBetweenGenerations………………………………….…………................26 2.5 MotivationAndTrainingOf Generations………………………….………………………27 CHAPTER 3: RESEARCH METHODOLOGY……………………………………………………………………………….28 3.1 ResearchApproach……………….........…………………………………………………………………..29 3.2 ResearchPurpose……………………………………………………………………………………………….30 3.3 Research Design……………………………………………………………………………………………………30 3.4 ResearchMethodology…………………………………………………………………………………………30 3.5 Sample Size andTargetPopulation……………………………………………………………………….31 3.6 SamplingTechnique……………………………………………………………………………………………..31 3.7 Data Source…………………..………………………………………………………………………………………32 3.8 SamplingUnit..………………………………………………………………………………………………………32 3.9 Data CollectionMethod…………………………………………………………………………………………32 3.10 InstrumentforData Collection…………………………………………………………………………….33 3.11 Statistical Technique/Tool…………………….…………………………………………………………….33 3.12 Hypothesis………………………………………………………………………………………………………….33 3.13 Ethical Considerations…………………………………………………………………………………………33 3.14 Reliability…………………………………………………………………………………………………………….34 3.15 Validity…………………………………………………………………………………………………………………35 3.16 Limitations……………………………………………………………………………………………………………36
  • 6. Page | 6 3.17 Timescale……………………………………………………………………………………………………………..37 3.18 ChapterReferences……………………………………………………………………………………………..38 CHAPTER 4: MARKET RESEARCH AND ANALYSIS……………………………………………………………………..39 4.1 SWOT Analysis……………………………………………………………………………………………………….40 4.1.1 Strengths……………………………………………………………………………………………40 4.1.2 Weaknesses……………………………………………………………………………………….41 4.1.3 Opportunities…………………………………………………………………………………….42 4.1.4 Threats………………………………………………………………………………………………42 4.2 PEST Analysis………………………………………………………………………………………………………..43 4.2.1 Political……………………………………………………………………………………………..43 4.2.2 Economical………………………………………………………………………………………..44 4.2.3 Social…………………………………………………………………………………………………44 4.2.4 Technology……………………………………………………………………………………….44 4.3 Comparative Analysisof ABLandMCB………………………………………………………………….45 4.4 Conclusion……………………………………………………………………………………………………………50 4.5 Analysisof the Research……………………………………………………………………………………….54 4.6 ChapterReferences……………………………………………………………………………………………..72 CHAPTER 5: FINANCIALANALYSIS………………………………………………………………………………………….75 5.1 UnconsolidatedStatementof Financial Position…………………………………………………..76 5.2 UnconsolidatedProfitandLossAccount………………………………………………………………78 5.3 UnconsolidatedStatementof CashFlow………………………………………………………………79 5.4 Income Statement………………………………………………………………………………………………..81 5.5 Balance Sheet……………………………………………………………………………………………………….81 5.6 RatiosAnalysis……………………………………………………………………………………………………..81
  • 7. Page | 7 5.7 Interpretation………………………………………………………………………………………………………82 5.8 ProjectCostEstimation…………………………………………………………………………………………82 5.9 Chapterreferences……………………………………………………………………………………………….83 CHAPTER 6: ORGANIZATIONAND MANAGEMENT…………………………………………………………..…….84 6.1 CompanyInformation…………………………………………………………………………………………..85 6.2 Profile of Directors………………………………………………………………………………………………..86 6.3 Organogram………………………………………………………………………………………………………….90 6.4 Branch Structure…………………………………………………………………………………………………..92 6.5 Corporate whistle blowingstrategy………………………………………………………………………93 6.6 ChapterReferences………………………………………………………………………………………………102 CHAPTER 7: CONCLUSION………………………………………………………………………………………………………103 7.1 Deductions……………………………………………………………………………………………………………104 7.2 Myths AboutOlderWorkers…………………………………………………………………………………107 7.3 Bestpracticesfor leadingandmanagingintergenerational workforce…………………108 7.4 ChapterReferences………………………………………………………………………………………………111 CHAPTER 8: RECOMMENDATIONS…………………………………………………………………………………..……..112 8.1 How to Bridge GenerationalDifferencesatworkplace………………………………………….113 8.2 RecommendationsforHumanResource Managers………………………………………………114 8.3 Recommendationsforfuture study………………………………………………………………………115 CHAPTER 9: REFERENCES…………………………………………………………………………………………………………116 CHAPTER 10: BIBLIOGRAPHY…………………………………………………………………………………………………126 APPENDIX- QUESTIONNAIRE…………………………………………..………………….………………………………….137
  • 8. Page | 8 CHAPTER 1 INTRODUCTION
  • 9. Page | 9 CHAPTER 1: INTRODUCTION 1.1 BACKGROUND: Allied Bank is a commercial bank in Pakistan. Allied Bank, with its registered Offices in Karachi and Lahore, is one of the largest banks within the country with over 1000 branches, connected to an online network. It was the first Muslim bank established in Pakistan before independence (1942) with the name of Australasia Bank. It was named as Allied Bank of Pakistan from Australasia Bank Limited in 1974, and Sarhad Bank Ltd, Lahore Commercial Bank Ltd and Pak Bank Ltd were also merged in it. Generation Gaps in the Workplace There are four distinct generations in the workplace, each with its own worldview and its own work ethic. Some are fiercely loyal to the company, while others just want a steady paycheck. Here is a quick breakdown of each generation's attitude toward work, management style and preferred methods of communication: • Veterans (born 1922-1945) When it comes to work, the company comes first. The veteran believes in starting from the bottom, paying dues, and working your way up through experience and seniority. The best education is on-the-job training. The veteran's management style is firm and direct, and he or she prefers face-to-face or phone communication. • Baby Boomers (born 1946-1964) Baby boomers have a strong work ethic, though they may not be loyal to one company. They believe strongly in education. When it comes to management, boomers are all about meetings; employees should feel part of a team and consider annual progress reports a great source of feedback. Boomers are available on phone 24/7. They
  • 10. Page | 10 always check and leave voicemail messages, check e-mail a couple times a day and always respond by the end of the day (it's only polite). • Generation X (born 1965-1980) Education and creativity count for something with Generation X; you shouldn't have to start from the bottom even if you have fresh ideas. Generation Xers have never understood why they should care about company "traditions." They work hard for the company, but wouldn't hesitate to switch jobs if a better offer comes along. Work-life balance is important to them. Generation Xers believe that people will produce the best results if they're given the freedom to be creative. They like explaining the reasoning behind their decisions; this motivates employees in a way that they can understand. When it comes to communication, e-mail is the king. • Generation Y (born 1981-2000) Generation Y members believe they have some great ideas (at least that's what they've been told), so they just want to do their thing and the results will follow. They like their work places just fine -- until they get bored. Working from home is as good as the office as long as work gets done. Management is a snap -- everyone simply checks in with the online project management tool and updates his or her status. Texting is best if you want to get in touch with a Generation Y member. These people may never check voicemails -- in fact, they're perfectly OK with never meeting a colleague in person. 1.2 PROBLEM STATEMENT: A generation gap in the workplace can make workers both young and old feel inferior, as well as hamper productivity and teamwork. Differences between generations can be seen in work ethics, habits and communication styles. Younger workers might fear not being taken seriously by their older colleagues, while older workers might fear that their experience is not valued but replaced by workers with knowledge of more current technology. However, members of each generation
  • 11. Page | 11 can close the gap between them if they're willing to meet one another halfway. There is a generation gap between all the generations that impacts today’s work environment. The impact is a negative one because it decreases the efficiency of the work environment. To solve the problems of inefficiency within the generation gap, leaders in the workplace must understand the differences between all the generations and know how to deal with them. 1.3 RESEARCH OBJECTIVES 1. To identify whether generation gap exist in the workplace or not 2. To compare the characteristics of different age group. 3. To identify the areas of conflicts among different age groups 1.4 RESEARCH QUESTIONS 1) Does generation gap exist in the workplace or not? 2) What are the characteristics of different age groups? 3) Compare the characteristics of all the age groups 4) What are the issues that arise between generations? 1.5 PURPOSE OF THE STUDY This research is conducted to identify different characteristics and motivational factors of young, middle and, old generations at workplace and to find out the reasons of conflict among three generations. 1.6 DEFINITIONS Generation Gap
  • 12. Page | 12 The difference in attitudes and beliefs among the two generations. (English Language Dictionary of American Heritage) o The years separating the preceding generation from the following generation especially when characterized by different attitudes and perceptions. (Collin‟s Dictionary). o Generations representing differences in viewpoints, expectations and habits because of diverse and distinct life experiences. (X and Y: THE IMPACT OF THE GAP) Veterans Veterans are considered among the most loyal workers. They are highly dedicated and the most risk averse. Their values were shaped by the Great Depression, World War II, and the postwar boom years. Veterans possess a strong commitment to teamwork and collaboration and have high regard for developing interpersonal communications skills. Veterans now consist of the most affluent elderly population in history due to their willingness to conserve and save after recovering from the financial impact of the postwar era. Baby Boomers Boomers are the first generation to actively declare a higher priority for work over personal life. They generally mistrust authority and large systems. Their values were shaped primarily by a rise in civil rights activism, Viet Nam, and inflation. They are more optimistic and open to change than the prior generation, but they are also responsible for the “Me Generation,” with its pursuit of personal satisfaction, which often shows up as a sense of entitlement in today’s work force.
  • 13. Page | 13 Because of the fall of the dot.com marketplace, retirement savings of Baby Boomers were destroyed and many now find themselves having to work longer than they had planned. Generation Xers Generation Xers are often considered the “time-wasting” generation. They naturally question authority about the figures and are responsible for creating the work/life balance concept. Born in a time of declining population growth, this generation of workers possesses strong technical skills and is more independent than the prior generations. Because Gen Xers place a lower priority on work, many company leaders from the Baby Boomer generation assume these workers are not as dedicated; however, Gen Xers are willing to develop their skill sets and take on challenges and are perceived as very adaptive to job instability in the post-downsizing environment. Millennials or Generation Ys This group is the first global-centric generation, because of the rapid growth of the Internet and an increase in global terrorism in their era. They are among the toughest individuals in directing change. Generational dissonance Negative attitude, beliefs and feelings about people not belonging from same generation based merely on generational difference. (X and Y: THE IMPACT OF THE GAP) Organizational setting
  • 14. Page | 14 It is the organizational environment in which the employees work. (X and Y: THE IMPACT OF THE GAP) 1.7 STRUCTURE OF THE THESIS: This project report is divided into ten chapters and an appendix section. The first chapter provides an introduction to the topic chosen, the significance of the study, its aims & objectives and the purpose for the study. It also includes the definitions of the variables. Chapter two presents a comprehensive review of the various literatures. The third chapter deals with the methodologies used dealing with the analysis of the data presented, the validation strategies, the ethical issues and time needed to complete this research. Chapter four presents the analysis regarding the essence of the study, the topic chosen, the literatures provided and the importance of the study. Chapter five consists of the financial analysis of Allied Bnak and the cost incurred in completing this project. Chapter 6 describes the organizational structure of Allied Bank and its management. Chapter seven concludes the research by highlighting the results that have been found out through analysis. Chapter 8 presents the recommendations that will help in future research on this topic. Chapter nine and ten includes the references and bibliography. There is an appendix section that contains the questionnaire.
  • 15. Page | 15 1.8 CHAPTER REFERENCES BACKGROUND:  https://www.abl.com/ (information of Allied Bank)  Raines, C. (2003). Connecting generations - The sourcebook for a new workplace.Menlo Park,CA: Crisp Publications. (Introduction of generations)  ASAE: Uncommon Threads: Mending the Generation Gap at Work (Four generations) DEFINITIONS:  Jennings, L. (2000, Mar/April). Trends in the Multigenerational Workplace. Futurist, 34(2), 60-61
  • 16. Page | 16 CHAPTER 2 REVIEW OF LITERATURE
  • 17. Page | 17 REVIEW OF LITERATURE AUTHOR: Zemke, R., Raines, C., & Filipczak, B. (1999). TITLE: Generations at work: Managing the clash of veterans, boomers, Xers, and nexters in your workplace. New York: AMACOM. A generation being defined as an identifiable group that shares birth years, age, location, and significant life events at critical developmental stages, divided by five to seven years into: the first wave, core group, and last wave. There are at least two views regarding generational differences in the workplace. The first presumes that shared events influence and defines each generation while individuals in different generations are diverse; they nevertheless share certain thoughts, values, and behaviors because of the shared events. Furthermore, these values, reactions, and behaviors presumably differ across generations. The alternative view assumes that although there might be variations throughout an employee’s life cycle or career stage, ultimately employees may be “generic” in what they want from their job and bifurcation of employees by generations may be misguided. In this report, the four generations of workers are described, generational differences and similarities are identified, and implications for employers are discussed. 2.1 FOUR GENERATIONS OF EMPLOYEES AUTHOR: Niemiec, S. (2000) TITLE: Finding common ground for all ages. Security Distributing and Marketing, pg. 30. 2.1.1 The Traditional generation The Traditional generation is the oldest generation in the workplace, although most are now retired. Also known as the veterans, the Silents, the Silent generation, the matures, the
  • 18. Page | 18 greatest generation. This generation includes individuals born before 1945, and some sources place the earliest birth year to 1922. Members of this generation were influenced by the great depression and World War II among other events and have been described as being conservative and disciplined, as having a sense of obligation, and as observing economic limitation. The National Oceanographic and Atmospheric Association Office of Diversity (2006) characterized members of this generation as the private, silent generation, who believe in paying their dues, for whom their word is their bond, who prefer formality, have a great deal of respect for authority, like social order and who love their things and tend to hoard stuff. Members of this generation have also been characterized as loyal workers, highly dedicated, averse to risk and strongly committed toward teamwork and collaboration. They have also been described as having a high regard for developing communication skills, and as the most affluent elderly population in the U.S., due to their tendency to save and conserve. At work, they are presumed to show consistency and uniformity, seek out technological advancements, be past-oriented, display command-and- control leadership, and prefer hierarchical organizational structures. They are likely to continue to view horizontal structures in a hierarchical way. They are also likely to be stable, detail oriented, thorough, loyal, and hardworking, although they may be not skilled with ambiguity and change management, reluctant to blame the system, uncomfortable with conflict, and controlled when they disagree. 2.1.2 The Baby Boom generation AUTHOR: O’Bannon, G. (2001).
  • 19. Page | 19 TITLE: Managing our future: The generation X factor. Public Personnel Management, pg. 30, pg. 95–109 Most sources identify Baby Boomers as people born between 1943 and 1965. This generation is referred to as the Baby Boom, because of the extra seventeen million babies born during that period relative to previous census figures. It had the largest impact on our society due to its size — roughly 78 million- and the period during which it came of age. Boomers witnessed and participated in the political and social turmoil of their time: the Vietnam War, the civil rights riots, the Kennedy and King assassinations. Boomers were raised to respect authority figures, but as they witnessed their weakness was “trust anyone over 30.” They grew up in an era of “prosperity and optimism and strengthened by the sense that they are a special generation capable of changing the world, have dependency in work with self-worth, contribution and personal fulfillment”. The oldest Baby Boomers turned 62 in 2008, and as a whole, this generation is now in the mid to late part of their careers. The totality of this generation will reach the traditional retirement age of 65 within the next 25 years. AUTHOR: Glass, 2007; TITLE: The National Oceanographic and Atmospheric Association Office of Diversity, 2006; Zemke et al., 2000 Boomers have been characterized as individuals who believe that hard work and sacrifice are the price to pay for success. They started the workaholic trend, believed in paying their dues and step-by- step promotion. They also like teamwork, collaboration and group decision-making, are competitive and do believe in loyalty toward their employers. Boomers are often confident task
  • 20. Page | 20 completers and may be insulted by constant feedback, although they want their achievement to be recognized. Some have described them as being more process- than result-oriented, although they have also been characterized as being goal-oriented. Many are accepting diversity. They are liberal, and conflict avoidant. They value health and wellness as well as personal growth and personal satisfaction, and seek job security. Finally, Boomers have been described as having a sense of entitlement, and as being good at relationships, reluctant to go against peers and judgments of others who do not see things their way. They also thrive on the possibility for change, and will fight for a cause even though they do not like problems. They value the chain of command, may be technically challenged and expect authority. 2.1.3 Generation X AUTHOR: Karp, H., Fuller, C., & Sirias, D. (2002). TITLE: Bridging the boomer Xer gap. Creating authentic teams for high performance at work. Palo Alto, CA: DaviesBlack Publishing. In a study about Generation X, the U.S. Census Bureau defined this segment of the population as consisting of individuals born between 1968 and 1979. However, the upper limit of Generation X in some cases has been as high as 1982, while the lower limit has been as low as 1963. This generation was also called the baby bust generation, because of its small size relative to the generation that preceded it, the Baby Boom generation. Members of Generation X are the children of older boomers, who grew up in a period of financial and societal insecurity. They witnessed their parents get laid off. They grew up with a stagnant job market, corporate downsizing, and limited wage mobility, and are the first individuals predicted to earn less than their parents did. They have grown up in homes where both parents worked, or in single
  • 21. Page | 21 parent household because of high divorce rates, and as such, became latchkey kids who were forced to fend for themselves. They were influenced by MTV, AIDS and worldwide competition and are adapted to receiving instant feedback from playing computer and video games. They aspire more than previous generations to achieve a balance between work and life. They are more independent, autonomous and self-reliant than previous generations having grown up as latchkey kids. They are not overly loyal to their employers although they have strong feelings of loyalty towards their family and friends. They value continuous learning and skill development. They have strong technical skills and are result-focused. Xers naturally question authority about the figures and are not frightened by them. Money does not necessarily motivate members of this generation, but the absence of money might lead them to lose motivation. They like to receive feedback, are adaptable to change and prefer flexible schedules. They can tolerate work as long as it is fun. They are entrepreneurial, practical, and creative. Although they are individualistic, they may also like teamwork more than boomers. 2.1.4 Generation Y AUTHOR:Crampton, S. M., & Hodge, J. W. (2006). TITLE: The supervisor and generational differences. Proceedings of the Academy of Organizational Culture, Communications and Conflict, pg. 11, pg. 19–22 The lower limit for Generation Y may be as low as 1978, while the upper limit may be as high as 2002, depending on the source. Members of Generation Y may include individuals born between 1980 and 2002. The label associated with this generation is not yet finalized. Current labels include Millenials, Nexters, Generation www, and the Digital generation, Generation E,
  • 22. Page | 22 Echo Boomers, N-Gens and the Net Generation. Members of the generation have labeled themselves as the Non-Nuclear Family generation, the NothingIs-Sacred Generation, the Wannabees, the Feel-Good Generation, Cyberkids, the Do-or-Die Generation, and the Searching- for-an-Identity Generation. This generation has been shaped by computers, and dramatic technological advances. One of the most frequently reported characteristics of this generation is their comfort with technology. In general, Generation Y shares many of the characteristics of Xers. They are supposed to value team work and collective action, embrace diversity, be optimistic, and be adaptable to change. Furthermore, they seek flexibility, are independent, desire a more balanced life, are multi-talented, and are the most highly educated generation. They also value training. They have been characterized as demanding, and as the most confident generation. Like Xers, they are also supposed to be entrepreneurial, and as being less process focused. 2.2 POSSIBLE GENERATIONAL DIFFERENCES AND SIMILARITIES AUTHOR: (The National Oceanographic and Atmospheric Office of Diversity, 2006) TITLE: Tips to improve the interaction among the generations: Traditionalists, boomers, X’ers and nexters 2.2.1 Attitudes towards work The perceived decline in work ethic is perhaps one of the major contributors of generational conflicts in the workplace. Generation X for instance, has been labeled the ‘slacker’ generation, and employers complain that younger workers are uncommitted to their jobs and work only the required hours and little more. Conversely, Boomers may be workaholics and reportedly started the trend while Traditionals have been characterized as the most hardworking
  • 23. Page | 23 generation. Indeed, the prevailing stereotype is that younger workers do not work as hard as older workers do. Whether the younger generations do not work as hard as previous ones is debatable. A cross-sectional comparison of 27 to 40 year olds versus 41 to 65 year olds in 1974 and 1999 indicated that both age groups felt that it was less important that a worker feel a sense of pride in one’s work in 1999 than in 1974. In both age groups, work values among managers declined between 1974 and 1999. Both age groups were also less likely in 1999 to indicate that they believed that how a person did his or her job was indicative of this individual’s worth. In 1999, both age groups were also less likely to believe that work should be an important part of life or working hard made one a better person. Furthermore, older employees had a less idealized view of work than younger workers did. Indeed, it was postulated that after witnessing the lack of employer loyalty toward employees, the latter consequently developed a less idealized view of work. Other sources of evidence do not support the claim that there is a decline in work ethics among younger generations. For instance, Tang and Tzeng (1992) found that as age increased, reported work ethic decreased, indicating that younger workers reported higher work ethics than older workers. Similarly, the 1998 General Social Survey, National Opinion Research Center Survey indicated that 44% of those aged 18 to 24 indicated that they would choose to spend more time at work, compared to 23% of workers of all ages, indicating that most younger workers were willing to try to work more, more so than the average worker. However, these findings are not very recent. The possibility that the perceptions about the decline in work ethics is accurate, but
  • 24. Page | 24 simply unsubstantiated by research due to lack of research in the area therefore remains. Nevertheless, numerous factors beyond generational factors affect the work ethics of employees. For instance, work ethic varies with education level, whether a person works full-time or part-time, income level and marital status. The lower the level of education of an employee, the higher their work ethic has been found to be. People with full-time jobs were found to be less likely to endorse a protestant work ethic than people with part-time jobs; and people with low incomes and those who were married tended to report stronger protestant work ethic. The perception of how hard one works may also be associated with how individuals themselves approach tasks as well. For instance, boomers have often been characterized as being process- oriented, while younger generations, as being results-focused, irrespective of where and when the task is done. While younger workers focus on high productivity, they may be happier with the flexibility of completing a task at their own pace and managing their own time, as long as they get the job done right and by the deadline. Current empirical evidence does not address this particular point however. AUTHOR: (The National Oceanographic and Atmospheric Office of Diversity, 2006) TITLE: Tips to improve the interaction among the generations: Traditionalists, boomers, X’ers and nexters 2.2.2 Loyalty towards the employer Another point of contention among generations regards loyalty towards employers. While Traditionals and Boomers have been characterized as being extremely loyal toward their employers, the lack of loyalty of younger workers, especially Xers has been noted. For instance,
  • 25. Page | 25 it has been postulated that Xers may value their relationship with their co-workers above the relationship with their company, especially if this co-worker is a friend, and that giving the employer two-weeks’ notice may be an Xer’s idea of loyalty towards the employer. In addition, Xers presumably view job-hopping as a valid career advancement method. Xers presumably learned that loyalty to an employer did not guarantee job security, from witnessing job losses among parents who were loyal to their employers and played by the rules. Xers more so than boomers have been found to report that remaining loyal to an employer was outdated and were significantly less likely to report being loyal to their employer. However, in that particular study, the Xers interviewed were graduate students and the extent to which such results are applicable to non-graduate students is of course debatable. Nevertheless, loyalty towards employers has been found to decrease, depending on how ‘new’ the generation was: the younger the generation, the least loyal the generation appeared to be. For instance, about 70% of traditionals reported that they would like to stay with their current organization for the rest of their working life compared with 65% of boomers, 40% of Xers, and 20% of Yers. However, such a finding may make intuitive sense, given that humans tend to prefer the familiar and seek stability as they grow older. Consequently, they may be less desirous of going through the process of socializing into a new organization at a later stage in their lives. Smola and Sutton (2002) also found younger employees to be less loyal to their company and more ‘me’ oriented. They wanted to be promoted more quickly than older workers, were less likely to feel that work should be an important part of their life and reported higher intention of quitting their job if they won a large amount of money. However, the perception of loyalty may be context dependent. Firstly, compared with older generations, Xers
  • 26. Page | 26 and Yers do not change jobs more frequently than older people did at the same age. Furthermore, the frequency with which individuals change jobs may also be related to the economy, as people are more likely to change jobs if the economy is good and opportunities are numerous. Finally, younger workers typically hold several jobs while still studying, but tend to stabilize with one employer as they get older. Therefore, loyalty (or lack of thereof) may be more a matter of age or other contextual circumstances than a generational trait. Although the extent to which employees feel loyal towards their organizations appears to differ across generations, members of all generations reportedly share similar reasons for staying in their organization. In her book, Retiring the Generation Gap, which provides a wealth of information about generational differences in the workforce, Deal (2007) reported that other factors likely to increase employees’ loyalty included for instance, opportunities for advancement and promotions, opportunities to learn new skills and develop a challenging job, as well as better compensation such as higher salaries or benefits. Employees were also more likely to stay if the company’s values matched their own. For instance, how a business handles organizational change and manages itself as well as whether the business creates opportunities for a better quality of life, better communication, and improvements such as more autonomy, control and greater contribution to their specific job were cited as company values that mattered. Individuals were also more likely to remain with an organization if the organization respected older people with experience more than younger people, and if organizations respected younger people, at least for their talents.
  • 27. Page | 27 2.2.3 Attitudes regarding respect and authority Xers complain about managers who ignore ideas from employees, and ‘do-it because I said so’ management. While younger workers complain that there is a lack of respect towards them in the workplace, older workers share similar complaints, especially regarding the attitudes of younger and newer employees toward management. Deal (2007) examined the attitudes of members of different generations relative to authority finding that 13% of members of the traditional generation included authority among their top 10 values, compared to 5% of boomers, 6% of Xers and 6% of Yers. This suggests that authority might be valued more by members of the traditional generation than members of other generations. Although the percentages are small, they lend some support to the prevailing stereotypes that Traditionals display command-and-control leadership reminiscent of military operations and prefer hierarchical organizational structures. However, these figures do not support the claim that Boomers presumably also prefer a top-down approach to management. Most importantly, these figures indicate that the characteristics that are often attributed to a generation as a whole are often shared by only a small percentage of individuals within that generation. The popular literature contains more information about how younger generations interact with authority, as opposed to how they act when in position of authority. For example, both Xers and Yers are comfortable with authority figures and are not impressed with titles or intimidated by them. They find it natural to interact with their superiors, unlike their older counterparts and to ask questions. Yers in particular have been taught to ask questions, and questioning from their perspective does not equate with disrespect. Similarly, Yers believe that respect must be earned
  • 28. Page | 28 and do not believe in unquestionable respect. While there is not an empirical basis regarding the behaviors of Yers and Xers when in position of authority, only a small percentage of the younger generations feel a need to exert authority. Younger workers like their older counterparts want to be respected, although the understanding of respect among older and younger workers differs. Older workers want their opinions to be given more weight because of their experience and for people to do what they are told, while younger workers want to be listened to and have people pay attention to what they have to say. Furthermore, older people may not appreciate equal respect showed to all, and may want to be treated with more respect than one would show someone at a lower level in the hierarchy or with less experience. Therefore, meeting the expectations of respect that individuals hold may be a genuine challenge in the workplace. 2.2.4 Desire for a better work/life balance One characteristic often attributed to younger workers, perhaps more so to Xers, is their desire for balance between work and life. As children, Xers reportedly saw their parents lose their jobs, despite making sacrifices for their careers, and grew up to value a balance between work and life. Although much of the evidence is anecdotal, 45% of workers aged 18 to 24, 37% of workers aged 25 to 34, and 37% of workers of all ages who participated in the 1998 General Social Survey, National Opinion Research Center indicated that they worked hard, but did not let work interfere with the rest of their lives.
  • 29. Page | 29 The youngest workers were most likely to try not to let work interfere with the rest of their lives. Only 37% of the younger members of Generation X reported doing the best work they could even if it interfered with the rest of their lives, as opposed to 54% of all workers, again confirming that younger workers were attempting not to let work interfere with the rest of their lives. However, although older Xers are most likely to want a work/life balance, members of other age groups to varying extent also aspire to the same thing. 2.2.5 Attitudes towards supervision Workers appear to differ in the extent to which they appreciate supervision and require feedback. For instance, younger workers presumably dislike micromanagement, but do want strong leadership with clear instructions. A study comparing Xers, Boomers and Traditionals in the public sector workforce indicated that boomers valued freedom from supervision significantly more than Xers. However, there was no difference between Xers and Traditionals or Boomers and Traditionals in the extent to which they wanted freedom from supervision. Workers from each generation also differ in the extent to which they require feedback. While younger workers prefer regular feedback, older workers may be insulted by it. 2.2.6 Other sources of differences Other elements of the workplace across which members of the four generations differ include their perception of what contributes to success in the workplace, and their preferred leadership attributes. Traditionals believe that in order to be successful in the workplace, they have to meet deadlines, whereas the three younger generations believe that success rests in the use of computers. While Traditionals, Boomers, and Xers prefer a leader who has credibility, Yers prefer a leader who listens well.
  • 30. Page | 30 While there may be differences across generations, those differences are often context or age dependent rather than generational traits per se. Furthermore, there are similarities among generations. For instance, the generations share similar concerns about change, reasons for staying in an organization, values, and preferred mode of communication. Similarly, workers from all generations want the freedom to set their own hours, if the work is done, indicating that this is not a preference of the young only. The majority of workers believe that fairness is the most important aspect of workplace culture, and that feeling valued, recognized, and appreciated and being in a supportive environment encourage happiness in the workplace. Generational differences may not manifest themselves in the workplace as much as postulated by the popular literature. For instance, Xers, Boomers and Traditionals all want to benefit society, engage in satisfying leisure, exercise leadership, have friendly and congenial associates, have a high salary, high prestige, and status, make contributions to important decisions, have a stable and secure future, variety in work assignments, and work as part of a team. 2.3 LEADERSHIP STYLES: AUTHOR: (The National Oceanographic and Atmospheric Office of Diversity, 2006) TITLE: Tips to improve the interaction among the generations: Traditionalists, boomers, X’ers and nexters DIFFERENT GENERATIONS IN THE SHRM ARTICLE LEADERSHIP STYLES: Generational Differences, by Nancy R. Lockwood,the author stresses the importance of using flexible leadership styles to address the needs and expectations of multiple generations at work. The article recommends the following best practices to better equip leaders and managers and to increase productivity and retention.
  • 31. Page | 31  Silents • Create positive working relationships by gaining trust and respecting their experience without being intimidated by it. • Gain their confidence by demonstrating compassion and understanding.  Baby Boomers • Preferred leadership style is collegial and consensual. • Gain their confidence by demonstrating compassion and understanding. • Approach them with respect for their achievements. • Involve them in participating in the organization’s direction and implementation of change initiatives. • Challenge them to contribute as part of a team to solve organizational problems. • Offer opportunities to serve as a coach as part of the change process. • Support work–life balance.  Gen Xers • Respect the experiences that have shaped their beliefs and thinking. • Tell them the truth. • Honor sense of work–life balance. • Offer mentoring programs. • Clearly communicate that repetitive tasks and quality checks are part of the job. • Offer learning opportunities.  Gen Yers • Take time to orient with respect to the organization’s culture. • Provide structure and strong leadership.
  • 32. Page | 32 • Be clear about expectations and long-term goals. • Offer mentoring programs.
  • 33. Page | 33 Tr d o or 1925 1945 b oom r or 1946 1964 M MM B B B M B B M M M M B 2.4 DIFFERENCES BETWEEN GENERATIONS AUTHOR: Martin,C.A., & Tulgan, B. (2002) TITLE: Managing the generation mix. Amherst,MA: HRD Press Talent Management Team - Executive Office - United Nations Joint Staff Pension Fund ire Traditionalist Baby Boomers Generation X Generation Y/Z Formal Business - casual (high end) Business - casual (low end) Whatever feels comfortable Work Environment Office only Long hours - office only Office, home, desires flexible schedule Office, home - desires flexible schedule Motivators Self – worth Salary Security Maintain personal life Mentoring Not necessary Does not handle well negative feedback Not necessary to receive feedback Constant feedback needed Retention Loyalty Salary Security/Salary Personal relationship Client Orientation Personal contact Telephone E-mail E-mail/IM/Text Technology Dictates documents, e-mail only in the office, use of library instead of web, limited phone use Documents prepared by the Associates, e- mail primarily in the office, web use to “google” Creates own documents, uses mobile and laptop, uses web to research, review etc., e- mail/mobile 24/7 Creates own documents, creates databases, uses web to research and network, use of e-mail/IM/text 24/7Career Goals Build a legacy, a life-time career with one company Build a perfect career, excel Build a transferable career, variety of skills and experiences Build several parallel careers, have a several jobs simultaneously
  • 34. Page | 34 2.5 MOTIVATION AND TRAINING OF GENERATION X AND Y How to motivate Generation X How to effectively train Generation X How to motivate Generation Y How to effectively train Generation Y They tend to avoid corporate politics They are generally not very interested in traditional perks They are motivated by the prospects of independence, the lack of corporate structure and lack of rigidity They are motivated by the possibility of the latest technological advances They need to be made clear what you are looking for Allow them to question the experts and the authority Web-based training Allow them to ask questions and challenge the concepts Keep the training materials brief and easy to read Offer multi-media learning opportunities Ensure access to simple, logically organized knowledge database Sensitive to design and graphics This group maintains short attention span They love a challenge They function well as team members They want to be heroes They want to be surrounded by bright, creative people They want it right now They are looking for the empowerment They thrive in multi-media environment They can learn any time anywhere They need flexibility Multi-tasking Enable internet reliance (Webinars, IM, Blogs, Podcasts, Avatars, YouTube) Enable social networking through internet (My Space, Friendster) Provide with simulations Provide with the structured learning regardless of the form Connect me with everything True team players
  • 35. Page | 35 CHAPTER 3 Research Methodology
  • 36. Page | 36 CHAPTER 3: RESEARCH METHODOLOGY INTRODUCTION Generation gaps in the workplace are nothing new. Changes in the work force bring about a need for change in management styles. Treating everyone the same is not so important anymore. Treating everyone fairly is critical. Lack of attention to generational differences will make any company less attractive to recruits, resulting in higher recruiting costs and greater difficulty in finding the right employees. The critical management skills will involve understanding generational differences in order to strengthen work relationships between and among employees. Understanding how these generations are actually coming together should help companies design work/life programs that can help them train, develop, and retain employees. It should also lead to ideas on how the generations can work together most effectively and efficiently. Due to the above, we thought that it is significant for Human Resource Managers in the business world today to understand and realize the difference between the four generations of employees. We also studies how well the organization in today’s work force deals with this gap. 3.1 Research Approach An effective strategy has been used to collect most of the information and data from various sources. The research is termed as “primary research “as different methods are used to collect information from employees of Allied Bank.
  • 37. Page | 37 3.2 Research Purpose In order to carry out the current research work, quantitative research methods has been used. Quantitative method uses numbers to examine data or information. It is one of the methods used by the science. The quantitative data are those that are shown numerically, such as statistics, percentages, etc. The quantitative method is opposite to qualitative method or qualitative research, which takes wider questions and gathers information from study participants who cannot translate it into numbers, but only in words. The quantitative methods are often used in the social sciences such as psychology, economics, sociology, political science, and to a lesser extent, anthropology and history. The purpose of this research work is to identify the impact of generation gap at workplaces. Therefore, in order to find out the factor of influence the researcher has opted for using quantitative method so that the data can be gathered through questionnaire and analyzed using statistical technique. 3.3 Research Design Research design is divided into various types of designs including investigational, fundamental, correlational, and expressive research. They help in identifying different types of research methods. But the most prominent and appropriate research method which has been applied in this research paper is investigational research. 3.4 Research Methodology There are several methods of conducting research which are generally used by the researchers while carrying out their respective researches. However, the two most commonly
  • 38. Page | 38 used research methods are quantitative and qualitative research methods. In carrying out the current research work, we have opted for quantitative research methods. In the current research, we have gathered quantitative data from questionnaire and interview. 3.5 Sample Size and Target Population With the purpose of collecting secondary data, information is gathered from sample size which consisted of 75 employees. The data has been gathered with the help of closed ended questionnaire based on Likert Scale. The target population of our research work is employees of Allied bank working in Gulshan Branch, Shahrah-e-Faisal Branch, Jauhar branch and M.A.Jinnah Road branch. 3.6 Sampling Technique Before moving on to data collection, it is necessary to understand that sampling is an essential phase. Sampling, as it name tells refers to make a sample. Here the sample is referred to the population. Population is people who are considered to be respondents or the people from whom the primary data is to be collected. There are some cases where sampling may fail when there is a very less population, in such cases the whole population is to be considered. In order to have more précised sample size, and to follow survey methodology in statistics, a sampling technique is identified. We have opted for simple random sampling for our research project.
  • 39. Page | 39  Simple Random Sampling In the present research work, we have followed simple random sampling technique. The required sample size has been identified using SRS-simple random sampling. In this technique there is an equal probability for all the subsets of the frame. Every element holds equal opportunity to be selected. In addition to the any provided pair has equal chance for selection in comparison to any other pair. This technique reduces the biasness and helps in simplifying analysis. Moreover, the difference among the results obtained from individuals within the defined sample becomes an indicator of variance in the whole population that facilitates in making it easier to assess the results accuracy. 3.7 Data Source Primary data has been collected in order to carry out this study. The data has been gathered by us using questionnaires. Close ended questionnaire method has been taken into consideration by us. The key point here is that the data collected by us is unique and must not be accessible unless it is published. 3.8 Sampling Unit The unit of analysis is individuals. 3.9 Data Collection Method Methods of data collection refer to the ways through which both primary and secondary information has been collected for the research completion and selection of the appropriate method. However, the selection of method varies on the nature of study that is being conducted, on the data that needs to be gathered, the financial limitations and time that the researcher has faced while conducting research.
  • 40. Page | 40  QUESTIONNAIRE FORMATION Since the questionnaire is chosen to be the instrument for primary data collection, it should be kept in mind that there are few considerations and requirements by the in-charge of the report to be kept in mind when making a questionnaire. 3.10 Instrument for Data Collection Survey has been carried out through questionnaires. Closed-ended questionnaire is designed based on Likert Scale. The questionnaire included two main sections; first section is based on background information, however, second section is based on the questions that have helped in gathering required data. Interview was also held with the top management employees. 3.11 Statistical Technique/Tool For the analysis of the data gathered, different charts will be formulated on the basis of data gathered from the questionnaire survey. 3.12 Hypothesis Our alternate hypothesis is as follows: H1: Generation Gap exists at workplaces (Allied Bank) Our null hypothesis is: HO: Generation Gap does not exist at workplaces (Allied Bank) 3.13 Ethical Considerations Although there are no identifiable risks in the course for the preparation of this paper, certain considerations are recognized for anyone participating in the study, directly or indirectly.
  • 41. Page | 41 The considerations are duly noted and are used extensively in the research design stage. However, certain precautions are observed for the safety and security of anyone directly affected by the study or the conduct of the research. We are completely conscious of the ethical consequences implied in this research. Obligation for all processes and ethical consequences associated with the research remains with the primary researchers. Study was carried on in such a way that the reliability of the research project was preserved and negative impacts which may reduce the prospective for succeeding studies are avoided.. The research study is based on an intellectual issue. We have been aware of the possible effects that can be harmful in various circumstances and the method that has been adopted after consulting our supervisor Sir Ali Askari. The research method was completely justified. 3.14 Reliability Reliability as to the materials or information used is guaranteed. Reliability as to the results of the interviews, surveys and other means of obtaining data is also assured since it is us who personally undertakes these activities. Reliability is a psychological concept that refers to the consistency of a measure. A test is considered reliable if we get the same result repeatedly. For example, if a test is designed to measure a trait (such as introversion), then each time the test is administered to a subject, the results should be approximately the same. Unfortunately, it is impossible to calculate reliability exactly, but it can be estimated in a number of different ways. The concept of reliability is not of too much concern supposedly since the research is somewhat limited in scope without digging into the details of complicated and scientific means.
  • 42. Page | 42 The research does seek to explain a theory out of the methodology results about generational gap at workplaces since it only provides a bird’s eye view which means it is broad enough. It tells us what generational gap is and how it is impacting at workplaces. In general, the research is just an “eye-opener” for us. However, reliability should still be observed to avoid confusion of facts and misinterpretations of information and data obtained. 3.15 Validity Essentially, validity entails the question, “does your measurement process, assessment, or project actually measure what you intend it to measure?” The related topic of reliability addresses whether repeated measurements or assessments provide a consistent result given the same initial circumstances. In research, validity has two essential parts: internal and external. Internal validity includes whether the results of the study (e.g. mean difference between treatment and control groups) are genuine because of the way the groups were selected, data was recorded or analysis performed. For example, a study may have poor internal validity if testing was not performed the same way in treatment and control groups or if confusing variables were not accounted for in the study design or analysis. External validity, often called “generalizability”, involves whether the results given by the study are transferable to other groups (i.e. populations) of interest. Validity can be correlated and paired with reliability in that both have the same purpose of confirming the integrity of the research methodologies used as well as the materials and information obtained and integrated in the research. Validity essentially deals with the “truthfulness” of the information and the results of interviews, surveys and tests conducted. The validity of the research can be tested by anyone who has a stake in the study or whose interest in it forms part of their educational development. The researcher is still obliged to observe the
  • 43. Page | 43 necessary rules in validating all information and data used to prevent undesirable consequences when the research is eventually reviewed by peers and other interested stakeholders. 3.16 Limitations The research is done with the need of extensive travel and additional funds, the common limitations of all forms of research. In addition, the research is conducted only in a particular community with a representative population deemed sufficient for scientific reliability and validity. However, the only limitation that would greatly affect the conduct of the research is the sourcing of participants for the different methodologies in the community. This may not be an uninteresting process but requires a focus of attention since it can be time-consuming which also limits the period of completing the research. Other limitations include:  Budget for research is not allocated and all expenses will be paid on our own costs.  The amount of time to complete this research is limited as we have to submit and present the data/finding in 12-weeks’ time.  This will be our first research work so we will be lacking the experience to do the research.
  • 44. Page | 44 3.17 TIMESCALE 1. Approval of research strategy and topic with supervisor = August 2. Proposal Drafting = August 3. Review and draft of literature = End of August till start of September 4. Approval of formal access to organization for collection of primary data = End of September 5. Administer questionnaire = October 6. Final collection of questionnaire = End of October 7. Data analysis = End of October 8. Final writing of project report = First week of November 9. Report Submission = 16TH November, 2015
  • 45. Page | 45 3.18 Chapter References: INTRODUCTION:  Broderick, A. (1998, May/June.). Managing Diversity. Women in Business, 44(3), 13-14.  Coolidge, S. D. (1999, August. 9). Generations Apart. Christian Science Monitor, 91(177), 11.  Ruch, W. (2000, April.). How to Keep Gen X Employees From Becoming X-Employees. Training & Development, 40-43. VALIDITY:  Creswell, J. W. (1998). Qualitative inquiry and research design: Choosing among five designs. Thousand Oaks, CA: Sage.  Cohen, L. Manion, L. and Morrison, K.R.B. (2007) Research methods in education, 6th Edition. Routledge.  Cooper, D.R. and Schindler, P.S. (2006) Business Research Method, 9th Edition. Boston: McGraw-Hill Irwin. RELIABILITY  Edris, T., & Meidan, A. (1990). On the Reliability of Psychographic Research: Encouraging Signs for Measurement Accuracy and Methodology in Consumer Research. European Journal of Marketing , 24 (3), pp. 23-41.  Cherry, K. (no date). What is reliability? About.com Pscyhology online. Retrieved on February 6, 2013 from http://psychology.about.com/od/researchmethods/f/reliabilitydef.htm
  • 46. Page | 46 CHAPTER 4 MARKET RESEARCH AND ANALYSIS
  • 47. Page | 47 4.1 SWOT ANALYSIS SWOT analysis is an acronym that stands for Strengths, Weaknesses, Opportunity and Threats. This is a careful evaluation of an organization’s strengths to avail an opportunity by overcoming its weaknesses and phasing out all he threats to its survival in order to grow and survive. 4.2.1 Strengths • This branch is provided with 3 fax machines, more than 7 telephone connections, which make communication easier with different branches • The branch is linked through an online network of 755 BRANCHES, thus enabling them to serve customer in better way. • This branch is provided with latest computer which increases the speed of computer work. • The branch is situated in the commercial hub of Rawalpindi. This location provides a competitive edge to the Branch. • The branch is situated in commercial area were business activities perform greater as compare to residential area. Thus it increases the number of customers. • The Branch has the most experienced and the least experienced staff, which is a good combination of experienced heads and exuberance of youth. • The branch is the main branch in the areas, which is another plus point for the Branch. • It holds the Hundi Accounts, where the payments are made through checks. This process provides an opportunity to the Branch to have more of the Hundi customers as the Bank customers.
  • 48. Page | 48 4.2.2 Weaknesses • The Branch has a good staff combination on the basis of experience, but their training capabilities are not up to the requirements of the fast changing banking environment. • The customer’s Long-term contacts are not maintained with customers. • The technical training of the staff is negligible e.g. in case of the absence of computer there is no alternate trained personal who can record the daily transactions. • The organization is very much mechanistic and provides no flexibility to encourage creativity. • The lower staff is non cooperative as compared the lower staff of other branches. • The control of manager is not effective. • The discretionary powers of manger are very low to offer more incentives and value added services to its customers. • There is a lack of commitment and professionalism on part of the employees. The staff is always in a hurry to leave the bank as soon as possible. They were also observed to starting their operations comparatively late. • The organizational culture is not cooperative • Nepotism was observed on part of the manger as well as the top management towards some staff members. • The branch has no industrial accounts. • The level of technology management in the branch is very low. The technology available is not maintained well mainly because of the lack of technically trained staff. For instance the scanner, in spite of its availability has not been used for scanning the specimen signature cares. • In spite of the presence of technology many jobs are done manually such as the letters, drafts for fax messages and other calculations, which could be easily, done in MS Word and MS Excel.
  • 49. Page | 49 • The branch lacks some physical facilities such as clean washrooms which can affect employee’s performance • The layout of the branch is such that it is hindering the flow of work on one hand and the documents are lying exposed which can be easily taken away by any person entering the branch. 4.2.3 Opportunities • The biggest opportunity for the ABL, Tench Bazaar branch Rawalpindi is the greater number of Christine customers who get their payments through ABL, Bank Tench Bazaar branch. These customers can be easily convinced to open their accounts with ABL. • A considerable portion of the labor force of the area is serving overseas. Their families can be encouraged to use ABL as channel for remittances. • The Internet facility in the area provides an opportunity to ABL to get Online. • The Bank has the basic infrastructure, which can facilitate the online process. • The location of the ABL, Tench Bazaar branch itself provides an opportunity to ABL to get more and less cost deposits. • The group from its survey and analysis of IT companies has found out that there are many companies which are not satisfied with its current bank, so Tench branch with its superior service quality and long working hours can capture those customers 4.2.4 Threats • The biggest threat to the operational success of the branch is the better competitor’s services. Many private sector banks are offering higher rates of return to customers than Allied Bank of Pakistan.
  • 50. Page | 50 • Cannibalization of profits is yet another threat to the success of Bank Tench Bazaar branch. The branch of Allied Bank is located very close to the Soneri Bank Tench Bazaar branch. All these branches are taking away each other’s customers. • One of the biggest to the ABL, Tench Bazaar branch is the increasing rate of dissatisfies customers. Most of these customers were observed to be dissatisfied with the delays in their servicing. • The greatest threats to the performance of ABL, Tench Bazaar branch are the decreasing morale of employees. They feel that they are not provided with bonuses. They are not given proper attention to have a say in the annual meetings. The proxy forms are signed on their behalf without letting them know. • High-pressure interest groups are developing which poses a constant threat to Allied Bank. 4.2 PEST ANALYSIS 4.3.1 POLITICAL Pakistan despite all international and public perceptions, today is a functioning democracy and gradually there is a change in complexion and composition of legislatures with more educated people and women (27% of National Assembly and17% of Senate) entering into politics. Similarly it helps in designing best strategies to implement that could support the revival of bank
  • 51. Page | 51 industry. Like in the era of nationalization banks had to suffer as other industries that’s why that impact is still found in the performance of this industry. 4.3.2 ECONOMICAL Although banking sector development is important at the early stage of economic growth, general liberalization presuming a homogeneous bank role may not necessarily promote growth. The estimated cost structure indicates that state-owned commercial banks are large enough, while development financial institutions and private banks can expect to obtain cost-saving advantages by expanding their operations. Since scope economies are significant, portfolio diversification generally increases bank profits. In addition, privatized banks are the most efficient, followed by foreign and private banks. Public banks are the least efficient. 4.3.3 SOCIAL Banks always helped people in improvement of living condition of poor people in various forms like giving loans to poor for starting business or directly providing them the instruments that could enhance their living conditions. Similarly Allied Bank always tried to provide the needy people loans on soft terms and also helped to eradicate unemployment by providing job opportunities Recent high growth trends coupled with enhanced spending on social and005/2006 has together begun to pay some dividends as evident from the reversal in poverty incidence trends and social indicators. 4.3.4 TECHNOLOGY The Banking sector in Pakistan has experienced a rapid transformation. Just about a decade back this sector was limited to the Sarkari (read nationalized) and co-operative banks. Then came the multi-national banks, but these were confined to serving an elite few. One could regard the past
  • 52. Page | 52 as the 'medieval ages' in the banking industry, wherein every branch of the same bank acted as an independent information silo and multi-channel banking (ATMs, Net banking, Tele-banking, etc.) was almost non-existent. Today banks have to look much beyond just providing a multi-channel service platform for its customers. There are other pressing issues that banks need to address in order to chalk-out a roadmap for the future. Here are the top three concerns in the mind of every bank's CEO. The customer is interested in how he/she can benefit from the bank and its products. That's why it becomes necessary for a bank to differentiate its products from the others. Some of the ways in which differentiation can be introduced are through specialization, new products, and increasing the added value 4.3 A COMPARATIVE STUDY OF ALLIED BANK OF PAKISTAN AND MUSLIM COMMERCIAL BANK OF PAKISTAN A comparative study is made between the Allied bank Limited and the Muslim Commercial Bank in pre-privatization period (1980-1991) and the post- privatization era (1991-2000). Four components are selected to assess the impact of privatization on both banks and the reliability of components in both eras. Nonparametric tests, regression and Reliability models are applied to see the progress within banks and within the nationalization and privatization periods. The results show that the investment of ABL increased and surpassed the investment of
  • 53. Page | 53 MCB in post-private period. However, the deposits of the MCB enhanced in post- privatization period as compared to the ABL. The income has no significant impact of privatization on both the banks. The ABL significantly improved its pre-tax profit as compared to the MCB. Table 1: Profitability of ABL and MCB in both periods Allied Bank Limited Muslim Commercial Bank Pre-Privatization Post-Privatization Pre-Privatization Post-Privatization Deposit 90408 497288 195274 956451 Income 9198 58755 31814 23016 Pre-Tax Profit 337 269456 1595 7444 Investment 32994 569354 66768 388334 The following figures show a comparative analysis of the progress of the components of both banks in both study periods. The box plots clearly illustrate the overall evolution of the banks. The efficacy of the MCB in general is has been increased rapidly after the bank was privatized. Figure 2,3 Normal Q-Q Plot of pre-privatization of ABL and MCB
  • 54. Page | 54 Figure 4 Box plot of ABL and MCB performance before privatization Figure 5 Normal Q-Q plot of ABL and MCB performance in post- privatization era Figure 6 Box plots of ABL and MCB during post-privatization period
  • 55. Page | 55 Table 6.46 Paired Samples Statistics of pre and post-privatization of indicators and Banks Mean N Std. Deviation Std. Error Mean Pair 1 Pre-Privatization 53548.50 8 65478.424 23150.119 Indicators 2.50 8 1.195 .423 Pair 2 Post-Privatization 346262.25 8 328312.702 116076.069 Indicators 2.50 8 1.195 .423 Pair 3 Pre-Privatization 53548.50 8 65478.424 23150.119 Bank 1.50 8 .535 .189 Pair 4 Post-Privatization 346262.25 8 328312.702 116076.069 Bank 1.50 8 .535 .189 Pair 5 Pre-Privatization 53548.50 8 65478.424 23150.119 Post-Privatization 346262.25 8 328312.702 116076.069 Table 6.47 Paired Samples Correlations of Indicators and Banks Correlation Sig.N Pair 1 Pre-Privatization & Indicators 8 -.545 .163 Pair 2 Post-Privatization & Indicators 8 -.235 .575 Pair 3 Pre-Privatization & Bank 8 .332 .422 Pair 4 Post-Privatization & Bank 8 -.008 .985 Pair 5 Pre-Privatization & Post- Privatization 8 .860 .006 Table 6.48 Paired Samples Test Indicators and Banks in pre and post-privatization periods Paired Differences 95% Confidence Interval of the Difference Mean Std. Deviation Std. Er ror Mean Lower Upper t df Sig. (2- tailed ) 53546.000 65479.075 23150.349 -1195.877 108287.87 7 2.313 7 .054Pair 1 Pre-Privatization - Indicators Pair 2 Post-Privatization - Indicators 346259.750 328312.983 116076.168 71783.227 620736.27 3 2.983 7 .020 Pair 3 Pre-Privatization – Bank 53547.000 65478.247 23150.056 -1194.184 108288.18 4 2.313 7 .054 Pair 4 Post-Privatization – Bank 346260.750 328312.706 116076.070 71784.459 620737.04 1 2.983 7 .020 Pair 5 Pre-Privatization - Post- Privatization -292713.750 274009.993 96877.162 - 521791.837 -63635.663 -3.021 7 .019
  • 56. Page | 56 Mean Minimum Maximum Range Maximum / Minimum Variance N of Items Item Means 99953.688 1.500 346262.250 346260.750 230841.50 2.760E10 4 Item Variances 2.802E10 .286 1.078E11 1.078E11 3.773E11 2.832E21 4 Inter-Item Correlations .067 -.545 .860 1.405 -1.580 .214 4 Table 5.54 Scale Statistics of ABL and MCB Mean Variance Std. Deviation N of Items 399814.75 1.491E11 386097.893 4 Table 5.5 Analysis of Variance for ABL and MCB in both periods Sum of Squares df Mean Square F Sig Between People 2.609E11 7 3.727E10 6.624E11 3 2.208E11 8.855 .001Within People Between Items Residual 5.237E11 21 2.494E10 Total 1.186E12 24 4.942E10 1.447E12 31 4.668E10Total Grand Mean = 99953.69 Figure 6.22 Box Plots of Pre and Post-Privatization Indictors of ABL and MCB on next page
  • 57. Page | 57 Figure 6.23 Comparison of performance of Banks in both periods 4.4 CONCLUSION A comparative analysis was conducted by taking two banks i.e. Allied Bank Limited and Muslim Commercial Bank into consideration. The focus was given on the impact assessment of privatization on both banks during the period mentioned in the research
  • 58. Page | 58 from 1980 to 2000. The results obtained were mixed. The indicators analyzed individually at first instance to examine their validity, reliability, efficacy and growth in both the periods of nationalization and privatization. Thereafter, the components of the bank performance were compared from bank to bank and era to era. In the end the overall progress of two banks were taken and measured their stability, reliability, development and efficacy in both, pre-privatization and post-privatization periods. The analysis is concluded as under: Both the banks i.e. Allied Bank and The Muslim Commercial Bank had their own competitive environment before the privatization. The banks improved regularly the deposits, investment, pre-tax profit and assets. The government of Pakistan from the year 1991 took measures to raise capital and bring the financial institutions into an open environment of competency. In wake of financial reforms, the privatization program was launched which proved to be landmark in the development of economy of Pakistan in 1990s. Some indicators like employment rate and the income were progressing slowly and remained unchanged even after the privatization process. That is to say that the privatization process brought about no impact on some of the components of banking development. Reason behind this lacking may be the policy reforms in financial matters by the frequently changing governments and legal obligations of the privatization process. The Allied Bank Limited showed a slow progress as compared to the Muslim
  • 59. Page | 59 Commercial Bank throughout the privatization period. The reasons explored are the transfer of the bank from pre-nationalization to the nationalization without taking in account of the capital dividends on certain vivid policy measures. The other reason found that the bank shares were sold to its own employees and the employees despite of showing honest struggle could not achieved the high targets as compared to the Muslim Commercial bank, which was sold to group of companies. It was only in 2004 that the shares of the ABL were relocated to a group of companies. The progress of the Muslim Commercial Bank was satisfactory even in the pre- privatization era. Therefore, overall development in the indicators under study remained satisfactory after the privatization act. The performance increased not in the technical efficacy but in technological incursion in the environment of competition client satisfaction. The sampled banks were privatized during 1996-1999 and were compared in terms of their performance before and after their privatization. The time series model is applied in order to examine the sequential trend of privatization before and after the task was accomplished. The plot of the model shows that the deposits and investment declined before privatization whereas less or more the pre-tax profit, income and expenditure remained persistently in growth throughout the pre-privatization period. On the contrary, in the post-privatization era, the deposits and investment jerked to high level.
  • 60. Page | 60 4.4 ResearchAnalysis: Answer 1: The total number of respondents was 75 out of which 64% of them were male and 36% of them were female. The method that we used for sampling was non-probability random sampling, which allowed us to randomly pick the respondent without any restrictions. 36% 64% Gender Female Male
  • 61. Page | 61 Answer 2: The total numbers of respondents for the questionnaire were 75. To be able to better interpret the results, we have divided the age groups for our questionnaire into three brackets which are from 20 to 35, 36 to 50 and 51 to 70 years. The number of respondents that filled the questionnaire from the age bracket of 20 to 35 was i-e, 56%, from 36 to 50 the percentage was 32% and from 51 to 70 the percentage was 12%. High percentage in the 20 to 35 age bracket, which is 56%, is observed because most of the employees in the bank are from that age group. However, there are employees who belong to the age group of 36 to 50. In addition to that, the age group of 51 to 70 had the least number of respondents because the employees of this age group are mostly of higher designations. 56%32% 12% Age Groups 20-35 36-50 51-70
  • 62. Page | 62 Answer 3: The total number of respondents was 75, amongst which 28% had studied till intermediate. The major chunk which is 40% had done their bachelors, 24% of the respondents had studied till masters and 8% of the respondents marked their education as others. 28% 40% 24% 8% Education Intermediate Bachelors Masters Others
  • 63. Page | 63 Answer 5 Out of the total respondents, 72% claimed that Generation Gap does exist at their workplace. 16% claimed that there is no such thing as Generation gap at their workplace, whereas 12% of the total respondents said they don’t know whether there exists generational gap at their workplace or not. 72% 16% 12% Generation Gap exists at workplace? Yes No Don't know
  • 64. Page | 64 Answer 6: When asked what they think are the main reasons behind disputes amongst generations, 48% of the respondents ranked Intolerance as the most important reason behind generational disputes at workplace. 22% of the respondents said that the main reason behind generation gap which leads to disputes and conflicts at workplace is due to difference in perspectives amongst employees of different age groups. Lack of respect for others was considered the main reason behind disputes amongst generations at workplace by 18% of the respondents.12% of the respondents thought the main reason behind disputes amongst different generations at workplace is acceptance vs. non acceptance of rules, as it is believed that the new generation cares less about rules and regulations as compared to the baby. 18% 48% 22% 12% Main Reason for Disputes Amongst Generations Lack of Respect for others Intolerance Difference in Perspectives Acceptance/Non Acceptance of Rules
  • 65. Page | 65 Answer 7: When asked about do they think Decision making is among the main Conflicts and tensions amongst generations at workplace, 72% of the respondents answered with a yes as they do believe that generational disputes arise due to the different power of different generations (depending upon their authority and designations). Members from Generation X and Generation Y having low tolerance level feel that they are being controlled when they don’t have authority to take decisions for themselves. This arises tensions and can lead to conflicts as well. 20% of the respondents responded negatively and justified their answers with saying that decision making has nothing to do with age group the person belongs to and completely resides with the authority the designation given to an individual. The percentage that said they are unaware of whether decision making is a conflict amongst different generations at workplace or not was 8%. 72% 20% 8% Main conflicts and tensions amongst Generations 1. Decision Making Yes No Don't Know
  • 66. Page | 66 Answer 7: When asked about do they think Communication is among the main Conflicts and tensions amongst generations at workplace, 76% of the respondents answered with a yes as they do believe that generational disputes arise due to the Communication Gap. Communication Gap was considered to be minimal between the ay Boomers and Generation X but a huge Communication Gap exists between Generation Y and baby Boomers due to their different styles of Communicating. This gap in communication leads to tensions and conflicts amongst different generations at workplace. Though majority of respondents answered the question with a Yes, 16% of the respondents believed that Communication gap has nothing to do with age group the person belongs to and completely depends upon individuality. The percentage that said they are unaware of whether decision making is a conflict amongst different generations at workplace or not was 8%. 76% 16% 8% Main conflicts and tensions amongst Generations 2. Communication Yes No Don't Know
  • 67. Page | 67 Answer 7: When asked about do they think Difference in working styles is among the main Conflicts and tensions amongst generations at workplace, 64 % of the respondents answered with a yes as they do believe that generational disputes arise due to the different working styles of different generations. The Baby Boomers are very professional and give their full determination to the work whereas the members of Generation X are more inclined towards their families as they have comparatively younger kids so their energy is not fully devoted towards professional life. Talking about Generation Y employees, they want ore work life balance and are seemingly less professional. This difference in working styles leads sometimes to conflicts and tensions amongst generations at workplace. 32% of the respondents responded negatively and said that working style has nothing to do with age group the person belongs to and should not be considered as a conflict or tension amongst generations at workplace. The percentage that said 64% 32% 4% Main Conflicts and Tensions Amongst Generations 3. Different Working Styles Yes No Don't Know
  • 68. Page | 68 they are unaware of whether difference in working style is a conflict amongst different generations at workplace or not was 4%. Answer7: When asked about do they think Attitude is among the main Conflicts and tensions amongst generations at workplace, 84% of the respondents answered with a yes as they do believe that generational disputes arise due to the difference in attitudes of different generations. This arises tensions and can lead to conflicts as well. 12% of the respondents said attitude has nothing to do with age group the person belongs to. The percentage that said they are unaware of whether attitude is a conflict amongst different generations at workplace or not was 8%. 84% 12% 4% Main Conflicts and Tensions Amongst Generations 4. Attitude Yes No Don't Know
  • 69. Page | 69 Answer 7: When asked about do they think Work Ethics is among the main Conflicts and tensions amongst generations at workplace, 64% of the respondents answered with a yes as they do believe that generational disputes arise due to the different power of different generations. The Baby Boomers are believed to have strong work ethics as compared to Generation X and Generation Y. 20% of the respondents responded negatively and said work ethics has nothing to do with age group the person belongs to and it should be taken on individual basis. The percentage that said they are unaware of whether ethics at work is a conflict amongst different generations at workplace or not was 8%. 64% 28% 8% Main Conflicts and Tensions Amongst Generations 5. Work Ethics Yes No Don't Know
  • 70. Page | 70 Answer 8: Baby Boomers (born 1946-1964) Employees from each generation were asked to give their views about characteristics of their generations. When asked about accepting new ideas, majority of respondents disagreed. When asked about Loyalty to workplace, this generation according to respondents is the most loyal one. They tend to be more devoted and dedicated to their workplace than any other generation. 3 4 8 6 4 6 5 1 3 5 0 1 2 3 4 5 6 7 8 9 accept new ideas flexibility loyalty to workplace accept new challenges adapt technological changes Yes No
  • 71. Page | 71 Answer: 8 Generation X (born 1965-1980) When Generation Y employees were asked about accepting new ideas, majority of respondents agreed. When asked about Loyalty to workplace, the number of respondents who were positive was high. This generation also accepts new challenges and can adapt to technological changes easily. 18 12 21 13 15 6 12 3 11 9 0 5 10 15 20 25 acept new ideas flexibility loyalty to workplace accept new challenges adapt technological changes Yes No
  • 72. Page | 72 Answer : 8 Generation Y (born 1981-2000) When Generation Y employees were asked about these characteristics, the results show that these employees are more open to technological changes and excepting new ideas. Loyalty to the workplace is least as these respondents are in a continuous quest of getting higher salaries, so they don’t bother leaving their organization for a better package. 36 21 13 6 37 6 21 29 16 5 0 5 10 15 20 25 30 35 40 acept new ideas flexibility loyalty to workplace accept new challenges adapt technological changes Yes No
  • 73. Page | 73 Answer 9: Baby Boomers (born 1946-1964) When asked about the motivational factors related to work, the ratings given to retirement plan by majority of the Baby Boomers was highest, which means that retirement plan is the most important thing for this generation. Salary was given rating of 4 by the respondents, which eans salary at this age matters a lot. Benefits were rated at 3, Personal recognition at fourth. Training according to them was the least important factor as employees at this age are already having great experience. 4 2 1 5 3 0 1 2 3 4 5 6 Salary Personal Recognition Training Retirement Plan Benefits
  • 74. Page | 74 Answer 9: Generation X (born 1965-1980) When asked about the motivational factors related to work, the ratings given to Salary by majority of Generation Y employees was highest, which means that Salary is the most important thing for this generation. Benefits were given rating of 4 by the respondents, which means Benefits at this age matter a lot. Personal Recognition was rated at 3, Training at fourth. Retirement Plan according to them was the least important factor as employees at this age are not much concerned about retirement. 5 3 2 1 4 0 1 2 3 4 5 6 Salary Personal Recognition Training Retirement Plan Benefits
  • 75. Page | 75 Answer 9: Generation Y (born 1981-2000) When asked about the motivational factors related to work, the ratings given to Salary by majority of Generation Y employees was highest, which means that Salary is the most important thing for this generation. Personal Recognition was given rating of 4 by the respondents, which means Personal recognition is very important for this generation. Training was rated at 3, as it is also very significant for the employees to learn new things in this ever changing business world. Benefits were ranked at 2.Retirement Plan according to them was the least important factor as employees at this age are not even thinking about retirement. Answer 10: Answer: 10 5 4 3 1 2 0 1 2 3 4 5 6 Salary Personal Recognition Training Retirement Plan Benefits
  • 76. Page | 76 Out of the total respondents, 60 % considered that Generation Gap is a major social problem where as 36% of total respondents said that they do not consider Generation Gap as a social problem. 4% of the total respondents said they don’t know whether Generational Gap is a social problem or not. 60% 36% 4% Generation Gap is a Major Social Problem? Yes No Don't Know
  • 77. Page | 77 Answer 11: When asked about whether Generation Gap can be diminished/ lessened or lowered, 56% of the total respondents said yes whereas 36% of them responded in negative. 8% respondents were not sure. 56% 36% 8% Can Generation Gap be Diminished/Lessened/Lowered? Yes No Don't Know
  • 78. Page | 78 Answer 12: When asked about what steps can be taken to diminish/lessen/lower Generation Gap at workplace 50% of the respondents voted in favor of Social events. They feel that if Social Events are organized it can help employees to interact in informal gatherings and this can aid in minimizing the Communication gap which is present among generations at workplace. 19% of respondents said that generation gap can be eliminated to some extent by giving training to the employees at workplace about the matter.31% respondents said that when issues arise due to generation gap the best way to resolve them is discussion. Partied involved in dispute or tension should be sat together and the matter should be discussed, this they believe can help in diminishing Generation Gap at workplace to some extent. 50% 19% 31% Steps that can be used to Diminsh/Lessen/Lowergeneration Gap Social Events Training Discussion
  • 79. Page | 79 4.6 Chapter References SWOT ANALYSIS:  Fare, R., S. Grosskopf and W.L. Weber. 2004. The Effect of Risk Based Capital Requirements on Profit Efficiency in Banking. Applied Economics. 36: 1731-43.  Ahmed, T. and N. Bebe. 2007. Role of Commercial Banks in the Economic Development of Pakistan. Proceedings of the Bangkok Conference 2007: Issues in Global Research in Business and Economics. December 27-29, 2007, Bangkok, Thailand.  Alam, Quamrul, A.M. (1989): “Privatization Policy and the Problem of Industrial Development in Bangladesh”, Journal of South Asian Studies, December.  Ayadi, O.F., A.O. Adebayo and E. Omolehinwa. 1998. Bank Performance  Measurement in a Developing Economy: An Application of Data Envelopment Analysis. Managerial Finance. Vol. 24. No.7. pp. 5-16  Baig, S.A. 1999. Banking System in Pakistan (Part – I). Finance and Markets. Available at http://www.pakistaneconomist.com/issue1999/issue49/f&m.htm (verified 24 Nov. 2006) PEST ANALYSIS:  Beck, J., R. Cull and A. Jerome. 2005. Bank Privatization and Performance Empirical Evidence from Nigeria. World Bank Policy Research Working Paper 3511.  Allen, L. and A. Rai. 1996. Operational efficiency in Banking: An international Comparison. Journal of Banking and Finance 20: 655-72.  Grigorian, D.A and V. Manole. 2002. Determinants of Commercial Bank Performance in Transition: An Application of Data Envelopment Analysis. World Bank Policy Research working Paper 2850.
  • 80. Page | 80  Elyasiani, E. and S.M. Mehdian. 1990. A Nonparametric Approach to Measurement of Efficiency and Technological Change: The Case of Large U.S. Commercial Banks. Journal of Financial Services Research. pp-157-68.  Burki, A.A. and G.S.K. Niazi. 2003. The Effects of Privatization. Competition and Regulation on Banking Efficiency in Pakistan, 1991-2000. CRC Conference on: Regulatory Impact Assessment: Strengthening Regulation Policy and Practice. Chancellors Conference Centre, 26-27 November, University of Manchester, UK.  Carter, D.A. and J.E. MeNulty. 2005. Deregulation, Technological Change and The Business – Lending Performance of Large and Small Banks. Journal Banking and Finance 20: II 13-30.  Government of Pakistan 2001. Pakistan Economic Survey 2000-01, Economic Advisor’swing, Finance Division, Islamabad.  Cooper, W.W. and L.M. Seiford and J. Zhu. 2004. Data Envelopment Analysis History, Models and Interpretations.P. 1-39 In: Cooper, W.W., L.M. Seiford and J. Zhu (ed.). 2004 Handbook on Data Envelopment Analysis. Kluwer Academic Publishers. Boston. USA. COMPARATIVE ANALYSIS OF ABL AND MCB:  Demirguc-Kunt, A and H. Huizinga. 2004. Financial Structure and Bank Profitability. Pp 243-61. In Demirguc-Kunt, A and R. Levine (ed.) Financial Structure and Economic Growth A Cross Country Comparison of Banks. Markets and Development. Pearson Education. Delhi. India.  Fare, R.S., S. Grosskopf and J. Logan. 1985b. The Relative Performance of Publicly Owned and Privately Owned Electric Utilities. Journal of Public Economics. 26.89-106.  Akhtar, M.A. 2002. X-efficiency Analysis of Commercial Banks in Pakistan: A Preliminary Investigation. The Pakistan Development Review. Vol.41. No.4 pp. 567-80.  Galagedera, D. U. A. and P. Edirisuriya. 2004. Performance of Indian Commercial