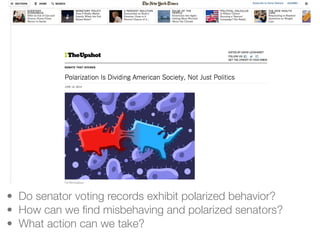
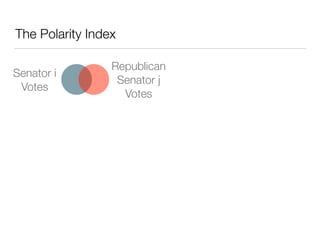
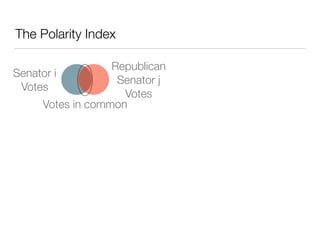
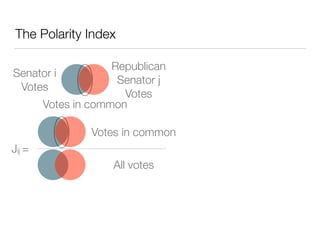
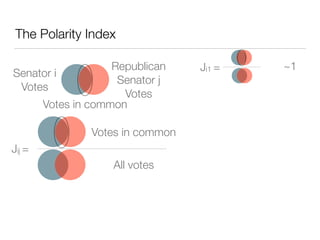
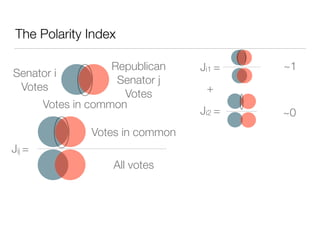
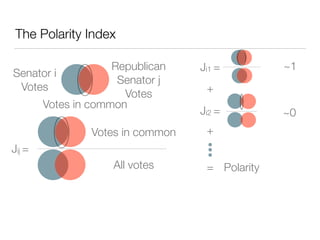
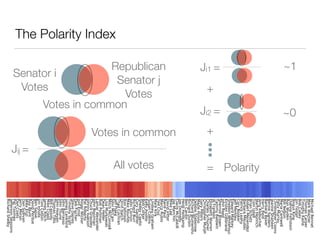
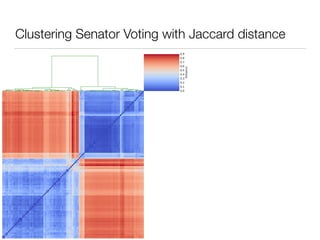
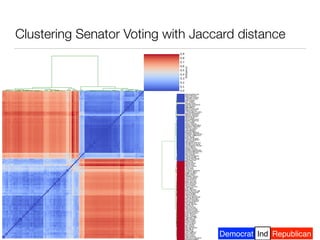
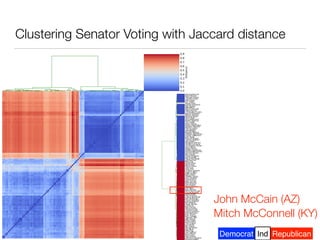
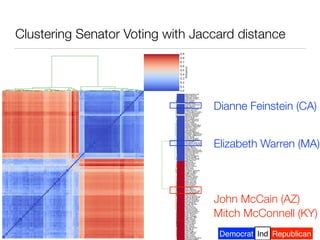
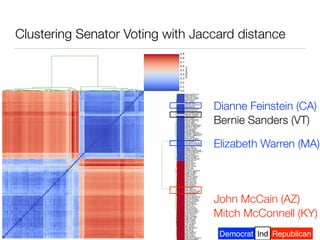
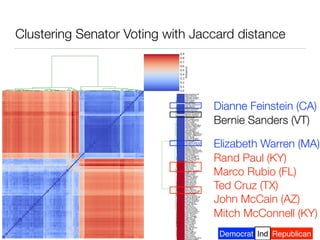
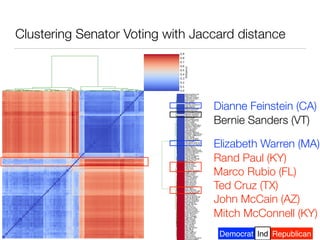
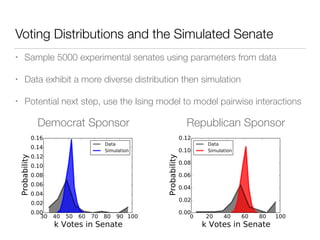
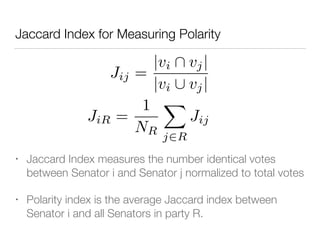
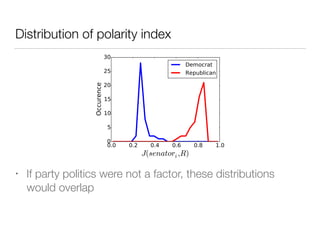
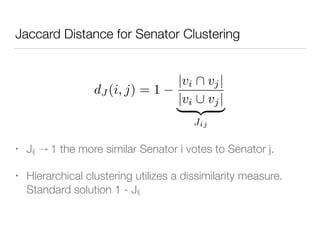
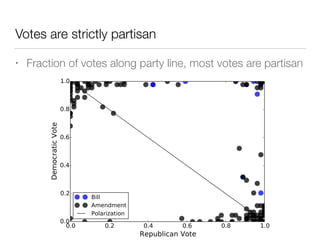
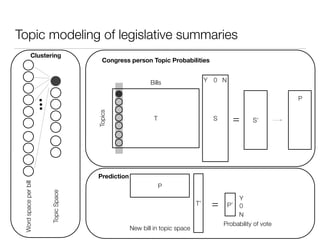
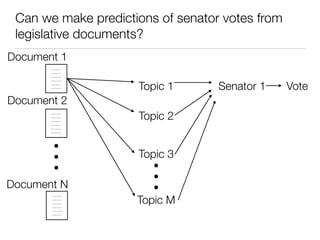
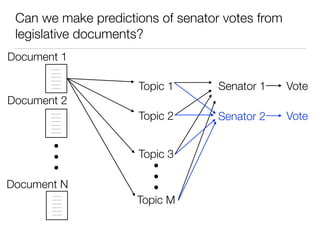
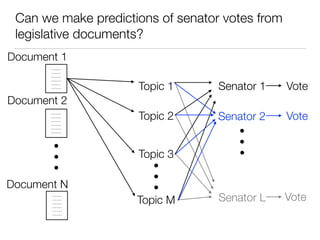
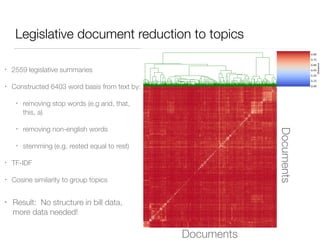
The document discusses using computational methods to analyze political polarization and voting patterns in the U.S. Senate. It introduces a Jaccard index that measures the similarity between any two senators' voting records. This is used to calculate a polarity index that quantifies how aligned each senator's votes are with their own political party. The document also describes clustering analysis of senators based on their Jaccard distances and finding the most and least polarized senators. Topic modeling of legislative documents is discussed as a potential method for predicting how senators might vote on new bills.


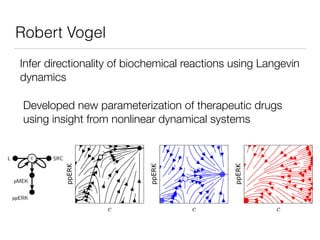


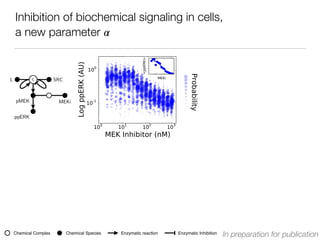
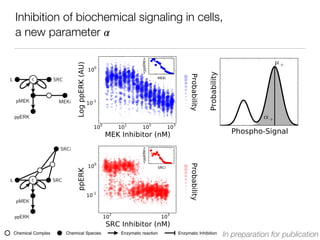
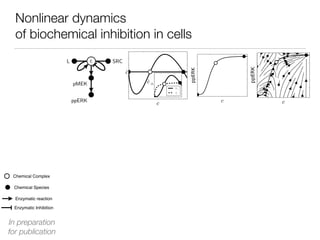
![Nonlinear dynamics
of biochemical inhibition in cells
Chemical Species
Chemical Complex
Enzymatic reaction
Enzymatic Inhibition
L c SRC
pMEK MEKi
ppERK
[MEKi] [MEKi]
In preparation
for publication](https://image.slidesharecdn.com/finaldemo-150701134931-lva1-app6892/85/Final-demo-47-320.jpg)
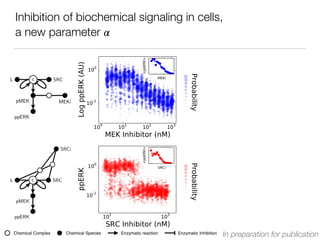
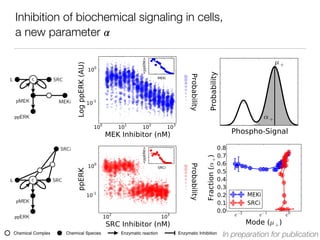
![Nonlinear dynamics
of biochemical inhibition in cells
Chemical Species
Chemical Complex
Enzymatic reaction
Enzymatic Inhibition
L c SRC
SRCi
pMEK
ppERK
[SRCi] [SRCi]
L c SRC
pMEK MEKi
ppERK
[MEKi] [MEKi]
In preparation
for publication](https://image.slidesharecdn.com/finaldemo-150701134931-lva1-app6892/85/Final-demo-48-320.jpg)