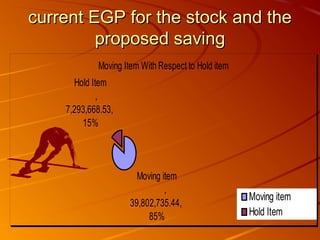
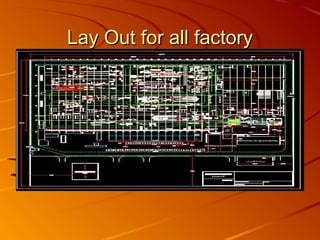
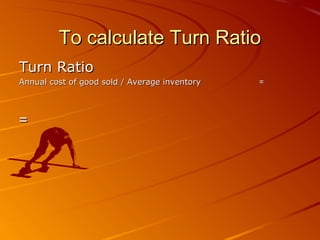
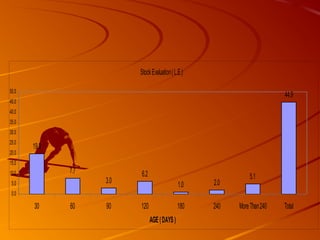
Reduction for inventory F.GReduction for inventory F.G..
Content.Content.
Project CharterProject Charter
Classification for inventoryClassification for inventory
WH area and LayoutWH area and Layout
current EGP for the stock and thecurrent EGP for the stock and the
proposed savingproposed saving
Project CharterProject Charter
Microsoft
Word Document
Classification for inventoryClassification for inventory
Stock evaluationStock evaluation
StockEvaluation(L.E.)
19.8
7.7
3.0
6.2
1.0 2.0
5.1
44.9
0.0
5.0
10.0
15.0
20.0
25.0
30.0
35.0
40.0
45.0
50.0
30 60 90 120 180 240 More Than240 Total
AGE (DAYS )
By short length through DecemberBy short length through December
Stock Evaluation ( L.E.)
967,314.56
325,351.40
324,074.41
354,992.78
210,873.42
27,652.65
216,606.89
2,426,866.12
0.00
500,000.00
1,000,000.00
1,500,000.00
2,000,000.00
2,500,000.00
3,000,000.00
30 60 90 120 180 240 More
Than 240
Total
AGE ( DAYS )
Stock Evaluation ( L.E.)
current EGP for the stock and thecurrent EGP for the stock and the
proposed savingproposed saving
Moving Item With Respect to Hold item
Moving item
,
39,802,735.44,
85%
Hold Item
,
7,293,668.53,
15%
Moving item
Hold Item
Over view for F.G. StoreOver view for F.G. Store
Lay Out for all factoryLay Out for all factory
Average Inventory = 44.886 L.EAverage Inventory = 44.886 L.E
Capital Cost = 10%Capital Cost = 10% ofof average inventoryaverage inventory
==10%10%**44.88644.886
==4.48864.4886L.EL.E
Cost Of Storage =Cost Of Storage = 8%8% ofof average inventoryaverage inventory
==8%8%**44.88644.886
==3.59083.5908L.EL.E
Annual Cost Of Carrying InventoryAnnual Cost Of Carrying Inventory
==Average Inventory* ( Capital Cost + Storage CostAverage Inventory* ( Capital Cost + Storage Cost((
==44.88644.886(*(*4.48864.4886++3.59083.5908((
==362.655362.655L.EL.E..
To calculate Turn RatioTo calculate Turn Ratio
Turn RatioTurn Ratio
==Annual cost of good sold / Average inventoryAnnual cost of good sold / Average inventory
==
Bad HandlingBad Handling
22
BlowerBlower
RackRack100100%%
2210102020
2020
Store Age
19.33
7.84 7.63
3.94
7.32
1.24
6.68
54.0
0.00
10.00
20.00
30.00
40.00
50.00
60.00
30 60 90 120 180 240 More
Than 240
Grand
Total
240240
StockEvaluation(L.E.)
19.8
7.7
3.0
6.2
1.0 2.0
5.1
44.9
0.0
5.0
10.0
15.0
20.0
25.0
30.0
35.0
40.0
45.0
50.0
30 60 90 120 180 240 MoreThan240 Total
AGE(DAYS)
240240240240
1.24
6.68 6.28
14.19
0.00
2.00
4.00
6.00
8.00
10.00
12.00
14.00
16.00
240 More Than 240 Total
1414
1.24
2%
6.68
12%
0.00
1.00
2.00
3.00
4.00
5.00
6.00
7.00
8.00
Value for L.E Percentage
240 More Than 240
Value forL.E
1.24
6.68
54.00
240
More Than 240
Total

F.G. Project