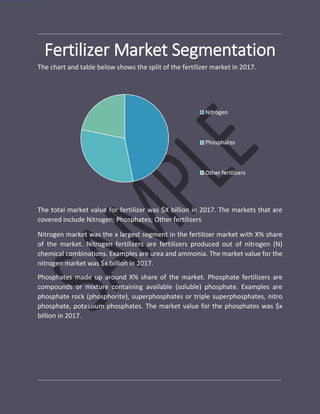
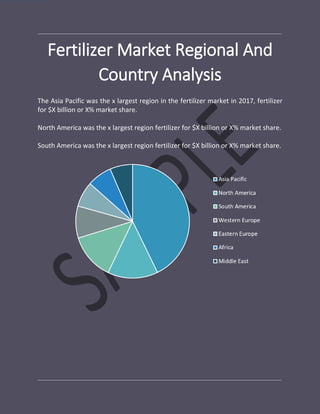
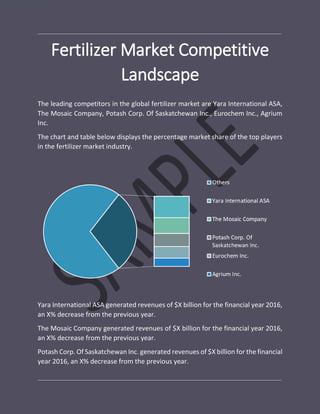
h
Fertilizer
Global Market Report 2018
Including: Nitrogen; Phosphates; Other fertilizers
Covering: Yara International ASA, The Mosaic Company, Potash Corp. Of Saskatchewan Inc,
Eurochem Inc, Agrium Inc
Feb 2018
Reasons to Purchase
• Outperform competitors using accurate up to date demand-side dynamics
information.
• Identify growth segments for investment.
• Facilitate decision making on the basis of historic and forecast data and the
drivers and restraints on the market.
• Create regional and country strategies on the basis of local data and analysis.
• Stay abreast of the latest customer and market research findings
• Benchmark performance against key competitors.
• Develop strategies based on likely future developments.
• Utilize the relationships between key data sets for superior strategizing.
• Suitable for supporting your internal and external presentations with reliable high
quality data and analysis
• Gain a global perspective on the development of the market.
• Report will be updated with the latest data and delivered to you within 3-5
working days of order.
Markets Covered: Nitrogen; Phosphates; Other fertilizers
Companies Mentioned: Yara International ASA, The Mosaic Company, Potash Corp. Of
Saskatchewan Inc., Eurochem Inc., Agrium Inc.
Countries: Brazil, China, France, Germany, India, Italy, Japan, Spain, Russia, UK, USA and
Australia.
Regions: Asia-Pacific, Western Europe, Eastern Europe, North America, South America,
Middle East And Africa
Time series: Five years historic and forecast.
Data: Ratios of market size and growth to related markets, GDP, Expenditure Per Capita,
The Fertilizer Market Indicators Comparison.
Data segmentations: Country and regional historic and forecast data, market share of
competitors, market segments.
Sourcing and Referencing: Data and analysis throughout the report is sourced using end
notes.
Scope
Fertilizer Market Characteristics
A fertilizer is any material of natural or synthetic origin that is applied to soils or to
plants to supply one or more plant nutrients essential to the growth of plants.
Fertilizers market in this report is segmented into nitrogen, phosphate and other
fertilizers manufacturing.
 Nitrogen Manufacturing – Nitrogen fertilizer manufacturers primarily make
nitrogenous fertilizer materials and mix ingredients into fertilizers,
manufacture fertilizers from sewage or animal
 Phosphate Fertilizer Manufacturing – Phosphate fertilizer manufacturers
primarily manufacture phosphatic fertilizer materials and
 Fertilizers (Mixing Only) Manufacturing – Fertilizes manufacturers primarily
mix ingredients from other manufacturers into fertilizers.
The fertilizers industry procures raw materials such as rock phosphate, sulfur and
ammonia from mining companies and natural gas from oil and gas companies to
In this report market value is defined as the revenues organizations earn by selling
their goods and services within the specified market, based on the price at which
they sell. Only goods and services traded between entities are included.
The revenues for a specified geography are consumption values – that is, they are
revenues generated by organizations in the specified geography within the
specified market, irrespective of where they are produced.
Fertilizer Market Historic Growth
The global fertilizer market grew from $X billion in 2013 to $X billion in 2017 at a
compound annual growth rate (CAGR) of X%.
The chart and table below shows the year-on-year growth of the global fertilizer
market during 2013 – 2017.
Drivers of the Market:
The key drivers of the fertilizers industry during the period 2013-2017 included:
Emerging Markets Growth – According to the Pews Research, the world’s middle
class population – defined as that earning between $10 and $100 per day, by the
Low Interest Rate Environment – During the historic period interest rates in most
developed countries were very low. This created a flow of cheap money for
investment, both in developed and developing economies. It also encouraged
Restraints on the Market
The key restraints on the fertilizer industry during the period 2013-2017 included
Safety – Safety regulation and consequent costs were a major concern for the
fertilizer industry. Many of its products are potentially hazardous at some stage
during their manufacture and transport. These fertilizers may be solids, liquids and
Erratic Rainfall – Many countries across the world were affected due to erratic
rainfall due to climate change. During droughts demand for fertilizers decreased as
rain-fed agricultural land is taken out of production. Since many farmers in
Fertilizer Market Forecast
Growth
The global Fertilizer market is expected to grow from $XX billion in 2017 to $412.1
billion in 2021 at a compound annual growth rate (CAGR) of XX%.
The chart and table below shows the year-on-year growth of the global fertilizer
market during 2017 - 2021.
Drivers of the Market
The key drivers of the fertilizer industry during the period 2017-2021 are expected
to include:
Economic Growth – The global economy is expected to go through a continued
period of steady growth during the forecast period. The US economy was already
showing strong growth in 2016, and this is likely to continue during the forecast
Technology – Technology is expected to be a continued driver of market growth
during this period. Areas of particular development are likely to be fertigation and
foliar applications that require micro
Restraints on the Market
The key restraints on the fertilizer industry during 2017-2021 are expected to
include
Interest Rate Increases – Interest rates are expected to increase in developed
nations, particularly the USA and Europe, during the forecast period. This will
decrease the flow of cheap money which has been available for investment in the
forecast period, making it harder and more expensive for companies in capital
Reduction In Free Trade – Many developed and developing economies are
imposing restrictions on free trade to boost their local economy. Brexit is likely to
Fertilizer Market Segmentation
The chart and table below shows the split of the fertilizer market in 2017.
The total market value for fertilizer was $X billion in 2017. The markets that are
covered include Nitrogen; Phosphates; Other fertilizers
Nitrogen market was the x largest segment in the fertilizer market with X% share
of the market. Nitrogen fertilizers are fertilizers produced out of nitrogen (N)
chemical combinations. Examples are urea and ammonia. The market value for the
nitrogen market was $x billion in 2017.
Phosphates made up around X% share of the market. Phosphate fertilizers are
compounds or mixture containing available (soluble) phosphate. Examples are
phosphate rock (phosphorite), superphosphates or triple superphosphates, nitro
phosphate, potassium phosphates. The market value for the phosphates was $x
billion in 2017.
Fertilizer Market Regional And
Country Analysis
The Asia Pacific was the x largest region in the fertilizer market in 2017, fertilizer
for $X billion or X% market share.
North America was the x largest region fertilizer for $X billion or X% market share.
South America was the x largest region fertilizer for $X billion or X% market share.
Fertilizer Market Competitive
Landscape
The leading competitors in the global fertilizer market are Yara International ASA,
The Mosaic Company, Potash Corp. Of Saskatchewan Inc., Eurochem Inc., Agrium
Inc.
The chart and table below displays the percentage market share of the top players
in the fertilizer market industry.
Yara International ASA generated revenues of $X billion for the financial year 2016,
an X% decrease from the previous year.
The Mosaic Company generated revenues of $X billion for the financial year 2016,
an X% decrease from the previous year.
Potash Corp. Of Saskatchewan Inc. generated revenues of $X billion for the financial
year 2016, an X% decrease from the previous year.
Eurochem Inc. generated revenues of $X billion for the financial year 2016, an X%
decrease from the previous year.
Agrium Inc. generated revenues of $X billion for the financial year 2016, an X%
decrease from the previous year.
CF Industries Holdings Inc. generated revenues of $X billion for the financial year
2016, an X% decrease from the previous year.
Coromandel International Ltd. generated revenues of $X billion for the financial
year 2016, an X% decrease from the previous year.
Israel Chemicals Ltd. generated revenues of $X billion for the financial year 2016,
an X% decrease from the previous year.
Sinofert Holdings Ltd. generated revenues of $X billion for the financial year 2016,
an X% decrease from the previous year.
Uralkali generated revenues of $X billion for the financial year 2016, an X%
decrease from the previous year.
Company Profile
Yara International ASA
Overview
Yara International was the largest company in the fertilizer market with a X%
share of the market. The company is involved in the production of nitrogen
fertilizer, dry ice, nitrates, ammonia, urea and other nitrogen based
chemicals. Yara international was founded in 1905 and is headquartered in
Oslo, Norway.
Products and Services
The Downstream segment is involved in the sale, marketing and distribution
of a range of fertilizer and crop nutrition programs.
The Industrial segment develops and markets environmental solutions and
The Upstream segment is involved in the production of ammonia, nitrates
and NPK
The Supply and Trade segment is involved in the procurement of raw
materials, handles ammonia trade and logistics, and manages the company’s
mining
Strategy
Yara international’s growth strategy is to expand its operations through
acquisitions, expansions and reconfigurations at existing sites, and potential
greenfield projects. In August 2016, Yara International acquired Tata
Chemicals’
Financial Performance
Yara international had revenues of NOK X billion ($X billion) for the financial
year 2016, an X% decrease from the
The Mosaic Company
Overview
Products and Services
Strategy
Financial Performance
Potash Corp. Of Saskatchewan Inc.
Overview
Products and Services
Strategy
Financial Performance
Eurochem Inc.
Overview
Products and Services
Strategy
Financial Performance
Agrium Inc.
Overview
Products and Services
Strategy
Financial Performance

Fertilizer global market report 2018 sample

  • 1.
    h Fertilizer Global Market Report2018 Including: Nitrogen; Phosphates; Other fertilizers Covering: Yara International ASA, The Mosaic Company, Potash Corp. Of Saskatchewan Inc, Eurochem Inc, Agrium Inc Feb 2018
  • 2.
    Reasons to Purchase •Outperform competitors using accurate up to date demand-side dynamics information. • Identify growth segments for investment. • Facilitate decision making on the basis of historic and forecast data and the drivers and restraints on the market. • Create regional and country strategies on the basis of local data and analysis. • Stay abreast of the latest customer and market research findings • Benchmark performance against key competitors. • Develop strategies based on likely future developments. • Utilize the relationships between key data sets for superior strategizing. • Suitable for supporting your internal and external presentations with reliable high quality data and analysis • Gain a global perspective on the development of the market. • Report will be updated with the latest data and delivered to you within 3-5 working days of order. Markets Covered: Nitrogen; Phosphates; Other fertilizers Companies Mentioned: Yara International ASA, The Mosaic Company, Potash Corp. Of Saskatchewan Inc., Eurochem Inc., Agrium Inc. Countries: Brazil, China, France, Germany, India, Italy, Japan, Spain, Russia, UK, USA and Australia. Regions: Asia-Pacific, Western Europe, Eastern Europe, North America, South America, Middle East And Africa Time series: Five years historic and forecast. Data: Ratios of market size and growth to related markets, GDP, Expenditure Per Capita, The Fertilizer Market Indicators Comparison. Data segmentations: Country and regional historic and forecast data, market share of competitors, market segments. Sourcing and Referencing: Data and analysis throughout the report is sourced using end notes. Scope
  • 3.
    Fertilizer Market Characteristics Afertilizer is any material of natural or synthetic origin that is applied to soils or to plants to supply one or more plant nutrients essential to the growth of plants. Fertilizers market in this report is segmented into nitrogen, phosphate and other fertilizers manufacturing.  Nitrogen Manufacturing – Nitrogen fertilizer manufacturers primarily make nitrogenous fertilizer materials and mix ingredients into fertilizers, manufacture fertilizers from sewage or animal  Phosphate Fertilizer Manufacturing – Phosphate fertilizer manufacturers primarily manufacture phosphatic fertilizer materials and  Fertilizers (Mixing Only) Manufacturing – Fertilizes manufacturers primarily mix ingredients from other manufacturers into fertilizers. The fertilizers industry procures raw materials such as rock phosphate, sulfur and ammonia from mining companies and natural gas from oil and gas companies to In this report market value is defined as the revenues organizations earn by selling their goods and services within the specified market, based on the price at which they sell. Only goods and services traded between entities are included. The revenues for a specified geography are consumption values – that is, they are revenues generated by organizations in the specified geography within the specified market, irrespective of where they are produced.
  • 4.
    Fertilizer Market HistoricGrowth The global fertilizer market grew from $X billion in 2013 to $X billion in 2017 at a compound annual growth rate (CAGR) of X%. The chart and table below shows the year-on-year growth of the global fertilizer market during 2013 – 2017. Drivers of the Market: The key drivers of the fertilizers industry during the period 2013-2017 included: Emerging Markets Growth – According to the Pews Research, the world’s middle class population – defined as that earning between $10 and $100 per day, by the
  • 5.
    Low Interest RateEnvironment – During the historic period interest rates in most developed countries were very low. This created a flow of cheap money for investment, both in developed and developing economies. It also encouraged Restraints on the Market The key restraints on the fertilizer industry during the period 2013-2017 included Safety – Safety regulation and consequent costs were a major concern for the fertilizer industry. Many of its products are potentially hazardous at some stage during their manufacture and transport. These fertilizers may be solids, liquids and Erratic Rainfall – Many countries across the world were affected due to erratic rainfall due to climate change. During droughts demand for fertilizers decreased as rain-fed agricultural land is taken out of production. Since many farmers in
  • 6.
    Fertilizer Market Forecast Growth Theglobal Fertilizer market is expected to grow from $XX billion in 2017 to $412.1 billion in 2021 at a compound annual growth rate (CAGR) of XX%. The chart and table below shows the year-on-year growth of the global fertilizer market during 2017 - 2021. Drivers of the Market The key drivers of the fertilizer industry during the period 2017-2021 are expected to include: Economic Growth – The global economy is expected to go through a continued period of steady growth during the forecast period. The US economy was already showing strong growth in 2016, and this is likely to continue during the forecast
  • 7.
    Technology – Technologyis expected to be a continued driver of market growth during this period. Areas of particular development are likely to be fertigation and foliar applications that require micro Restraints on the Market The key restraints on the fertilizer industry during 2017-2021 are expected to include Interest Rate Increases – Interest rates are expected to increase in developed nations, particularly the USA and Europe, during the forecast period. This will decrease the flow of cheap money which has been available for investment in the forecast period, making it harder and more expensive for companies in capital Reduction In Free Trade – Many developed and developing economies are imposing restrictions on free trade to boost their local economy. Brexit is likely to
  • 8.
    Fertilizer Market Segmentation Thechart and table below shows the split of the fertilizer market in 2017. The total market value for fertilizer was $X billion in 2017. The markets that are covered include Nitrogen; Phosphates; Other fertilizers Nitrogen market was the x largest segment in the fertilizer market with X% share of the market. Nitrogen fertilizers are fertilizers produced out of nitrogen (N) chemical combinations. Examples are urea and ammonia. The market value for the nitrogen market was $x billion in 2017. Phosphates made up around X% share of the market. Phosphate fertilizers are compounds or mixture containing available (soluble) phosphate. Examples are phosphate rock (phosphorite), superphosphates or triple superphosphates, nitro phosphate, potassium phosphates. The market value for the phosphates was $x billion in 2017.
  • 9.
    Fertilizer Market RegionalAnd Country Analysis The Asia Pacific was the x largest region in the fertilizer market in 2017, fertilizer for $X billion or X% market share. North America was the x largest region fertilizer for $X billion or X% market share. South America was the x largest region fertilizer for $X billion or X% market share.
  • 10.
    Fertilizer Market Competitive Landscape Theleading competitors in the global fertilizer market are Yara International ASA, The Mosaic Company, Potash Corp. Of Saskatchewan Inc., Eurochem Inc., Agrium Inc. The chart and table below displays the percentage market share of the top players in the fertilizer market industry. Yara International ASA generated revenues of $X billion for the financial year 2016, an X% decrease from the previous year. The Mosaic Company generated revenues of $X billion for the financial year 2016, an X% decrease from the previous year. Potash Corp. Of Saskatchewan Inc. generated revenues of $X billion for the financial year 2016, an X% decrease from the previous year.
  • 11.
    Eurochem Inc. generatedrevenues of $X billion for the financial year 2016, an X% decrease from the previous year. Agrium Inc. generated revenues of $X billion for the financial year 2016, an X% decrease from the previous year. CF Industries Holdings Inc. generated revenues of $X billion for the financial year 2016, an X% decrease from the previous year. Coromandel International Ltd. generated revenues of $X billion for the financial year 2016, an X% decrease from the previous year. Israel Chemicals Ltd. generated revenues of $X billion for the financial year 2016, an X% decrease from the previous year. Sinofert Holdings Ltd. generated revenues of $X billion for the financial year 2016, an X% decrease from the previous year. Uralkali generated revenues of $X billion for the financial year 2016, an X% decrease from the previous year. Company Profile Yara International ASA Overview Yara International was the largest company in the fertilizer market with a X% share of the market. The company is involved in the production of nitrogen fertilizer, dry ice, nitrates, ammonia, urea and other nitrogen based chemicals. Yara international was founded in 1905 and is headquartered in Oslo, Norway. Products and Services The Downstream segment is involved in the sale, marketing and distribution of a range of fertilizer and crop nutrition programs. The Industrial segment develops and markets environmental solutions and
  • 12.
    The Upstream segmentis involved in the production of ammonia, nitrates and NPK The Supply and Trade segment is involved in the procurement of raw materials, handles ammonia trade and logistics, and manages the company’s mining Strategy Yara international’s growth strategy is to expand its operations through acquisitions, expansions and reconfigurations at existing sites, and potential greenfield projects. In August 2016, Yara International acquired Tata Chemicals’ Financial Performance Yara international had revenues of NOK X billion ($X billion) for the financial year 2016, an X% decrease from the The Mosaic Company Overview Products and Services Strategy Financial Performance Potash Corp. Of Saskatchewan Inc. Overview Products and Services Strategy Financial Performance
  • 13.
    Eurochem Inc. Overview Products andServices Strategy Financial Performance Agrium Inc. Overview Products and Services Strategy Financial Performance