
More Related Content
What's hot
What's hot (20)
Viewers also liked
Similar to Fctcp Chw Trends 2 1 2007 18 2
Recently uploaded
Recently uploaded (20)
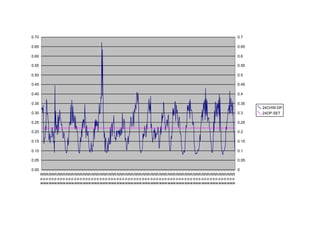
Fctcp Chw Trends 2 1 2007 18 2
- 1. 0.70 0.7 0.65 0.65 0.60 0.6 0.55 0.55 0.50 0.5 0.45 0.45 0.40 0.4 0.35 0.35 24CHW-DP 0.30 0.3 24DP-SET 0.25 0.25 0.20 0.2 0.15 0.15 0.10 0.1 0.05 0.05 0.00 0 RRR RRR RRR RRR RRR RRR RRR RRR RRR RRR RRR RRR RRR RRR RRR RRR RRR RRR RRR RRR RRR RRR RRR ooo ooo ooo ooo ooo ooo ooo ooo ooo ooo ooo ooo ooo ooo ooo ooo ooo ooo ooo ooo ooo ooo ooo www www www www www www www www www www www www www www www www www www www www www www www
- 3. 0056CHW 0056CT 0056SCHP 24CHW-DP 58CHW-DP 60CHW-DP CWS-TSET CHP4-VFD CHP5-VFD CHP6-VFD 24DP-SET 58DP-SET 60DP-SET CH1-RLA CH2-RLA CHW-DT CHP4-S CHP5-S CHP6-S CWS-T CHR-T CHS-T DATE OA-H OA-T TIME 10:04 2/1/07 41.9 50.5 -0.1 78.0 0.0 53.3 58.8 72.0 72.0 0.33 0.22 4.34 0.90 3.01 2.00 1 1 0 60.4 60.4 0.0 10:05 2/1/07 41.9 50.5 -0.1 78.7 0.0 53.3 59.0 72.0 72.0 0.32 0.22 4.48 0.90 3.04 2.00 1 1 0 60.3 60.3 0.0 10:06 2/1/07 41.9 50.6 -0.1 76.6 0.0 53.3 60.4 72.0 72.0 0.33 0.22 4.61 0.90 3.03 2.00 1 1 0 60.3 60.3 0.0 10:07 2/1/07 42.0 50.6 -0.1 76.6 0.0 53.3 59.5 72.0 72.0 0.30 0.22 4.72 0.90 3.05 2.00 1 1 0 60.2 60.2 0.0 10:08 2/1/07 42.2 50.6 0.1 73.8 0.0 53.3 59.4 72.0 72.0 0.34 0.22 4.79 0.90 3.04 2.00 1 1 0 59.8 59.8 0.0 10:09 2/1/07 42.2 50.5 0.3 68.4 0.0 53.3 59.0 72.0 72.0 0.20 0.22 4.95 0.90 3.01 2.00 1 1 0 60.5 60.5 0.0 10:10 2/1/07 42.2 50.5 0.2 69.5 0.0 53.3 59.0 72.0 72.0 0.14 0.22 5.03 0.90 2.98 2.00 1 1 0 60.8 60.8 0.0 10:11 2/1/07 42.2 50.5 0.2 69.5 0.0 53.3 59.5 71.8 72.0 0.17 0.22 5.22 0.90 3.03 2.00 1 1 0 60.8 60.8 0.0 10:12 2/1/07 42.1 50.6 0.2 67.0 0.0 53.3 59.2 71.8 72.0 0.16 0.22 5.31 0.90 3.03 2.00 1 1 0 60.8 60.8 0.0 10:13 2/1/07 41.9 50.6 0.0 72.3 0.0 53.3 59.6 72.0 72.0 0.17 0.22 5.39 0.90 3.06 2.00 1 1 0 60.7 60.7 0.0 10:14 2/1/07 41.8 50.6 -0.2 72.3 0.0 53.4 59.6 72.0 72.0 0.23 0.22 5.63 0.90 3.08 2.00 1 1 0 60.8 60.8 0.0 10:15 2/1/07 41.8 50.6 -0.3 78.0 0.0 53.4 58.8 72.0 72.0 0.21 0.22 5.50 0.90 3.06 2.00 1 1 0 60.7 60.7 0.0 10:16 2/1/07 41.8 50.6 -0.3 76.6 0.0 53.4 59.1 72.1 72.0 0.37 0.22 5.72 0.90 3.16 2.00 1 1 0 59.7 59.7 0.0 10:17 2/1/07 41.8 50.6 -0.2 76.6 0.0 53.4 58.9 72.2 72.0 0.36 0.22 5.68 0.90 3.15 2.00 1 1 0 59.6 59.6 0.0 10:18 2/1/07 41.9 50.6 -0.2 76.2 0.0 53.6 58.7 72.2 72.0 0.29 0.22 5.52 0.90 3.12 2.00 1 1 0 59.8 59.8 0.0 10:19 2/1/07 41.8 50.6 -0.2 76.2 0.0 53.6 58.2 72.1 72.0 0.30 0.22 5.45 0.90 3.10 2.00 1 1 0 59.6 59.6 0.0 10:20 2/1/07 41.9 50.6 -0.2 78.0 0.0 53.6 58.0 72.1 72.0 0.26 0.22 5.29 0.90 3.04 2.00 1 1 0 59.7 59.7 0.0 10:21 2/1/07 41.8 50.5 -0.2 78.0 0.0 53.6 58.7 72.1 72.0 0.26 0.22 5.05 0.90 3.04 2.00 1 1 0 59.7 59.7 0.0 10:22 2/1/07 41.9 50.6 -0.1 78.0 0.0 53.6 58.8 72.1 72.0 0.16 0.22 4.79 0.90 3.00 2.00 1 1 0 60.2 60.2 0.0 10:23 2/1/07 42.0 50.6 0.1 69.9 0.0 53.7 58.8 72.1 72.0 0.17 0.22 4.54 0.90 2.95 2.00 1 1 0 60.1 60.1 0.0 10:24 2/1/07 42.2 50.6 0.2 69.9 0.0 53.7 58.4 72.0 72.0 0.19 0.22 4.29 0.90 2.93 2.00 1 1 0 60.1 60.1 0.0 10:25 2/1/07 42.2 50.6 0.2 67.4 0.0 53.7 58.6 72.0 72.0 0.14 0.22 3.97 0.90 2.87 2.00 1 1 0 60.4 60.4 0.0 10:26 2/1/07 42.2 50.6 0.2 66.3 0.0 53.7 58.7 71.8 72.0 0.16 0.22 3.84 0.90 2.88 2.00 1 1 0 60.4 60.4 0.0 10:27 2/1/07 42.1 50.6 0.2 66.3 0.0 53.7 58.6 71.8 72.0 0.18 0.22 3.87 0.90 2.91 2.00 1 1 0 60.4 60.4 0.0 10:28 2/1/07 41.9 50.6 0.1 67.4 0.0 53.7 59.3 72.0 72.0 0.17 0.22 3.88 0.90 2.92 2.00 1 1 0 60.5 60.5 0.0 10:29 2/1/07 41.8 50.7 -0.1 67.4 0.0 53.8 58.7 72.0 72.0 0.20 0.22 3.90 0.90 2.92 2.00 1 1 0 60.4 60.4 0.0 10:30 2/1/07 41.8 50.7 -0.1 71.3 0.0 53.8 58.5 72.1 72.0 0.22 0.22 3.92 0.90 2.92 2.00 1 1 0 60.3 60.3 0.0 10:31 2/1/07 41.8 50.7 -0.2 72.7 0.0 53.8 58.5 72.1 72.0 0.21 0.22 3.93 0.90 2.94 2.00 1 1 0 60.3 60.3 0.0 10:32 2/1/07 41.8 50.7 -0.2 73.8 0.0 53.8 58.4 72.1 72.0 0.17 0.22 3.90 0.90 2.92 2.00 1 1 0 60.6 60.6 0.0 10:33 2/1/07 41.8 50.6 -0.3 73.8 0.0 53.8 59.3 72.2 72.0 0.20 0.22 3.90 0.90 2.93 2.00 1 1 0 60.4 60.4 0.0 10:34 2/1/07 41.8 50.6 -0.3 78.7 0.0 53.8 59.4 72.2 72.0 0.14 0.22 3.82 0.90 2.88 2.00 1 1 0 60.8 60.8 0.0 10:35 2/1/07 41.8 50.6 -0.3 77.7 0.0 53.8 58.7 72.2 72.0 0.15 0.22 3.77 0.90 2.84 2.00 1 1 0 60.9 60.9 0.0 10:36 2/1/07 41.8 50.5 -0.2 78.4 0.0 53.8 58.3 72.1 72.0 0.09 0.22 3.72 0.90 2.82 2.00 1 1 0 61.2 61.3 0.0 10:37 2/1/07 41.8 50.5 -0.2 78.4 0.0 53.8 58.6 72.1 72.0 0.45 0.22 4.00 0.90 2.91 2.00 1 1 0 59.6 59.6 0.0 10:38 2/1/07 41.8 50.5 -0.2 78.4 0.0 53.8 58.7 72.1 72.0 0.20 0.22 4.00 0.90 2.82 2.00 1 1 0 60.8 60.8 0.0 10:39 2/1/07 41.9 50.5 -0.2 77.7 0.0 53.8 58.4 72.1 72.0 0.31 0.22 4.19 0.90 2.88 2.00 1 1 0 60.2 60.2 0.0 10:40 2/1/07 41.9 50.5 -0.1 77.7 0.0 53.8 58.9 72.0 72.0 0.24 0.22 4.33 0.90 2.88 2.00 1 1 0 60.4 60.4 0.0 10:41 2/1/07 42.0 50.4 0.0 75.9 0.0 53.8 58.6 72.0 72.0 0.21 0.22 4.32 0.90 2.83 2.00 1 1 0 60.5 60.5 0.0 10:42 2/1/07 42.0 50.5 0.0 73.8 0.0 53.7 58.6 72.0 72.0 0.24 0.22 4.82 0.90 2.98 2.00 1 1 0 60.4 60.4 0.0 10:43 2/1/07 42.0 50.4 0.0 69.5 0.0 53.7 58.5 71.8 72.0 0.18 0.22 4.85 0.90 2.97 2.00 1 1 0 60.7 60.7 0.0 10:44 2/1/07 42.0 50.5 0.0 69.5 0.0 53.7 58.9 71.8 72.0 0.27 0.22 5.13 0.90 3.02 2.00 1 1 0 60.4 60.4 0.0 10:45 2/1/07 42.0 50.5 0.0 71.6 0.0 53.7 58.7 72.0 72.0 0.29 0.22 5.28 0.90 3.05 2.00 1 1 0 60.1 60.1 0.0 10:46 2/1/07 42.1 50.5 0.1 73.1 0.0 53.7 59.1 72.0 72.0 0.19 0.22 5.33 0.90 3.03 2.00 1 1 0 60.6 60.6 0.0 10:47 2/1/07 42.1 50.5 0.1 72.0 0.0 53.8 59.8 72.0 72.0 0.28 0.22 5.49 0.90 3.08 2.00 1 1 0 60.1 60.1 0.0 10:48 2/1/07 42.1 50.5 0.1 72.0 0.0 53.8 59.2 71.8 72.0 0.26 0.22 5.45 0.90 3.08 2.00 1 1 0 60.1 60.1 0.0 10:49 2/1/07 42.2 50.5 0.2 70.9 0.0 53.8 59.4 71.8 72.0 0.32 0.22 5.56 0.90 3.13 2.00 1 1 0 60.1 60.1 0.0 10:50 2/1/07 42.2 50.6 0.2 70.9 0.0 53.8 58.9 72.1 72.0 0.28 0.22 5.50 0.90 3.11 2.00 1 1 0 59.8 59.8 0.0 10:51 2/1/07 42.1 50.6 0.2 67.4 0.0 53.8 57.4 72.0 72.0 0.27 0.22 5.45 0.90 3.08 2.00 1 1 0 59.8 59.8 0.0
- 4. 10:52 2/1/07 41.8 50.6 0.0 72.7 0.0 53.8 56.8 72.0 72.0 0.26 0.22 5.39 0.90 3.09 2.00 1 1 0 59.8 59.8 0.0 10:53 2/1/07 41.6 50.6 -0.2 72.7 0.0 53.7 56.7 71.8 72.0 0.24 0.22 5.22 0.90 3.06 2.00 1 1 0 59.8 59.8 0.0 10:54 2/1/07 41.8 50.7 -0.3 76.6 0.0 53.7 57.1 72.1 72.0 0.24 0.22 5.04 0.90 3.03 2.00 1 1 0 59.7 59.7 0.0 10:55 2/1/07 41.9 50.6 -0.2 73.4 0.0 53.7 57.6 72.2 72.0 0.21 0.22 4.75 0.90 3.00 2.00 1 1 0 59.9 59.9 0.0 10:56 2/1/07 42.1 50.6 0.0 71.3 0.0 53.7 57.6 72.1 72.0 0.21 0.22 4.47 0.90 2.99 2.00 1 1 0 59.9 59.9 0.0 10:57 2/1/07 42.2 50.6 0.1 71.3 0.0 53.7 57.5 72.1 72.0 0.17 0.22 4.12 0.90 2.92 2.00 1 1 0 60.2 60.2 0.0 10:58 2/1/07 42.2 50.6 0.2 68.1 0.0 53.7 57.4 72.0 72.0 0.17 0.22 3.91 0.90 2.91 2.00 1 1 0 60.3 60.3 0.0 10:59 2/1/07 42.0 50.6 0.1 71.6 0.0 53.7 56.9 72.0 72.0 0.20 0.22 3.86 0.90 2.92 2.00 1 1 0 60.2 60.2 0.0 11:00 2/1/07 41.8 50.6 -0.1 71.6 0.0 53.8 57.8 72.0 72.0 0.19 0.22 3.90 0.90 2.93 2.00 1 1 0 60.3 60.3 0.0 11:01 2/1/07 41.6 50.7 -0.3 77.7 0.0 53.8 58.3 72.0 72.0 0.17 0.22 3.84 0.90 2.89 2.00 1 1 0 60.5 60.5 0.0 11:02 2/1/07 41.8 50.7 -0.3 77.7 0.0 53.8 57.6 72.1 72.0 0.15 0.22 3.79 0.90 2.88 2.00 1 1 0 60.6 60.6 0.0 11:03 2/1/07 41.9 50.7 -0.1 77.7 0.0 53.8 57.3 72.1 72.0 0.11 0.22 3.75 0.90 2.85 2.00 1 1 0 61.0 61.0 0.0 11:04 2/1/07 42.0 50.7 -0.1 78.4 0.0 53.8 56.9 72.1 72.0 0.11 0.22 3.70 0.90 2.82 2.00 1 1 0 61.1 61.1 0.0 11:05 2/1/07 42.0 50.6 0.0 78.4 0.0 53.8 56.9 72.1 72.0 0.09 0.22 3.69 0.90 2.81 2.00 1 1 0 61.4 61.4 0.0 11:06 2/1/07 41.9 50.5 -0.1 78.4 0.0 53.8 57.7 72.1 72.0 0.09 0.22 3.71 0.90 2.82 2.00 1 1 0 61.6 61.6 0.0 11:07 2/1/07 41.9 50.5 -0.1 78.0 0.0 53.8 56.6 72.1 72.0 0.10 0.22 3.73 0.90 2.82 2.00 1 1 0 61.7 61.7 0.0 11:08 2/1/07 41.9 50.5 -0.1 77.3 0.0 53.7 56.8 72.0 72.0 0.12 0.22 3.88 0.90 2.86 2.00 1 1 0 61.8 61.8 0.0 11:09 2/1/07 42.0 50.5 -0.1 73.8 0.0 53.7 56.6 72.0 72.0 0.17 0.22 4.05 0.90 2.90 2.00 1 1 0 61.7 61.7 0.0 11:10 2/1/07 42.1 50.5 0.1 73.8 0.0 53.7 56.4 72.0 72.0 0.13 0.22 4.26 0.90 2.91 2.00 1 1 0 62.0 62.0 0.0 11:11 2/1/07 42.2 50.5 0.2 67.4 0.0 53.7 56.9 71.8 72.0 0.15 0.22 4.46 0.90 2.95 2.00 1 1 0 62.0 62.0 0.0 11:12 2/1/07 42.1 50.5 0.1 67.4 0.0 53.8 57.2 71.8 72.0 0.22 0.22 4.57 0.90 2.98 2.00 1 1 0 61.7 61.7 0.0 11:13 2/1/07 42.1 50.4 0.2 67.4 0.0 53.8 57.2 71.8 72.0 0.24 0.22 4.84 0.90 3.03 2.00 1 1 0 61.6 61.6 0.0 11:14 2/1/07 42.1 50.5 0.1 67.7 0.0 53.8 55.8 71.8 72.0 0.25 0.22 5.06 0.90 3.05 2.00 1 1 0 61.4 61.4 0.0 11:15 2/1/07 42.1 50.5 0.1 67.7 0.0 53.8 55.0 71.8 72.0 0.24 0.22 5.18 0.90 3.05 2.00 1 1 0 61.4 61.4 0.0 11:16 2/1/07 42.0 50.6 0.0 66.3 0.0 53.8 55.3 71.8 72.0 0.34 0.22 5.41 0.90 3.11 2.00 1 1 0 60.8 60.8 0.0 11:17 2/1/07 42.0 50.6 0.0 71.6 0.0 53.8 55.3 71.8 72.0 0.24 0.22 5.34 0.90 3.05 2.00 1 1 0 60.3 61.2 0.0 11:18 2/1/07 42.0 50.6 0.0 68.4 0.0 53.8 55.3 72.1 72.0 0.27 0.22 5.35 0.90 3.08 2.00 1 1 0 60.9 60.9 0.0 11:19 2/1/07 42.0 50.7 0.1 68.4 0.0 53.8 55.3 72.1 72.0 0.37 0.22 5.47 0.90 3.13 2.00 1 1 0 60.3 60.3 0.0 11:20 2/1/07 42.0 50.7 0.0 71.3 0.0 53.8 55.0 72.0 72.0 0.29 0.22 5.38 0.90 3.09 2.00 1 1 0 60.6 60.6 0.0 11:21 2/1/07 41.9 50.7 -0.1 68.4 0.0 53.8 55.2 72.1 72.0 0.25 0.22 5.39 0.90 3.10 2.00 1 1 0 60.7 60.7 0.0 11:22 2/1/07 41.8 50.7 -0.1 68.4 0.0 53.9 55.5 72.1 72.0 0.33 0.22 5.48 0.90 3.16 2.00 1 1 0 60.1 60.1 0.0 11:23 2/1/07 41.8 50.7 -0.2 72.3 0.0 54.0 54.2 72.2 72.0 0.25 0.22 5.23 0.90 3.06 2.00 1 1 0 60.3 60.3 0.0 11:24 2/1/07 41.8 50.7 -0.3 79.1 0.0 54.1 54.4 72.2 72.0 0.26 0.22 5.14 0.90 3.05 2.00 1 1 0 59.9 59.9 0.0 11:25 2/1/07 41.9 50.7 -0.2 79.1 0.0 54.1 54.7 72.2 72.0 0.29 0.22 5.04 0.90 3.04 2.00 1 1 0 60.0 60.0 0.0 11:26 2/1/07 41.9 50.7 -0.1 74.1 0.0 54.3 55.3 72.2 72.0 0.23 0.22 4.86 0.90 3.01 2.00 1 1 0 60.2 60.2 0.0 11:27 2/1/07 41.9 50.7 -0.1 77.7 0.0 54.4 54.4 72.2 72.0 0.22 0.22 4.79 0.90 3.01 2.00 1 1 0 60.2 60.2 0.0 11:28 2/1/07 41.9 50.7 -0.1 74.5 0.0 54.4 53.9 72.2 72.0 0.28 0.22 4.74 0.90 3.04 2.00 1 1 0 59.8 59.8 0.0 11:29 2/1/07 42.0 50.7 0.0 74.5 0.0 54.4 55.0 72.2 72.0 0.21 0.22 4.52 0.90 2.98 2.00 1 1 0 60.1 60.1 0.0 11:30 2/1/07 42.1 50.7 0.0 70.9 0.0 54.3 54.7 72.0 72.0 0.23 0.22 4.40 0.90 2.99 2.00 1 1 0 60.1 60.1 0.0 11:31 2/1/07 42.1 50.7 0.1 73.8 0.0 54.2 54.9 72.0 72.0 0.23 0.22 4.22 0.90 2.95 2.00 1 1 0 60.1 60.1 0.0 11:32 2/1/07 42.2 50.7 0.1 73.8 0.0 54.1 54.9 72.0 72.0 0.20 0.22 4.08 0.90 2.95 2.00 1 1 0 60.2 60.2 0.0 11:33 2/1/07 42.2 50.7 0.2 67.7 0.0 54.1 54.9 71.7 72.0 0.19 0.22 3.90 0.90 2.93 2.00 1 1 0 60.3 60.3 0.0 11:34 2/1/07 42.2 50.8 0.2 66.3 0.0 54.0 56.6 71.8 72.0 0.16 0.22 3.84 0.90 2.89 2.00 1 1 0 60.6 60.6 0.0 11:35 2/1/07 42.2 50.8 0.2 66.3 0.0 54.0 56.3 71.8 72.0 0.13 0.22 3.78 0.90 2.87 2.00 1 1 0 60.8 60.8 0.0 11:36 2/1/07 41.8 50.8 0.2 66.3 0.0 54.0 56.4 71.8 72.0 0.10 0.22 3.71 0.90 2.82 2.00 1 1 0 61.2 61.2 0.0 11:37 2/1/07 41.5 50.8 -0.3 80.1 0.0 53.9 57.2 71.8 72.0 0.09 0.22 3.67 0.90 2.78 2.00 1 1 0 61.4 61.4 0.0 11:38 2/1/07 41.8 50.8 -0.5 80.1 0.0 53.9 57.7 72.0 72.0 0.09 0.22 3.65 0.90 2.81 2.00 1 1 0 61.6 61.6 0.0 11:39 2/1/07 42.1 50.8 -0.1 73.1 0.0 53.9 57.8 72.2 72.0 0.12 0.22 3.77 0.90 2.86 2.00 1 1 0 61.6 61.6 0.0 11:40 2/1/07 42.2 50.8 0.1 68.4 0.0 53.9 57.0 72.2 72.0 0.17 0.22 3.86 0.90 2.91 2.00 1 1 0 61.5 61.5 0.0 11:41 2/1/07 42.2 50.7 0.2 69.5 0.0 53.9 56.4 72.0 72.0 0.15 0.22 3.84 0.90 2.89 2.00 1 1 0 61.4 61.4 0.0 11:42 2/1/07 42.1 50.7 0.2 69.5 0.0 53.9 56.8 71.8 72.0 0.15 0.22 3.86 0.90 2.92 2.00 1 1 0 61.8 61.8 0.0 11:43 2/1/07 41.9 50.6 0.0 73.4 0.0 53.9 57.2 72.1 72.0 0.22 0.22 4.16 0.90 2.96 2.00 1 1 0 61.5 61.5 0.0 11:44 2/1/07 41.8 50.7 -0.2 73.4 0.0 53.9 57.7 72.1 72.0 0.17 0.22 4.17 0.90 2.93 2.00 1 1 0 61.7 61.7 0.0 11:45 2/1/07 41.8 50.8 -0.3 79.1 0.0 53.9 58.5 72.2 72.0 0.25 0.22 4.36 0.90 2.98 2.00 1 1 0 61.3 61.3 0.0
- 5. 11:46 2/1/07 41.8 50.7 -0.3 79.1 0.0 54.1 58.3 72.2 72.0 0.22 0.22 4.48 0.90 2.98 2.00 1 1 0 61.5 61.5 0.0 11:47 2/1/07 41.8 50.7 -0.2 78.0 0.0 54.2 57.4 72.2 72.0 0.27 0.22 4.78 0.90 3.04 2.00 1 1 0 61.2 61.2 0.0 11:48 2/1/07 41.8 50.7 -0.2 78.0 0.0 54.3 56.1 72.2 72.0 0.25 0.22 4.70 0.90 3.02 2.00 1 1 0 61.1 61.1 0.0 11:49 2/1/07 41.9 50.6 -0.1 78.7 0.0 54.3 55.9 72.2 72.0 0.27 0.22 4.87 0.90 3.05 2.00 1 1 0 61.0 61.0 0.0 11:50 2/1/07 42.0 50.6 -0.1 78.7 0.0 54.3 55.9 72.1 72.0 0.22 0.22 5.08 0.90 3.06 2.00 1 1 0 61.2 61.2 0.0 11:51 2/1/07 42.1 50.7 0.0 72.7 0.0 54.3 56.0 72.1 72.0 0.35 0.22 5.18 0.90 3.09 2.00 1 1 0 60.4 60.4 0.0 11:52 2/1/07 42.1 50.8 0.1 72.7 0.0 54.3 56.2 72.2 72.0 0.28 0.22 5.11 0.90 3.07 2.00 1 1 0 60.6 60.6 0.0 11:53 2/1/07 42.3 50.9 0.2 69.9 0.0 54.3 56.6 72.1 72.0 0.27 0.22 4.58 0.90 3.04 2.00 1 1 0 60.7 60.7 0.0 11:54 2/1/07 42.3 50.9 0.3 68.1 0.0 54.3 56.8 71.8 72.0 0.17 0.22 3.73 0.90 2.92 2.00 1 1 0 61.2 61.2 0.0 11:55 2/1/07 42.2 50.9 0.2 68.1 0.0 54.4 56.9 71.8 72.0 0.23 0.22 3.72 0.90 2.93 2.00 1 1 0 60.9 60.9 0.0 11:56 2/1/07 42.0 50.9 0.1 67.0 0.0 54.5 55.5 71.8 72.0 0.23 0.22 3.50 0.90 2.92 2.00 1 1 0 60.8 60.8 0.0 11:57 2/1/07 41.9 51.0 -0.1 70.2 0.0 54.5 55.7 72.0 72.0 0.19 0.22 3.23 0.90 2.88 2.00 1 1 0 61.1 61.1 0.0 11:58 2/1/07 41.9 51.0 -0.1 70.2 0.0 54.5 55.5 72.0 72.0 0.18 0.22 3.10 0.90 2.87 2.00 1 1 0 61.2 61.2 0.0 11:59 2/1/07 41.8 51.0 -0.2 69.5 0.0 54.4 55.9 72.0 72.0 0.20 0.22 3.11 0.90 2.88 2.00 1 1 0 61.1 61.1 0.0 12:00 2/1/07 41.5 51.0 -0.4 81.6 0.0 54.4 56.4 72.1 72.0 0.17 0.22 3.07 0.90 2.84 2.00 1 1 0 61.2 61.2 0.0 12:01 2/1/07 41.8 51.1 -0.3 79.8 0.0 54.4 56.4 72.1 72.0 0.14 0.22 2.99 0.90 2.80 2.00 1 1 0 61.6 61.6 0.0 12:02 2/1/07 41.8 51.0 -0.2 79.8 0.0 54.4 56.7 72.2 72.0 0.11 0.22 2.89 0.90 2.80 2.00 1 1 0 61.9 61.9 0.0 12:03 2/1/07 41.9 51.0 -0.1 78.4 0.0 54.4 57.1 72.3 72.0 0.10 0.22 2.84 0.90 2.77 2.00 1 1 0 62.1 62.1 0.0 12:04 2/1/07 42.0 50.9 0.0 78.4 0.0 54.4 56.8 72.1 72.0 0.09 0.22 2.86 0.90 2.78 2.00 1 1 0 62.3 62.3 0.0 12:05 2/1/07 42.0 50.9 0.1 74.5 0.0 54.6 56.9 72.0 72.0 0.11 0.22 2.88 0.90 2.77 2.00 1 1 0 62.4 62.4 0.0 12:06 2/1/07 42.2 50.9 0.1 74.5 0.0 54.7 56.5 72.0 72.0 0.11 0.22 2.92 0.90 2.80 2.00 1 1 0 62.6 62.6 0.0 12:07 2/1/07 42.2 50.8 0.2 68.8 0.0 54.7 54.4 72.1 72.0 0.15 0.22 2.95 0.90 2.81 2.00 1 1 0 62.6 62.6 0.0 12:08 2/1/07 42.2 50.8 0.2 68.8 0.0 54.7 54.6 72.0 72.0 0.12 0.22 2.95 0.90 2.82 2.00 1 1 0 62.8 62.8 0.0 12:09 2/1/07 42.0 50.9 0.2 72.0 0.0 54.7 55.0 71.8 72.0 0.09 0.22 2.90 0.90 2.79 2.00 1 1 0 63.1 63.1 0.0 12:10 2/1/07 41.8 50.9 0.0 72.0 0.0 54.7 54.7 71.8 72.0 0.11 0.22 2.97 0.90 2.85 2.00 1 1 0 63.2 63.2 0.0 12:11 2/1/07 41.6 50.9 -0.2 74.5 0.0 54.7 54.6 72.1 72.0 0.13 0.22 2.96 0.90 2.85 2.00 1 1 0 63.3 63.3 0.0 12:12 2/1/07 41.8 51.0 -0.3 74.8 0.0 54.7 55.3 72.1 72.0 0.13 0.22 3.00 0.90 2.84 2.00 1 1 0 63.4 63.4 0.0 12:13 2/1/07 42.0 51.1 -0.1 73.4 0.0 54.7 55.2 72.1 72.0 0.21 0.22 3.02 0.90 2.87 2.00 1 1 0 63.1 63.1 0.0 12:14 2/1/07 42.1 51.0 0.0 72.0 0.0 54.7 54.7 72.1 72.0 0.22 0.22 3.04 0.90 2.90 2.00 1 1 0 63.1 63.1 0.0 12:15 2/1/07 42.3 51.0 0.1 72.0 0.0 54.7 55.0 72.0 72.0 0.16 0.22 3.05 0.90 2.91 2.00 1 1 0 63.4 63.4 0.0 12:16 2/1/07 42.1 51.0 0.3 70.9 0.0 54.7 55.3 72.0 72.0 0.26 0.22 3.13 0.90 2.96 2.00 1 1 0 62.9 62.9 0.0 12:17 2/1/07 41.8 51.0 0.1 70.9 0.0 54.7 54.6 71.8 72.0 0.21 0.22 3.06 0.90 2.91 2.00 1 1 0 63.1 63.1 0.0 12:18 2/1/07 41.8 51.0 -0.3 81.6 0.0 54.7 54.5 72.0 72.0 0.27 0.22 3.12 0.90 2.95 2.00 1 1 0 62.8 62.8 0.0 12:19 2/1/07 41.8 51.1 -0.3 77.7 0.0 54.7 54.2 72.1 72.0 0.23 0.22 3.03 0.90 2.91 2.00 1 1 0 62.7 62.7 0.0 12:20 2/1/07 41.8 51.2 -0.3 77.7 0.0 54.7 55.4 72.2 72.0 0.26 0.22 3.09 0.90 2.91 2.00 1 1 0 62.7 62.7 0.0 12:21 2/1/07 41.8 51.2 -0.2 75.9 0.0 54.7 54.5 72.1 72.0 0.23 0.22 3.04 0.90 2.90 2.00 1 1 0 62.8 62.8 0.0 12:22 2/1/07 41.9 51.1 -0.2 78.0 0.0 54.7 54.2 72.1 72.0 0.23 0.22 3.06 0.90 2.92 2.00 1 1 0 62.8 62.8 0.0 12:23 2/1/07 41.9 51.1 0.0 78.0 0.0 54.7 55.0 72.0 72.0 0.26 0.22 3.06 0.90 2.93 2.00 1 1 0 62.6 62.6 0.0 12:24 2/1/07 41.9 51.0 -0.1 78.7 0.0 54.7 54.8 72.1 72.0 0.20 0.22 3.31 0.90 2.93 2.00 1 1 0 62.9 62.9 0.0 12:25 2/1/07 41.8 51.0 -0.1 77.7 0.0 54.7 53.7 72.0 72.0 0.29 0.22 3.53 0.90 2.98 2.00 1 1 0 62.4 62.4 0.0 12:26 2/1/07 41.9 51.1 -0.2 79.1 0.0 54.7 52.4 72.0 72.0 0.29 0.22 3.73 0.90 2.98 2.00 1 1 0 62.3 62.3 0.0 12:27 2/1/07 41.8 51.0 -0.2 79.1 0.0 54.7 52.8 72.0 72.0 0.35 0.22 3.89 0.90 3.01 2.00 1 1 0 61.8 61.8 0.0 12:28 2/1/07 41.9 51.1 -0.1 78.0 0.0 54.7 53.6 72.0 72.0 0.29 0.22 4.05 0.90 3.00 2.00 1 1 0 61.5 61.5 0.0 12:29 2/1/07 41.9 51.1 -0.1 78.4 0.0 54.7 53.3 72.0 72.0 0.31 0.22 4.18 0.90 3.04 2.00 1 1 0 61.7 61.7 0.0 12:30 2/1/07 41.9 51.1 -0.1 78.4 0.0 54.8 53.1 71.8 72.0 0.32 0.22 4.40 0.90 3.03 2.00 1 1 0 61.5 61.5 0.0 12:31 2/1/07 41.9 51.1 -0.1 78.0 0.0 54.8 52.2 72.0 72.0 0.39 0.22 4.60 0.90 3.08 2.00 1 1 0 60.9 60.9 0.0 12:32 2/1/07 42.0 51.1 -0.1 78.4 0.0 54.8 51.6 72.1 72.0 0.38 0.22 4.74 0.90 3.07 2.00 1 1 0 60.8 60.8 0.0 12:33 2/1/07 42.2 51.1 0.1 78.4 0.0 54.8 52.8 72.0 72.0 0.67 0.22 4.91 0.90 3.14 2.00 1 1 0 59.1 59.1 0.0 12:34 2/1/07 42.3 51.1 0.3 69.1 0.0 54.8 53.3 72.0 72.0 0.39 0.22 4.58 0.90 2.98 2.00 1 1 0 60.0 60.0 0.0 12:35 2/1/07 42.2 51.2 0.3 67.7 0.0 54.8 53.7 72.0 72.0 0.63 0.22 4.85 0.90 3.12 2.00 1 1 0 58.6 58.6 0.0 12:36 2/1/07 41.9 51.2 0.1 67.7 0.0 54.8 54.4 71.8 72.0 0.43 0.22 4.62 0.90 3.01 2.00 1 1 0 59.3 59.3 0.0 12:37 2/1/07 41.8 51.1 -0.2 73.4 0.0 54.8 54.3 71.8 72.0 0.26 0.22 4.23 0.90 2.87 2.00 1 1 0 60.0 60.0 0.0 12:38 2/1/07 41.6 51.2 -0.4 82.3 0.0 54.8 53.9 72.1 72.0 0.22 0.22 4.09 0.90 2.85 2.00 1 1 0 60.2 60.2 0.0 12:39 2/1/07 41.8 51.2 -0.3 82.3 0.0 54.8 54.7 72.2 72.0 0.17 0.22 3.91 0.90 2.81 2.00 1 1 0 60.5 60.5 0.0
- 6. 12:40 2/1/07 42.0 51.1 -0.1 76.2 0.0 55.0 54.5 72.2 72.0 0.20 0.22 3.70 0.90 2.79 2.00 1 1 0 60.4 60.4 0.0 12:41 2/1/07 42.2 51.1 0.2 70.9 0.0 55.0 54.8 72.1 72.0 0.09 0.22 3.52 0.90 2.76 2.00 1 1 0 61.0 61.0 0.0 12:42 2/1/07 42.2 51.1 0.2 69.1 0.0 55.0 53.9 72.1 72.0 0.16 0.22 3.46 0.90 2.78 2.00 1 1 0 60.6 60.6 0.0 12:43 2/1/07 42.1 51.0 0.2 69.1 0.0 55.0 53.8 72.0 72.0 0.17 0.22 3.31 0.90 2.75 2.00 1 1 0 60.8 60.8 0.0 12:44 2/1/07 41.9 51.0 0.0 67.4 0.0 55.0 54.4 72.0 72.0 0.10 0.22 3.20 0.90 2.74 2.00 1 1 0 61.3 61.3 0.0 12:45 2/1/07 41.5 51.0 -0.4 81.6 0.0 54.9 54.4 72.0 72.0 0.09 0.22 3.07 0.90 2.76 2.00 1 1 0 61.5 61.5 0.0 12:46 2/1/07 41.6 51.1 -0.5 81.6 0.0 54.9 54.9 72.0 72.0 0.09 0.22 2.94 0.90 2.75 2.00 1 1 0 61.7 61.7 0.0 12:47 2/1/07 41.8 51.1 -0.3 79.4 0.0 54.9 55.3 72.2 72.0 0.11 0.22 2.87 0.90 2.78 2.00 1 1 0 61.8 61.8 0.0 12:48 2/1/07 41.8 51.0 -0.2 79.1 0.0 54.9 54.6 72.2 72.0 0.14 0.22 2.85 0.90 2.80 2.00 1 1 0 61.8 61.8 0.0 12:49 2/1/07 42.1 51.0 0.0 79.1 0.0 54.9 54.5 72.1 72.0 0.10 0.22 2.82 0.90 2.79 2.00 1 1 0 62.2 62.2 0.0 12:50 2/1/07 42.2 51.0 0.2 72.7 0.0 55.0 53.5 71.8 72.0 0.17 0.22 2.87 0.90 2.83 2.00 1 1 0 61.9 61.9 0.0 12:51 2/1/07 42.2 51.0 0.3 68.1 0.0 55.0 54.7 72.0 72.0 0.16 0.22 2.89 0.90 2.85 2.00 1 1 0 61.9 61.9 0.0 12:52 2/1/07 42.1 51.0 0.2 71.3 0.0 55.0 53.9 71.8 72.0 0.14 0.22 2.89 0.90 2.84 2.00 1 1 0 62.1 62.1 0.0 12:53 2/1/07 41.9 51.0 -0.1 71.3 0.0 54.9 53.7 71.8 72.0 0.13 0.22 2.88 0.90 2.82 2.00 1 1 0 62.2 62.2 0.0 12:54 2/1/07 41.6 51.0 -0.4 80.1 0.0 54.9 54.5 71.8 72.0 0.22 0.22 2.94 0.90 2.88 2.00 1 1 0 61.8 61.8 0.0 12:55 2/1/07 41.8 51.0 -0.3 75.9 0.0 54.9 53.3 72.1 72.0 0.14 0.22 2.90 0.90 2.85 2.00 1 1 0 62.3 62.3 0.0 12:56 2/1/07 41.8 51.1 -0.2 75.9 0.0 54.9 53.4 72.1 72.0 0.22 0.22 2.97 0.90 2.89 2.00 1 1 0 61.9 61.9 0.0 12:57 2/1/07 41.8 51.1 -0.2 77.0 0.0 54.9 53.5 72.2 72.0 0.23 0.22 2.95 0.90 2.90 2.00 1 1 0 61.9 61.9 0.0 12:58 2/1/07 41.9 51.1 -0.1 77.0 0.0 54.9 53.4 72.1 72.0 0.25 0.22 2.98 0.90 2.92 2.00 1 1 0 61.8 61.8 0.0 12:59 2/1/07 41.9 51.0 -0.1 79.1 0.0 54.9 54.3 72.1 72.0 0.18 0.22 2.95 0.90 2.88 2.00 1 1 0 62.1 62.1 0.0 13:00 2/1/07 42.0 51.0 0.0 74.1 0.0 54.9 53.4 72.1 72.0 0.23 0.22 3.05 0.90 2.92 2.00 1 1 0 61.9 61.9 0.0 13:01 2/1/07 42.2 51.0 0.2 69.5 0.0 54.9 53.4 72.1 72.0 0.25 0.22 3.22 0.90 2.93 2.00 1 1 0 61.8 61.8 0.0 13:02 2/1/07 42.3 51.1 0.2 69.5 0.0 55.0 54.0 72.0 72.0 0.25 0.22 3.37 0.90 2.95 2.00 1 1 0 61.7 61.7 0.0 13:03 2/1/07 42.3 51.1 0.2 67.4 0.0 55.0 53.1 72.0 72.0 0.29 0.22 3.54 0.90 2.97 2.00 1 1 0 61.4 61.4 0.0 13:04 2/1/07 42.1 51.1 0.2 68.1 0.0 55.0 53.5 71.8 72.0 0.19 0.22 3.69 0.90 2.93 2.00 1 1 0 61.9 61.9 0.0 13:05 2/1/07 41.9 51.0 0.1 68.1 0.0 55.0 53.5 71.8 72.0 0.18 0.22 3.81 0.90 2.92 2.00 1 1 0 61.9 61.9 0.0 13:06 2/1/07 41.8 51.1 -0.2 71.6 0.0 55.0 52.7 72.1 72.0 0.16 0.22 3.99 0.90 2.93 2.00 1 1 0 62.1 62.1 0.0 13:07 2/1/07 41.5 51.1 -0.4 78.7 0.0 55.0 53.0 72.1 72.0 0.17 0.22 4.05 0.90 2.92 2.00 1 1 0 62.1 62.1 0.0 13:08 2/1/07 41.8 51.1 -0.4 78.7 0.0 55.0 53.3 72.1 72.0 0.15 0.22 4.24 0.90 2.94 2.00 1 1 0 62.3 62.3 0.0 13:09 2/1/07 41.8 51.1 -0.3 78.0 0.0 55.0 53.5 72.2 72.0 0.19 0.22 4.44 0.90 2.97 2.00 1 1 0 62.2 62.2 0.0 13:10 2/1/07 42.0 51.1 -0.1 73.4 0.0 55.0 53.9 72.1 72.0 0.21 0.22 4.43 0.90 2.96 2.00 1 1 0 62.1 62.1 0.0 13:11 2/1/07 42.0 51.1 0.0 73.1 0.0 55.1 53.3 72.1 72.0 0.17 0.22 4.45 0.90 2.98 2.00 1 1 0 62.3 62.3 0.0 13:12 2/1/07 41.9 51.0 0.0 73.1 0.0 55.1 53.5 72.0 72.0 0.20 0.22 4.50 0.90 2.99 2.00 1 1 0 62.2 62.2 0.0 13:13 2/1/07 41.9 51.0 -0.1 76.2 0.0 55.1 53.8 72.0 72.0 0.20 0.22 4.46 0.90 2.97 2.00 1 1 0 62.3 62.3 0.0 13:14 2/1/07 41.9 51.0 -0.1 75.5 0.0 55.1 53.4 72.1 72.0 0.21 0.22 4.30 0.90 2.96 2.00 1 1 0 62.3 62.3 0.0 13:15 2/1/07 41.9 51.1 -0.1 75.5 0.0 55.1 53.3 72.0 72.0 0.19 0.22 4.16 0.90 2.95 2.00 1 1 0 62.3 62.3 0.0 13:16 2/1/07 41.9 51.1 -0.1 75.5 0.0 55.2 53.1 71.8 72.0 0.21 0.22 4.07 0.90 2.96 2.00 1 1 0 62.3 62.3 0.0 13:17 2/1/07 41.9 51.1 -0.1 76.2 0.0 55.2 53.0 72.0 72.0 0.17 0.22 3.88 0.90 2.91 2.00 1 1 0 62.5 62.5 0.0 13:18 2/1/07 41.9 51.1 -0.1 75.9 0.0 55.2 54.1 71.8 72.0 0.21 0.22 3.72 0.90 2.93 2.00 1 1 0 62.3 62.3 0.0 13:19 2/1/07 41.9 51.1 -0.2 75.9 0.0 55.2 53.8 72.0 72.0 0.19 0.22 3.54 0.90 2.88 2.00 1 1 0 62.5 62.5 0.0 13:20 2/1/07 42.0 51.1 -0.1 76.6 0.0 55.2 53.7 72.0 72.0 0.18 0.22 3.45 0.90 2.91 2.00 1 1 0 62.5 62.5 0.0 13:21 2/1/07 42.2 51.2 0.1 71.6 0.0 55.3 54.0 72.0 72.0 0.22 0.22 3.34 0.90 2.90 2.00 1 1 0 62.3 62.3 0.0 13:22 2/1/07 42.3 51.2 0.3 71.6 0.0 55.3 54.0 72.0 72.0 0.20 0.22 3.26 0.90 2.90 2.00 1 1 0 62.4 62.4 0.0 13:23 2/1/07 42.1 51.2 0.2 67.4 0.0 55.3 53.0 72.0 72.0 0.19 0.22 3.05 0.90 2.87 2.00 1 1 0 62.5 62.5 0.0 13:24 2/1/07 41.8 51.2 -0.1 73.4 0.0 55.3 53.4 71.8 72.0 0.30 0.22 3.09 0.90 2.94 2.00 1 1 0 62.0 62.0 0.0 13:25 2/1/07 41.6 51.2 -0.3 73.4 0.0 55.4 52.9 72.0 72.0 0.24 0.22 3.03 0.90 2.91 2.00 1 1 0 62.2 62.2 0.0 13:26 2/1/07 41.8 51.3 -0.4 75.5 0.0 55.5 52.0 72.2 72.0 0.22 0.22 3.01 0.90 2.89 2.00 1 1 0 61.9 61.9 0.0 13:27 2/1/07 41.8 51.2 -0.2 77.0 0.0 55.6 52.3 72.2 72.0 0.22 0.22 3.06 0.90 2.92 2.00 1 1 0 62.3 62.3 0.0 13:28 2/1/07 42.0 51.3 -0.1 77.0 0.0 55.8 51.8 72.1 72.0 0.27 0.22 3.06 0.90 2.93 2.00 1 1 0 61.9 61.9 0.0 13:29 2/1/07 41.9 51.1 -0.1 73.8 0.0 55.8 50.3 72.0 72.0 0.26 0.22 3.05 0.90 2.92 2.00 1 1 0 61.9 61.9 0.0 13:30 2/1/07 41.9 51.2 -0.1 78.7 0.0 55.8 50.6 72.1 72.0 0.24 0.22 3.06 0.90 2.91 2.00 1 1 0 62.0 62.0 0.0 13:31 2/1/07 41.9 51.1 -0.1 77.0 0.0 55.8 51.0 72.1 72.0 0.16 0.22 2.94 0.90 2.86 2.00 1 1 0 62.4 62.4 0.0 13:32 2/1/07 41.9 51.2 -0.1 77.0 0.0 55.8 50.9 72.1 72.0 0.17 0.22 2.97 0.90 2.86 2.00 1 1 0 62.4 62.4 0.0 13:33 2/1/07 41.9 51.2 -0.1 76.6 0.0 55.8 50.4 72.1 72.0 0.15 0.22 2.95 0.90 2.83 2.00 1 1 0 62.6 62.6 0.0
- 7. 13:34 2/1/07 42.0 51.2 -0.1 78.4 0.0 55.8 50.9 72.1 72.0 0.11 0.22 2.89 0.90 2.81 2.00 1 1 0 62.9 62.9 0.0 13:35 2/1/07 42.3 51.1 0.2 78.4 0.0 55.7 50.8 72.2 72.0 0.10 0.22 2.90 0.90 2.80 2.00 1 1 0 63.1 63.1 0.0 13:36 2/1/07 42.3 51.1 0.2 67.7 0.0 55.6 51.2 72.0 72.0 0.13 0.22 2.92 0.90 2.83 2.00 1 1 0 63.1 63.1 0.0 13:37 2/1/07 42.2 51.0 0.2 67.4 0.0 55.5 51.8 71.7 72.0 0.16 0.22 2.95 0.90 2.83 2.00 1 1 0 63.1 63.1 0.0 13:38 2/1/07 41.8 51.1 -0.3 67.4 0.0 55.4 52.0 71.7 72.0 0.18 0.22 2.94 0.90 2.85 2.00 1 1 0 63.1 63.1 0.0 13:39 2/1/07 41.6 51.1 -0.5 78.7 0.0 55.4 51.6 71.8 72.0 0.14 0.22 2.94 0.90 2.85 2.00 1 1 0 63.4 63.4 0.0 13:40 2/1/07 41.8 51.2 -0.3 75.9 0.0 55.4 51.5 72.0 72.0 0.17 0.22 2.95 0.90 2.85 2.00 1 1 0 63.4 63.4 0.0 13:41 2/1/07 41.9 51.1 -0.1 75.9 0.0 55.4 51.8 72.1 72.0 0.19 0.22 2.95 0.90 2.86 2.00 1 1 0 63.3 63.3 0.0 13:42 2/1/07 41.9 51.2 -0.1 78.7 0.0 55.4 52.0 72.1 72.0 0.19 0.22 3.04 0.90 2.91 2.00 1 1 0 63.4 63.4 0.0 13:43 2/1/07 42.0 51.2 0.0 77.3 0.0 55.4 52.6 71.8 72.0 0.23 0.22 3.00 0.90 2.91 2.00 1 1 0 63.2 63.2 0.0 13:44 2/1/07 42.2 51.1 0.2 68.8 0.0 55.3 52.8 72.0 72.0 0.25 0.22 3.06 0.90 2.92 2.00 1 1 0 63.1 63.1 0.0 13:45 2/1/07 42.3 51.1 0.2 68.8 0.0 55.2 52.7 71.8 72.0 0.28 0.22 3.07 0.90 2.93 2.00 1 1 0 62.8 62.8 0.0 13:46 2/1/07 42.2 51.2 0.2 67.4 0.0 55.0 52.6 71.8 72.0 0.27 0.22 3.04 0.90 2.92 2.00 1 1 0 62.8 62.8 0.0 13:47 2/1/07 41.8 51.1 0.2 73.8 0.0 55.0 53.0 71.8 72.0 0.23 0.22 3.03 0.90 2.92 2.00 1 1 0 63.0 63.0 0.0 13:48 2/1/07 41.5 51.2 -0.2 79.8 0.0 54.9 53.8 71.8 72.0 0.24 0.22 3.05 0.90 2.91 2.00 1 1 0 62.9 62.9 0.0 13:49 2/1/07 41.8 51.2 -0.5 79.8 0.0 54.9 53.6 72.1 72.0 0.24 0.22 3.05 0.90 2.93 2.00 1 1 0 63.1 63.1 0.0 13:50 2/1/07 42.0 51.2 -0.3 74.8 0.0 54.8 53.7 72.3 72.0 0.26 0.22 3.07 0.90 2.93 2.00 1 1 0 62.8 62.8 0.0 13:51 2/1/07 42.3 51.2 0.1 67.4 0.0 54.8 53.6 72.2 72.0 0.31 0.22 3.07 0.90 2.94 2.00 1 1 0 62.5 62.5 0.0 13:52 2/1/07 42.2 51.2 0.3 67.4 0.0 54.8 53.4 72.0 72.0 0.23 0.22 3.00 0.90 2.88 2.00 1 1 0 62.8 62.8 0.0 13:53 2/1/07 41.9 51.1 0.2 68.8 0.0 54.8 53.4 72.0 72.0 0.27 0.22 3.52 0.90 2.98 2.00 1 1 0 62.6 62.6 0.0 13:54 2/1/07 41.5 51.1 -0.2 80.9 0.0 54.8 53.1 72.0 72.0 0.32 0.22 3.65 0.90 2.97 2.00 1 1 0 62.2 62.2 0.0 13:55 2/1/07 41.6 51.1 -0.5 80.9 0.0 55.0 53.0 72.1 72.0 0.30 0.22 3.87 0.90 2.99 2.00 1 1 0 62.2 62.2 0.0 13:56 2/1/07 41.8 51.1 -0.4 78.7 0.0 55.1 52.3 72.3 72.0 0.35 0.22 4.04 0.90 3.02 2.00 1 1 0 61.8 61.8 0.0 13:57 2/1/07 41.8 51.1 -0.2 78.0 0.0 55.1 52.3 72.2 72.0 0.33 0.22 4.09 0.90 3.01 2.00 1 1 0 61.7 61.7 0.0 13:58 2/1/07 41.9 51.1 -0.2 78.0 0.0 55.2 51.5 72.1 72.0 0.32 0.22 4.35 0.90 3.05 2.00 1 1 0 61.6 61.6 0.0 13:59 2/1/07 42.0 51.1 -0.1 74.1 0.0 55.2 51.8 72.1 72.0 0.38 0.22 4.57 0.90 3.06 2.00 1 1 0 61.1 61.1 0.0 14:00 2/1/07 42.2 51.1 0.0 72.0 0.0 55.3 52.1 72.0 72.0 0.41 0.22 4.78 0.90 3.08 2.00 1 1 0 60.7 60.7 0.0 14:01 2/1/07 42.2 51.0 0.2 72.0 0.0 55.3 51.6 72.1 72.0 0.39 0.22 4.79 0.90 3.08 2.00 1 1 0 60.5 60.5 0.0 14:02 2/1/07 42.2 51.0 0.2 67.7 0.0 55.3 51.5 72.1 72.0 0.35 0.22 5.08 0.90 3.10 2.00 1 1 0 60.5 60.5 0.0 14:03 2/1/07 42.0 51.0 0.1 67.4 0.0 55.3 51.2 71.8 72.0 0.41 0.22 5.10 0.90 3.11 2.00 1 1 0 60.0 60.0 0.0 14:04 2/1/07 41.6 51.1 -0.2 80.1 0.0 55.3 51.8 71.7 72.0 0.36 0.22 5.10 0.90 3.11 2.00 1 1 0 60.0 60.0 0.0 14:05 2/1/07 41.6 51.2 -0.5 80.1 0.0 55.3 52.0 72.0 72.0 0.24 0.22 4.90 0.90 3.03 2.00 1 1 0 60.5 60.5 0.0 14:06 2/1/07 41.8 51.2 -0.3 75.5 0.0 55.2 52.4 72.0 72.0 0.18 0.22 3.81 0.90 2.91 2.00 1 1 0 60.8 60.8 0.0 14:07 2/1/07 42.0 51.2 -0.1 77.0 0.0 55.1 52.3 72.1 72.0 0.13 0.22 3.48 0.90 2.83 2.00 1 1 0 61.1 61.1 0.0 14:08 2/1/07 42.2 51.1 0.2 77.0 0.0 55.0 52.6 71.8 72.0 0.10 0.22 3.39 0.90 2.80 2.00 1 1 0 61.4 61.4 0.0 14:09 2/1/07 42.2 51.1 0.2 67.4 0.0 54.9 53.3 71.8 72.0 0.10 0.22 3.10 0.90 2.77 2.00 1 1 0 61.6 61.6 0.0 14:10 2/1/07 41.9 51.0 -0.1 71.3 0.0 54.8 53.6 71.7 72.0 0.09 0.22 2.97 0.90 2.74 2.00 1 1 0 61.8 61.8 0.0 14:11 2/1/07 41.6 51.0 -0.4 71.3 0.0 54.8 54.2 71.7 72.0 0.10 0.22 2.97 0.90 2.76 2.00 1 1 0 61.9 61.9 0.0 14:12 2/1/07 41.8 51.0 -0.4 79.4 0.0 54.6 54.2 72.0 72.0 0.10 0.22 2.93 0.90 2.78 2.00 1 1 0 62.2 62.2 0.0 14:13 2/1/07 42.1 51.1 0.1 68.8 0.0 54.6 55.0 72.0 72.0 0.11 0.22 2.99 0.90 2.80 2.00 1 1 0 62.3 62.3 0.0 14:14 2/1/07 42.3 51.1 0.3 68.8 0.0 54.6 55.4 72.1 72.0 0.12 0.22 2.90 0.90 2.82 2.00 1 1 0 62.4 62.4 0.0 14:15 2/1/07 42.3 51.1 0.2 67.4 0.0 54.6 54.6 71.8 72.0 0.19 0.22 2.90 0.90 2.85 2.00 1 1 0 62.1 62.1 0.0 14:16 2/1/07 42.0 51.0 0.0 69.1 0.0 54.6 55.0 71.7 72.0 0.17 0.22 2.88 0.90 2.85 2.00 1 1 0 62.3 62.3 0.0 14:17 2/1/07 41.6 51.0 -0.5 79.1 0.0 54.5 55.0 71.8 72.0 0.19 0.22 2.91 0.90 2.86 2.00 1 1 0 62.2 62.2 0.0 14:18 2/1/07 41.6 51.0 -0.5 79.1 0.0 54.4 55.3 72.1 72.0 0.18 0.22 2.92 0.90 2.87 2.00 1 1 0 62.3 62.3 0.0 14:19 2/1/07 41.8 51.1 -0.4 77.0 0.0 54.4 55.2 72.2 72.0 0.23 0.22 2.94 0.90 2.87 2.00 1 1 0 62.1 62.1 0.0 14:20 2/1/07 41.9 51.1 -0.2 77.3 0.0 54.4 55.3 72.1 72.0 0.22 0.22 2.93 0.90 2.87 2.00 1 1 0 62.2 62.2 0.0 14:21 2/1/07 42.0 51.0 -0.1 77.7 0.0 54.4 55.3 72.0 72.0 0.21 0.22 2.91 0.90 2.84 2.00 1 1 0 62.2 62.2 0.0 14:22 2/1/07 42.2 51.0 0.0 77.7 0.0 54.4 55.6 72.1 72.0 0.19 0.22 2.92 0.90 2.87 2.00 1 1 0 62.4 62.4 0.0 14:23 2/1/07 42.2 50.9 0.2 68.1 0.0 54.4 55.1 72.1 72.0 0.17 0.22 2.95 0.90 2.86 2.00 1 1 0 62.5 62.5 0.0 14:24 2/1/07 42.2 50.9 0.2 68.1 0.0 54.4 55.1 72.0 72.0 0.24 0.22 3.09 0.90 2.91 2.00 1 1 0 62.2 62.2 0.0 14:25 2/1/07 42.1 51.0 0.2 67.4 0.0 54.4 55.0 71.8 72.0 0.21 0.22 3.30 0.90 2.91 2.00 1 1 0 62.3 62.3 0.0 14:26 2/1/07 41.8 51.0 0.0 70.6 0.0 54.4 55.5 71.8 72.0 0.27 0.22 3.46 0.90 2.93 2.00 1 1 0 61.9 61.9 0.0 14:27 2/1/07 41.6 51.0 -0.3 80.5 0.0 54.4 55.2 72.0 72.0 0.30 0.22 3.67 0.90 2.97 2.00 1 1 0 61.7 61.7 0.0
- 8. 14:28 2/1/07 41.8 51.0 -0.4 80.5 0.0 54.4 55.2 72.0 72.0 0.32 0.22 3.87 0.90 2.99 2.00 1 1 0 61.5 61.5 0.0 14:29 2/1/07 41.8 51.0 -0.2 75.5 0.0 54.4 56.0 72.2 72.0 0.35 0.22 4.02 0.90 3.00 2.00 1 1 0 61.3 61.3 0.0 14:30 2/1/07 41.9 51.1 -0.2 77.0 0.0 54.4 55.0 72.2 72.0 0.38 0.22 4.15 0.90 3.04 2.00 1 1 0 61.0 61.0 0.0 14:31 2/1/07 41.9 51.0 -0.1 77.0 0.0 54.4 54.6 72.1 72.0 0.31 0.22 4.44 0.90 3.04 2.00 1 1 0 61.1 61.1 0.0 14:32 2/1/07 41.9 51.0 -0.1 77.3 0.0 54.4 54.8 72.1 72.0 0.35 0.22 4.58 0.90 3.06 2.00 1 1 0 60.8 60.8 0.0 14:33 2/1/07 42.0 50.9 -0.1 74.5 0.0 54.4 54.7 72.1 72.0 0.30 0.22 4.71 0.90 3.06 2.00 1 1 0 60.8 60.8 0.0 14:34 2/1/07 42.2 51.0 0.1 68.4 0.0 54.4 55.0 72.1 72.0 0.39 0.22 4.84 0.90 3.11 2.00 1 1 0 60.2 60.2 0.0 14:35 2/1/07 42.2 50.9 0.2 68.4 0.0 54.4 55.5 72.0 72.0 0.22 0.22 4.66 0.90 3.02 2.00 1 1 0 60.9 60.9 0.0 14:36 2/1/07 42.1 50.9 0.2 66.3 0.0 54.4 55.4 72.0 72.0 0.24 0.22 4.66 0.90 3.02 2.00 1 1 0 60.7 60.7 0.0 14:37 2/1/07 41.8 51.0 -0.1 72.7 0.0 54.4 55.3 72.0 72.0 0.21 0.22 4.61 0.90 2.99 2.00 1 1 0 60.9 60.9 0.0 14:38 2/1/07 41.6 51.0 -0.4 78.0 0.0 54.4 55.4 72.0 72.0 0.18 0.22 4.48 0.90 2.93 2.00 1 1 0 61.1 61.1 0.0 14:39 2/1/07 41.8 50.9 -0.4 77.3 0.0 54.4 55.0 72.0 72.0 0.14 0.22 4.34 0.90 2.93 2.00 1 1 0 61.4 61.4 0.0 14:40 2/1/07 41.8 51.0 -0.3 77.3 0.0 54.3 55.1 72.1 72.0 0.17 0.22 4.18 0.90 2.92 2.00 1 1 0 61.4 61.4 0.0 14:41 2/1/07 41.9 51.0 -0.1 77.3 0.0 54.3 55.4 72.1 72.0 0.16 0.22 4.09 0.90 2.93 2.00 1 1 0 61.5 61.5 0.0 14:42 2/1/07 42.1 50.9 0.0 73.8 0.0 54.3 55.6 72.1 72.0 0.21 0.22 4.03 0.90 2.96 2.00 1 1 0 61.3 61.3 0.0 14:43 2/1/07 42.3 50.9 0.3 68.1 0.0 54.3 55.9 72.0 72.0 0.20 0.22 3.84 0.90 2.93 2.00 1 1 0 61.3 61.3 0.0 14:44 2/1/07 42.2 50.9 0.2 68.1 0.0 54.3 56.1 71.8 72.0 0.22 0.22 3.70 0.90 2.92 2.00 1 1 0 61.2 61.2 0.0 14:45 2/1/07 42.2 50.9 0.2 67.7 0.0 54.3 55.5 72.0 72.0 0.16 0.22 3.46 0.90 2.88 2.00 1 1 0 61.6 61.6 0.0 14:46 2/1/07 42.1 50.9 0.2 67.4 0.0 54.3 56.2 71.8 72.0 0.20 0.22 3.41 0.90 2.89 2.00 1 1 0 61.4 61.4 0.0 14:47 2/1/07 41.8 50.9 -0.2 73.4 0.0 54.3 55.6 71.8 72.0 0.17 0.22 3.27 0.90 2.87 2.00 1 1 0 61.6 61.6 0.0 14:48 2/1/07 41.5 51.0 -0.5 73.4 0.0 54.3 55.8 72.0 72.0 0.19 0.22 3.12 0.90 2.87 2.00 1 1 0 61.6 61.6 0.0 14:49 2/1/07 41.9 51.0 -0.2 78.4 0.0 54.3 56.3 72.0 72.0 0.19 0.22 3.08 0.90 2.88 2.00 1 1 0 61.6 61.6 0.0 14:50 2/1/07 42.2 51.0 0.2 68.1 0.0 54.3 56.0 72.2 72.0 0.19 0.22 2.97 0.90 2.85 2.00 1 1 0 61.7 61.7 0.0 14:51 2/1/07 42.2 50.9 0.2 68.1 0.0 54.3 55.9 72.1 72.0 0.19 0.22 3.00 0.90 2.87 2.00 1 1 0 61.7 61.7 0.0 14:52 2/1/07 42.2 50.9 0.1 67.4 0.0 54.3 56.1 71.8 72.0 0.23 0.22 2.99 0.90 2.89 2.00 1 1 0 61.6 61.6 0.0 14:53 2/1/07 41.8 50.9 -0.3 70.9 0.0 54.3 56.4 71.8 72.0 0.21 0.22 3.01 0.90 2.88 2.00 1 1 0 61.6 61.6 0.0 14:54 2/1/07 41.4 50.8 -0.6 80.1 0.0 54.3 56.7 72.1 72.0 0.17 0.22 2.99 0.90 2.89 2.00 1 1 0 61.9 61.9 0.0 14:55 2/1/07 41.5 50.8 -0.4 80.1 0.0 54.3 56.6 72.2 72.0 0.11 0.22 3.05 0.90 2.83 2.00 1 1 0 62.3 62.3 0.0 14:56 2/1/07 41.8 50.8 -0.4 78.4 0.0 54.3 56.3 72.2 72.0 0.12 0.22 3.21 0.90 2.85 2.00 1 1 0 62.4 62.4 0.0 14:57 2/1/07 41.9 50.8 -0.2 78.4 0.0 54.3 55.8 72.1 72.0 0.15 0.22 3.41 0.90 2.88 2.00 1 1 0 62.3 62.3 0.0 14:58 2/1/07 41.9 50.7 -0.2 79.1 0.0 54.3 55.4 72.0 72.0 0.21 0.22 3.61 0.90 2.90 2.00 1 1 0 62.2 62.2 0.0 14:59 2/1/07 41.9 50.7 -0.1 78.0 0.0 54.3 55.2 72.0 72.0 0.23 0.22 3.79 0.90 2.93 2.00 1 1 0 62.1 62.1 0.0 15:00 2/1/07 41.9 50.7 -0.1 78.0 0.0 54.3 55.4 72.0 72.0 0.19 0.22 3.90 0.90 2.93 2.00 1 1 0 61.9 61.9 0.0 15:01 2/1/07 41.9 50.7 -0.2 78.0 0.0 54.3 55.7 72.0 72.0 0.23 0.22 4.09 0.90 2.96 2.00 1 1 0 62.1 62.1 0.0 15:02 2/1/07 42.0 50.6 -0.2 75.2 0.0 54.3 56.3 71.8 72.0 0.30 0.22 4.43 0.90 3.03 2.00 1 1 0 61.7 61.7 0.0 15:03 2/1/07 42.1 50.6 0.0 70.2 0.0 54.2 56.8 72.0 72.0 0.25 0.22 4.55 0.90 3.03 2.00 1 1 0 61.8 61.8 0.0 15:04 2/1/07 42.2 50.7 0.2 70.2 0.0 54.2 56.9 71.8 72.0 0.29 0.22 4.68 0.90 3.06 2.00 1 1 0 61.8 61.8 0.0 15:05 2/1/07 42.2 50.6 0.2 68.1 0.0 54.2 56.5 71.8 72.0 0.28 0.22 4.71 0.90 3.06 2.00 1 1 0 61.6 61.6 0.0 15:06 2/1/07 42.1 50.6 0.2 66.7 0.0 54.2 56.1 71.8 72.0 0.36 0.22 5.09 0.90 3.10 2.00 1 1 0 61.0 61.0 0.0 15:07 2/1/07 42.0 50.7 0.1 70.6 0.0 54.2 56.8 71.7 72.0 0.34 0.22 5.11 0.90 3.09 2.00 1 1 0 60.8 60.8 0.0 15:08 2/1/07 41.8 50.7 0.0 70.6 0.0 54.2 57.1 71.8 72.0 0.29 0.22 5.05 0.90 3.08 2.00 1 1 0 60.9 60.9 0.0 15:09 2/1/07 41.6 50.8 -0.3 74.8 0.0 54.2 56.4 72.0 72.0 0.28 0.22 5.07 0.90 3.07 2.00 1 1 0 60.8 60.8 0.0 15:10 2/1/07 41.8 50.9 -0.4 74.8 0.0 54.2 55.9 72.0 72.0 0.23 0.22 4.13 0.90 3.00 2.00 1 1 0 60.9 60.9 0.0 15:11 2/1/07 41.8 50.9 -0.2 77.7 0.0 54.2 56.4 72.1 72.0 0.21 0.22 3.88 0.90 2.95 2.00 1 1 0 61.1 61.1 0.0 15:12 2/1/07 41.9 50.8 -0.1 75.9 0.0 54.2 56.7 72.2 72.0 0.23 0.22 3.88 0.90 2.96 2.00 1 1 0 60.9 60.9 0.0 15:13 2/1/07 42.1 50.8 -0.1 68.8 0.0 54.1 56.8 72.2 72.0 0.23 0.22 3.89 0.90 2.97 2.00 1 1 0 60.9 60.9 0.0 15:14 2/1/07 42.2 50.8 0.2 68.8 0.0 54.0 56.6 72.2 72.0 0.26 0.22 3.88 0.90 2.96 2.00 1 1 0 60.7 60.7 0.0 15:15 2/1/07 42.1 50.7 0.2 68.1 0.0 54.0 55.7 72.1 72.0 0.26 0.22 3.88 0.90 2.97 2.00 1 1 0 60.7 60.7 0.0 15:16 2/1/07 42.0 50.7 0.1 71.3 0.0 54.0 55.6 71.8 72.0 0.23 0.22 3.84 0.90 2.93 2.00 1 1 0 60.8 60.8 0.0 15:17 2/1/07 41.8 50.7 -0.2 78.0 0.0 53.9 56.1 71.8 72.0 0.28 0.22 3.93 0.90 2.99 2.00 1 1 0 60.5 60.5 0.0 15:18 2/1/07 41.8 50.7 -0.3 78.0 0.0 53.9 56.0 72.0 72.0 0.29 0.22 3.91 0.90 2.98 2.00 1 1 0 60.4 60.4 0.0 15:19 2/1/07 41.8 50.7 -0.2 77.0 0.0 53.9 56.2 72.0 72.0 0.25 0.22 3.86 0.90 2.94 2.00 1 1 0 60.6 60.6 0.0 15:20 2/1/07 41.8 50.7 -0.2 77.0 0.0 53.9 56.4 72.1 72.0 0.17 0.22 3.78 0.90 2.90 2.00 1 1 0 61.1 61.1 0.0 15:21 2/1/07 41.8 50.7 -0.2 78.4 0.0 53.9 56.3 72.0 72.0 0.11 0.22 3.75 0.90 2.90 2.00 1 1 0 61.4 61.4 0.0
- 9. 15:22 2/1/07 41.8 50.7 -0.2 77.3 0.0 53.9 56.7 72.1 72.0 0.10 0.22 3.68 0.90 2.82 2.00 1 1 0 61.7 61.7 0.0 15:23 2/1/07 41.8 50.6 -0.2 77.3 0.0 53.9 56.7 72.0 72.0 0.11 0.22 3.72 0.90 2.86 2.00 1 1 0 61.8 61.8 0.0 15:24 2/1/07 41.8 50.6 -0.2 76.6 0.0 53.9 56.7 72.2 72.0 0.12 0.22 3.85 0.90 2.89 2.00 1 1 0 61.8 61.8 0.0 15:25 2/1/07 41.8 50.6 -0.2 77.7 0.0 53.9 57.7 72.0 72.0 0.18 0.22 4.03 0.90 2.92 2.00 1 1 0 61.7 61.7 0.0 15:26 2/1/07 41.8 50.4 -0.2 77.7 0.0 53.9 58.2 72.0 72.0 0.16 0.22 4.19 0.90 2.92 2.00 1 1 0 61.7 61.7 0.0 15:27 2/1/07 41.8 50.4 -0.2 73.4 0.0 53.9 58.8 72.1 72.0 0.19 0.22 4.40 0.90 2.96 2.00 1 1 0 61.8 61.8 0.0 15:28 2/1/07 41.8 50.4 -0.2 73.4 0.0 53.9 59.0 72.1 72.0 0.22 0.22 4.46 0.90 2.98 2.00 1 1 0 61.7 61.7 0.0 15:29 2/1/07 41.8 50.4 -0.1 78.0 0.0 53.9 58.9 72.0 72.0 0.33 0.22 4.70 0.90 3.04 2.00 1 1 0 61.1 61.1 0.0 15:30 2/1/07 41.8 50.4 -0.2 77.7 0.0 53.9 57.7 72.0 72.0 0.29 0.22 4.89 0.90 3.05 2.00 1 1 0 61.2 61.2 0.0 15:31 2/1/07 41.8 50.4 -0.2 77.7 0.0 53.9 57.6 72.0 72.0 0.32 0.22 5.10 0.90 3.08 2.00 1 1 0 60.9 60.9 0.0 15:32 2/1/07 41.9 50.4 -0.1 74.5 0.0 53.9 57.3 72.0 72.0 0.29 0.22 5.23 0.90 3.10 2.00 1 1 0 61.0 61.0 0.0 15:33 2/1/07 42.0 50.4 0.0 74.5 0.0 53.9 57.2 71.8 72.0 0.31 0.22 5.39 0.90 3.11 2.00 1 1 0 60.7 60.7 0.0 15:34 2/1/07 42.1 50.4 0.1 72.0 0.0 53.9 56.5 72.0 72.0 0.35 0.22 5.59 0.90 3.16 2.00 1 1 0 60.3 60.3 0.0 15:35 2/1/07 42.2 50.5 0.2 69.1 0.0 53.9 56.7 71.8 72.0 0.36 0.22 5.60 0.90 3.13 2.00 1 1 0 60.1 60.1 0.0 15:36 2/1/07 42.0 50.4 0.1 68.8 0.0 53.8 57.1 71.8 72.0 0.26 0.22 5.43 0.90 3.08 2.00 1 1 0 60.4 60.4 0.0 15:37 2/1/07 41.9 50.4 -0.1 68.8 0.0 53.8 56.9 71.8 72.0 0.34 0.22 5.60 0.90 3.16 2.00 1 1 0 59.9 59.9 0.0 15:38 2/1/07 41.8 50.5 -0.2 70.9 0.0 53.8 57.6 71.8 72.0 0.34 0.22 5.56 0.90 3.12 2.00 1 1 0 59.7 59.7 0.0 15:39 2/1/07 41.8 50.6 -0.2 77.3 0.0 53.8 57.3 72.0 72.0 0.30 0.22 5.42 0.90 3.11 2.00 1 1 0 59.8 59.8 0.0 15:40 2/1/07 41.9 50.5 -0.3 77.3 0.0 53.8 56.9 72.1 72.0 0.32 0.22 5.25 0.90 3.09 2.00 1 1 0 59.6 59.6 0.0 15:41 2/1/07 41.9 50.6 -0.1 76.6 0.0 53.7 57.1 72.0 72.0 0.26 0.22 5.17 0.90 3.06 2.00 1 1 0 59.8 59.8 0.0 15:42 2/1/07 42.1 50.5 -0.1 65.2 0.0 53.7 57.3 72.0 72.0 0.24 0.22 5.00 0.90 3.04 2.00 1 1 0 59.8 59.8 0.0 15:43 2/1/07 42.1 50.5 0.0 65.2 0.0 53.7 57.7 72.0 72.0 0.22 0.22 4.88 0.90 3.02 2.00 1 1 0 59.8 59.8 0.0 15:44 2/1/07 42.1 50.6 0.1 72.3 0.0 53.6 57.0 72.1 72.0 0.27 0.22 4.88 0.90 3.05 2.00 1 1 0 59.8 59.8 0.0 15:45 2/1/07 42.2 50.5 0.2 67.7 0.0 53.6 57.3 72.0 72.0 0.28 0.22 4.75 0.90 3.04 2.00 1 1 0 59.5 59.5 0.0 15:46 2/1/07 41.9 50.5 0.1 73.8 0.0 53.6 57.6 71.8 72.0 0.25 0.22 4.55 0.90 2.98 2.00 1 1 0 59.6 59.6 0.0 15:47 2/1/07 41.8 50.5 -0.2 73.8 0.0 53.6 58.3 71.8 72.0 0.20 0.22 4.36 0.90 2.98 2.00 1 1 0 59.8 59.8 0.0 15:48 2/1/07 41.8 50.5 -0.3 76.2 0.0 53.6 58.6 72.0 72.0 0.19 0.22 4.14 0.90 2.93 2.00 1 1 0 59.9 59.9 0.0 15:49 2/1/07 41.8 50.6 -0.2 78.0 0.0 53.6 58.2 72.2 72.0 0.19 0.22 4.06 0.90 2.94 2.00 1 1 0 59.9 59.9 0.0 15:50 2/1/07 41.8 50.6 -0.2 78.7 0.0 53.6 57.7 72.2 72.0 0.13 0.22 3.84 0.90 2.89 2.00 1 1 0 60.3 60.3 0.0 15:51 2/1/07 41.9 50.5 -0.1 78.7 0.0 53.6 58.1 72.1 72.0 0.12 0.22 3.68 0.90 2.87 2.00 1 1 0 60.5 60.5 0.0 15:52 2/1/07 41.9 50.5 -0.1 75.5 0.0 53.6 58.2 72.1 72.0 0.09 0.22 3.56 0.90 2.82 2.00 1 1 0 60.8 60.8 0.0 15:53 2/1/07 41.9 50.5 -0.1 77.3 0.0 53.6 58.1 72.0 72.0 0.09 0.22 3.53 0.90 2.80 2.00 1 1 0 61.0 61.0 0.0 15:54 2/1/07 41.9 50.4 -0.1 77.3 0.0 53.6 58.3 72.1 72.0 0.08 0.22 3.50 0.90 2.78 2.00 1 1 0 61.3 61.3 0.0 15:55 2/1/07 42.1 50.4 0.0 70.2 0.0 53.6 57.6 72.0 72.0 0.09 0.22 3.52 0.90 2.80 2.00 1 1 0 61.4 61.4 0.0 15:56 2/1/07 42.2 50.4 0.1 68.4 0.0 53.6 57.4 72.0 72.0 0.10 0.22 3.56 0.90 2.82 2.00 1 1 0 61.6 61.6 0.0 15:57 2/1/07 42.2 50.4 0.2 68.4 0.0 53.6 57.7 71.8 72.0 0.10 0.22 3.54 0.90 2.83 2.00 1 1 0 61.8 61.8 0.0 15:58 2/1/07 42.1 50.4 0.1 65.6 0.0 53.6 58.1 71.8 72.0 0.09 0.22 3.59 0.90 2.84 2.00 1 1 0 62.0 62.0 0.0 15:59 2/1/07 41.8 50.4 0.0 65.6 0.0 53.6 58.1 71.8 72.0 0.12 0.22 3.64 0.90 2.86 2.00 1 1 0 62.0 62.0 0.0 16:00 2/1/07 41.8 50.4 -0.3 73.1 0.0 53.6 58.6 72.0 72.0 0.16 0.22 3.83 0.90 2.92 2.00 1 1 0 61.9 61.9 0.0 16:01 2/1/07 41.8 50.4 -0.3 77.7 0.0 53.6 58.8 72.1 72.0 0.20 0.22 4.07 0.90 2.96 2.00 1 1 0 61.8 61.8 0.0 16:02 2/1/07 41.8 50.4 -0.2 77.7 0.0 53.6 58.9 72.1 72.0 0.24 0.22 4.24 0.90 3.01 2.00 1 1 0 61.7 61.7 0.0 16:03 2/1/07 41.9 50.4 -0.2 74.8 0.0 53.6 58.8 72.1 72.0 0.22 0.22 4.40 0.90 2.99 2.00 1 1 0 61.7 61.7 0.0 16:04 2/1/07 42.0 50.4 0.0 74.5 0.0 53.6 59.3 72.1 72.0 0.27 0.22 4.56 0.90 3.02 2.00 1 1 0 61.5 61.5 0.0 16:05 2/1/07 42.1 50.4 0.1 67.4 0.0 53.6 59.4 72.0 72.0 0.34 0.22 4.83 0.90 3.06 2.00 1 1 0 61.0 61.0 0.0 16:06 2/1/07 42.1 50.4 0.1 67.4 0.0 53.6 59.4 72.0 72.0 0.31 0.22 4.84 0.90 3.07 2.00 1 1 0 61.1 61.1 0.0 16:07 2/1/07 42.1 50.4 0.1 68.8 0.0 53.7 58.9 72.0 72.0 0.34 0.22 5.13 0.90 3.10 2.00 1 1 0 60.8 60.8 0.0 16:08 2/1/07 41.9 50.4 0.0 66.7 0.0 53.7 58.8 71.8 72.0 0.31 0.22 5.27 0.90 3.11 2.00 1 1 0 60.6 60.6 0.0 16:09 2/1/07 41.6 50.4 -0.3 66.7 0.0 53.7 58.7 71.8 72.0 0.31 0.22 5.39 0.90 3.12 2.00 1 1 0 60.6 60.6 0.0 16:10 2/1/07 41.8 50.4 -0.3 77.0 0.0 53.7 58.6 72.0 72.0 0.36 0.22 5.69 0.90 3.17 2.00 1 1 0 60.2 60.2 0.0 16:11 2/1/07 42.0 50.5 -0.1 72.3 0.0 53.7 58.4 72.1 72.0 0.27 0.22 5.50 0.90 3.14 2.00 1 1 0 60.5 60.5 0.0 16:12 2/1/07 42.2 50.4 0.1 68.8 0.0 53.7 58.6 72.1 72.0 0.37 0.22 5.61 0.90 3.19 2.00 1 1 0 59.8 59.8 0.0 16:13 2/1/07 42.1 50.4 0.2 68.8 0.0 53.7 58.1 72.0 72.0 0.33 0.22 5.51 0.90 3.13 2.00 1 1 0 59.8 59.8 0.0 16:14 2/1/07 42.1 50.4 0.1 68.1 0.0 53.7 58.0 71.8 72.0 0.31 0.22 5.45 0.90 3.12 2.00 1 1 0 59.7 59.7 0.0 16:15 2/1/07 41.9 50.4 -0.1 72.0 0.0 53.6 58.0 72.0 72.0 0.32 0.22 5.27 0.90 3.08 2.00 1 1 0 59.5 59.5 0.0
- 10. 16:16 2/1/07 41.8 50.5 -0.3 72.0 0.0 53.6 58.5 72.1 72.0 0.31 0.22 5.22 0.90 3.10 2.00 1 1 0 59.4 59.4 0.0 16:17 2/1/07 41.8 50.5 -0.3 78.7 0.0 53.6 58.8 72.1 72.0 0.29 0.22 5.09 0.90 3.08 2.00 1 1 0 59.4 59.4 0.0 16:18 2/1/07 41.8 50.5 -0.2 78.0 0.0 53.6 58.8 72.2 72.0 0.24 0.22 4.88 0.90 3.04 2.00 1 1 0 59.6 59.6 0.0 16:19 2/1/07 42.3 50.5 0.3 64.2 0.0 53.6 58.8 72.1 72.0 0.24 0.22 4.75 0.90 3.03 2.00 1 1 0 59.5 59.5 0.0 16:20 2/1/07 42.3 50.5 0.3 64.2 0.0 53.6 58.1 72.1 72.0 0.25 0.22 4.64 0.90 3.01 2.00 1 1 0 59.4 59.4 0.0 16:21 2/1/07 41.8 50.4 -0.1 72.0 0.0 53.6 57.9 71.8 72.0 0.21 0.22 4.41 0.90 2.97 2.00 1 1 0 59.6 59.6 0.0 16:22 2/1/07 41.6 50.4 -0.4 79.4 0.0 53.7 58.1 71.8 72.0 0.14 0.22 4.20 0.90 2.91 2.00 1 1 0 60.0 60.0 0.0 16:23 2/1/07 41.8 50.4 -0.3 79.4 0.0 53.7 58.2 72.0 72.0 0.11 0.22 4.00 0.90 2.87 2.00 1 1 0 60.3 60.3 0.0 16:24 2/1/07 41.8 50.4 -0.3 78.0 0.0 53.7 58.6 72.3 72.0 0.10 0.22 3.74 0.90 2.82 2.00 1 1 0 60.5 60.5 0.0 16:25 2/1/07 41.8 50.5 -0.2 73.1 0.0 53.7 58.8 72.2 72.0 0.09 0.22 3.63 0.90 2.79 2.00 1 1 0 60.8 60.8 0.0 16:26 2/1/07 41.9 50.5 -0.1 73.1 0.0 53.7 59.1 72.1 72.0 0.09 0.22 3.47 0.90 2.76 2.00 1 1 0 61.0 61.0 0.0 16:27 2/1/07 41.9 50.5 -0.1 78.7 0.0 53.8 58.3 72.1 72.0 0.08 0.22 3.39 0.90 2.77 2.00 1 1 0 61.2 61.2 0.0 16:28 2/1/07 41.9 50.4 -0.1 77.3 0.0 53.8 58.3 72.0 72.0 0.09 0.22 3.25 0.90 2.78 2.00 1 1 0 61.4 61.4 0.0 16:29 2/1/07 41.9 50.4 -0.1 77.3 0.0 53.8 57.6 72.0 72.0 0.09 0.22 3.11 0.90 2.77 2.00 1 1 0 61.6 61.6 0.0 16:30 2/1/07 42.0 50.4 -0.1 77.7 0.0 53.8 57.8 72.0 72.0 0.09 0.22 3.15 0.90 2.80 2.00 1 1 0 61.8 61.8 0.0 16:31 2/1/07 42.1 50.4 -0.1 73.8 0.0 53.8 58.0 72.1 72.0 0.10 0.22 3.14 0.90 2.78 2.00 1 1 0 61.9 61.9 0.0 16:32 2/1/07 42.2 50.4 0.1 73.8 0.0 53.8 58.1 72.0 72.0 0.11 0.22 3.18 0.90 2.81 2.00 1 1 0 62.1 62.1 0.0 16:33 2/1/07 42.2 50.4 0.2 68.8 0.0 53.8 58.1 72.0 72.0 0.10 0.22 3.22 0.90 2.83 2.00 1 1 0 62.3 62.3 0.0 16:34 2/1/07 42.1 50.4 0.2 67.4 0.0 53.8 58.0 71.8 72.0 0.12 0.22 3.37 0.90 2.85 2.00 1 1 0 62.4 62.4 0.0 16:35 2/1/07 42.0 50.4 0.1 67.4 0.0 53.8 57.8 71.8 72.0 0.13 0.22 3.53 0.90 2.89 2.00 1 1 0 62.4 62.4 0.0 16:36 2/1/07 41.8 50.4 -0.1 71.3 0.0 53.8 57.9 72.0 72.0 0.19 0.22 3.70 0.90 2.92 2.00 1 1 0 62.3 62.3 0.0 16:37 2/1/07 41.8 50.4 -0.3 75.9 0.0 53.8 58.0 72.0 72.0 0.15 0.22 3.89 0.90 2.94 2.00 1 1 0 62.5 62.5 0.0 16:38 2/1/07 41.8 50.4 -0.2 77.3 0.0 53.8 58.3 72.1 72.0 0.22 0.22 4.09 0.90 2.98 2.00 1 1 0 62.3 62.3 0.0 16:39 2/1/07 41.9 50.4 -0.2 77.3 0.0 53.8 58.3 72.1 72.0 0.24 0.22 4.29 0.90 3.01 2.00 1 1 0 62.2 62.2 0.0 16:40 2/1/07 41.9 50.4 0.0 73.8 0.0 53.8 58.2 72.1 72.0 0.29 0.22 4.43 0.90 3.01 2.00 1 1 0 61.9 61.9 0.0 16:41 2/1/07 41.9 50.4 0.0 78.0 0.0 53.8 58.1 72.0 72.0 0.28 0.22 4.71 0.90 3.04 2.00 1 1 0 61.9 61.9 0.0 16:42 2/1/07 41.9 50.4 -0.1 78.0 0.0 53.8 58.2 72.1 72.0 0.32 0.22 4.81 0.90 3.09 2.00 1 1 0 61.6 61.6 0.0 16:43 2/1/07 41.9 50.4 -0.1 76.6 0.0 53.8 58.1 72.1 72.0 0.26 0.22 4.77 0.90 3.04 2.00 1 1 0 61.8 61.8 0.0 16:44 2/1/07 41.8 50.4 -0.2 76.6 0.0 53.8 58.3 72.1 72.0 0.33 0.22 4.93 0.90 3.11 2.00 1 1 0 61.3 61.3 0.0 16:45 2/1/07 41.9 50.4 -0.1 78.7 0.0 53.8 58.5 72.0 72.0 0.36 0.22 5.45 0.90 3.15 2.00 1 1 0 61.1 61.1 0.0 16:46 2/1/07 41.8 50.4 -0.2 77.0 0.0 53.8 58.3 72.0 72.0 0.31 0.22 5.41 0.90 3.14 2.00 1 1 0 61.2 61.2 0.0 16:47 2/1/07 41.9 50.4 -0.1 74.1 0.0 53.8 58.3 72.0 72.0 0.36 0.22 5.43 0.90 3.15 2.00 1 1 0 60.8 60.8 0.0 16:48 2/1/07 42.0 50.4 0.0 74.1 0.0 53.8 58.4 72.1 72.0 0.37 0.22 5.41 0.90 3.15 2.00 1 1 0 60.4 60.4 0.0 16:49 2/1/07 42.1 50.4 0.0 73.8 0.0 53.8 58.7 72.1 72.0 0.26 0.22 5.30 0.90 3.08 2.00 1 1 0 60.8 60.8 0.0 16:50 2/1/07 42.2 50.4 0.1 71.6 0.0 53.7 58.7 72.1 72.0 0.43 0.22 5.50 0.90 3.20 2.00 1 1 0 59.8 59.8 0.0 16:51 2/1/07 42.2 50.4 0.2 71.6 0.0 53.7 58.8 71.8 72.0 0.29 0.22 5.29 0.90 3.07 2.00 1 1 0 60.3 60.3 0.0 16:52 2/1/07 42.1 50.4 0.2 68.4 0.0 53.6 59.0 71.8 72.0 0.38 0.22 5.45 0.90 3.17 2.00 1 1 0 59.7 59.7 0.0 16:53 2/1/07 42.0 50.4 0.0 68.1 0.0 53.6 59.0 71.8 72.0 0.28 0.22 5.31 0.90 3.12 2.00 1 1 0 60.0 60.0 0.0 16:54 2/1/07 41.8 50.4 -0.1 73.4 0.0 53.6 59.3 72.0 72.0 0.37 0.22 5.25 0.90 3.11 2.00 1 1 0 59.5 59.5 0.0 16:55 2/1/07 41.8 50.4 -0.3 73.4 0.0 53.6 59.8 72.0 72.0 0.25 0.22 5.04 0.90 3.05 2.00 1 1 0 59.9 59.9 0.0 16:56 2/1/07 41.8 50.4 -0.2 77.7 0.0 53.6 59.9 72.1 72.0 0.27 0.22 4.89 0.90 3.05 2.00 1 1 0 59.7 59.7 0.0 16:57 2/1/07 41.8 50.4 -0.2 77.3 0.0 53.6 59.9 72.2 72.0 0.27 0.22 4.83 0.90 3.04 2.00 1 1 0 59.7 59.7 0.0 16:58 2/1/07 41.8 50.4 -0.2 78.7 0.0 53.6 59.7 72.1 72.0 0.28 0.22 4.65 0.90 3.01 2.00 1 1 0 59.6 59.6 0.0 16:59 2/1/07 41.8 50.4 -0.2 78.7 0.0 53.6 59.3 72.0 72.0 0.25 0.22 4.43 0.90 2.99 2.00 1 1 0 59.6 59.6 0.0 17:00 2/1/07 41.9 50.4 -0.1 74.5 0.0 53.5 59.3 72.1 72.0 0.22 0.22 4.33 0.90 2.98 2.00 1 1 0 59.8 59.8 0.0 17:01 2/1/07 42.0 50.4 0.0 74.5 0.0 53.5 59.2 72.0 72.0 0.21 0.22 4.10 0.90 2.95 2.00 1 1 0 59.8 59.8 0.0 17:02 2/1/07 42.2 50.4 0.1 72.0 0.0 53.5 59.0 72.1 72.0 0.18 0.22 4.05 0.90 2.95 2.00 1 1 0 60.0 60.0 0.0 17:03 2/1/07 42.2 50.4 0.2 68.1 0.0 53.5 58.8 71.8 72.0 0.15 0.22 3.99 0.90 2.91 2.00 1 1 0 60.3 60.3 0.0 17:04 2/1/07 42.1 50.4 0.2 68.1 0.0 53.5 59.1 71.8 72.0 0.15 0.22 3.96 0.90 2.89 2.00 1 1 0 60.4 60.4 0.0 17:05 2/1/07 42.1 50.2 0.1 69.1 0.0 53.5 59.3 71.8 72.0 0.09 0.22 3.92 0.90 2.87 2.00 1 1 0 60.8 60.8 0.0 17:06 2/1/07 41.9 50.2 0.1 68.4 0.0 53.5 59.3 72.0 72.0 0.09 0.22 3.87 0.90 2.84 2.00 1 1 0 61.0 61.0 0.0 17:07 2/1/07 41.8 50.2 -0.1 75.2 0.0 53.4 58.9 72.0 72.0 0.09 0.22 4.01 0.90 2.84 2.00 1 1 0 61.2 61.2 0.0 17:08 2/1/07 41.8 50.2 -0.3 75.2 0.0 53.4 59.0 72.0 72.0 0.11 0.22 4.23 0.90 2.88 2.00 1 1 0 61.3 61.3 0.0 17:09 2/1/07 41.9 50.4 -0.3 76.6 0.0 53.4 59.0 72.0 72.0 0.16 0.22 4.38 0.90 2.93 2.00 1 1 0 61.2 61.2 0.0
- 11. 17:10 2/1/07 42.0 50.4 -0.1 71.3 0.0 53.4 59.0 72.1 72.0 0.25 0.22 4.66 0.90 3.01 2.00 1 1 0 60.7 60.7 0.0 17:11 2/1/07 42.0 50.2 0.0 71.3 0.0 53.4 59.4 72.1 72.0 0.20 0.22 4.62 0.90 3.01 2.00 1 1 0 61.0 61.0 0.0 17:12 2/1/07 42.0 50.1 0.0 74.1 0.0 53.4 59.6 72.0 72.0 0.31 0.22 4.82 0.90 3.06 2.00 1 1 0 60.4 60.4 0.0 17:13 2/1/07 42.0 50.1 0.0 78.0 0.0 53.4 59.8 72.0 72.0 0.25 0.22 5.24 0.90 3.08 2.00 1 1 0 60.6 60.6 0.0 17:14 2/1/07 41.9 50.1 -0.1 78.0 0.0 53.4 59.9 72.0 72.0 0.35 0.22 5.44 0.90 3.17 2.00 1 1 0 60.0 60.0 0.0 17:15 2/1/07 41.8 50.1 -0.1 77.3 0.0 53.4 59.9 71.8 72.0 0.36 0.22 5.52 0.90 3.17 2.00 1 1 0 59.8 59.8 0.0 17:16 2/1/07 42.0 50.1 -0.1 73.1 0.0 53.4 60.1 72.1 72.0 0.28 0.22 5.57 0.90 3.14 2.00 1 1 0 60.1 60.1 0.0 17:17 2/1/07 42.2 50.2 0.1 73.1 0.0 53.4 60.4 72.0 72.0 0.31 0.22 5.62 0.90 3.12 2.00 1 1 0 59.8 59.8 0.0 17:18 2/1/07 42.2 50.1 0.2 67.7 0.0 53.4 60.2 71.8 72.0 0.35 0.22 5.81 0.90 3.19 2.00 1 1 0 59.4 59.4 0.0 17:19 2/1/07 42.0 50.1 0.1 67.4 0.0 53.4 60.5 71.8 72.0 0.28 0.22 5.82 0.90 3.15 2.00 1 1 0 59.6 59.6 0.0 17:20 2/1/07 41.8 50.1 0.0 67.4 0.0 53.4 60.4 71.8 72.0 0.35 0.22 5.90 0.90 3.21 2.00 1 1 0 59.1 59.1 0.0 17:21 2/1/07 41.6 50.1 -0.3 77.3 0.0 53.4 60.4 72.1 72.0 0.32 0.22 5.84 0.90 3.17 2.00 1 1 0 58.8 58.8 0.0 17:22 2/1/07 41.8 50.2 -0.3 76.2 0.0 53.4 60.3 72.2 72.0 0.37 0.22 5.91 0.90 3.20 2.00 1 1 0 58.7 58.7 0.0 17:23 2/1/07 41.8 50.2 -0.2 73.8 0.0 53.4 60.2 72.2 72.0 0.29 0.22 5.80 0.90 3.16 2.00 1 1 0 58.9 58.9 0.0 17:24 2/1/07 41.9 50.2 -0.2 73.8 0.0 53.4 60.3 72.1 72.0 0.40 0.22 6.00 0.90 3.24 2.00 1 1 0 58.2 58.2 0.0 17:25 2/1/07 41.9 50.1 -0.1 77.0 0.0 53.4 60.2 72.0 72.0 0.20 0.22 5.66 0.90 3.11 2.00 1 1 0 59.1 59.1 0.0 17:26 2/1/07 41.9 50.1 -0.1 78.0 0.0 53.4 59.9 72.1 72.0 0.38 0.22 5.81 0.90 3.21 2.00 1 1 0 58.1 58.1 0.0 17:27 2/1/07 42.0 50.1 -0.1 73.4 0.0 53.4 59.8 72.1 72.0 0.24 0.22 5.52 0.90 3.11 2.00 1 1 0 58.7 58.7 0.0 17:28 2/1/07 42.0 50.2 0.0 73.4 0.0 53.4 59.7 72.1 72.0 0.20 0.22 5.07 0.90 3.04 2.00 1 1 0 58.8 58.8 0.0 17:29 2/1/07 42.1 50.1 0.0 74.5 0.0 53.4 59.8 72.0 72.0 0.13 0.22 4.51 0.90 2.90 2.00 1 1 0 59.2 59.2 0.0 17:30 2/1/07 42.1 50.1 0.1 73.8 0.0 53.4 59.8 72.0 72.0 0.11 0.22 4.48 0.90 2.90 2.00 1 1 0 59.3 59.3 0.0 17:31 2/1/07 42.1 50.1 0.1 73.8 0.0 53.4 59.9 72.0 72.0 0.10 0.22 4.15 0.90 2.83 2.00 1 1 0 59.7 59.7 0.0 17:32 2/1/07 42.1 50.1 0.1 72.0 0.0 53.4 59.9 72.0 72.0 0.08 0.22 4.04 0.90 2.80 2.00 1 1 0 60.0 60.0 0.0 17:33 2/1/07 42.1 50.1 0.1 72.0 0.0 53.4 60.1 72.0 72.0 0.08 0.22 4.07 0.90 2.81 2.00 1 1 0 60.2 60.2 0.0 17:34 2/1/07 42.1 50.1 0.1 72.0 0.0 53.4 60.3 72.0 72.0 0.10 0.22 4.10 0.90 2.83 2.00 1 1 0 60.3 60.3 0.0 17:35 2/1/07 42.2 50.1 0.2 71.6 0.0 53.4 60.1 72.0 72.0 0.10 0.22 4.15 0.90 2.83 2.00 1 1 0 60.5 60.5 0.0 17:36 2/1/07 42.2 50.1 0.2 69.5 0.0 53.4 59.9 71.8 72.0 0.10 0.22 4.15 0.90 2.85 2.00 1 1 0 60.7 60.7 0.0 17:37 2/1/07 42.1 50.1 0.2 69.5 0.0 53.4 59.9 71.8 72.0 0.11 0.22 4.16 0.90 2.86 2.00 1 1 0 60.8 60.8 0.0 17:38 2/1/07 42.1 50.1 0.1 67.0 0.0 53.4 59.9 72.0 72.0 0.12 0.22 4.22 0.90 2.89 2.00 1 1 0 60.9 60.9 0.0 17:39 2/1/07 41.8 50.1 0.0 71.3 0.0 53.4 59.9 72.0 72.0 0.12 0.22 4.34 0.90 2.91 2.00 1 1 0 61.0 61.0 0.0 17:40 2/1/07 41.8 50.1 -0.3 71.3 0.0 53.4 59.8 72.0 72.0 0.19 0.22 4.59 0.90 2.97 2.00 1 1 0 60.8 60.8 0.0 17:41 2/1/07 41.8 50.1 -0.3 76.6 0.0 53.4 59.5 72.1 72.0 0.23 0.22 4.67 0.90 3.00 2.00 1 1 0 60.8 60.8 0.0 17:42 2/1/07 42.1 50.1 0.0 70.6 0.0 53.4 59.4 72.1 72.0 0.21 0.22 4.63 0.90 2.98 2.00 1 1 0 60.5 60.5 0.0 17:43 2/1/07 42.2 50.1 0.3 67.4 0.0 53.4 59.6 72.1 72.0 0.25 0.22 4.76 0.90 3.02 2.00 1 1 0 60.5 60.5 0.0 17:44 2/1/07 42.0 50.1 0.1 67.4 0.0 53.4 59.8 72.1 72.0 0.27 0.22 5.16 0.90 3.08 2.00 1 1 0 60.4 60.4 0.0 17:45 2/1/07 41.8 50.1 -0.2 74.1 0.0 53.4 59.9 72.0 72.0 0.29 0.22 5.41 0.90 3.11 2.00 1 1 0 60.2 60.2 0.0 17:46 2/1/07 41.9 50.1 -0.2 73.8 0.0 53.4 59.8 72.0 72.0 0.32 0.22 5.49 0.90 3.14 2.00 1 1 0 59.8 59.8 0.0 17:47 2/1/07 42.2 50.0 0.1 73.8 0.0 53.4 59.8 72.1 72.0 0.32 0.22 5.66 0.90 3.15 2.00 1 1 0 59.7 59.7 0.0 17:48 2/1/07 42.2 50.1 0.2 67.4 0.0 53.4 59.8 72.1 72.0 0.34 0.22 5.71 0.90 3.17 2.00 1 1 0 59.4 59.4 0.0 17:49 2/1/07 42.2 50.1 0.2 69.9 0.0 53.4 59.8 72.0 72.0 0.29 0.22 5.70 0.90 3.12 2.00 1 1 0 59.5 59.5 0.0 17:50 2/1/07 42.1 50.1 0.2 67.7 0.0 53.4 59.9 71.8 72.0 0.42 0.22 5.96 0.90 3.24 2.00 1 1 0 58.7 58.7 0.0 17:51 2/1/07 41.9 50.1 0.0 67.7 0.0 53.4 60.1 72.0 72.0 0.31 0.22 5.78 0.90 3.15 2.00 1 1 0 58.5 58.5 0.0 17:52 2/1/07 41.6 50.1 -0.4 76.2 0.0 53.4 59.8 72.1 72.0 0.30 0.22 5.76 0.90 3.13 2.00 1 1 0 58.9 58.9 0.0 17:53 2/1/07 41.8 50.1 -0.3 77.0 0.0 53.4 59.7 72.1 72.0 0.38 0.22 5.87 0.90 3.17 2.00 1 1 0 58.3 58.3 0.0 17:54 2/1/07 41.8 50.1 -0.2 74.5 0.0 53.4 59.6 72.2 72.0 0.34 0.22 5.84 0.90 3.17 2.00 1 1 0 58.3 58.3 0.0 17:55 2/1/07 41.8 50.2 -0.2 74.5 0.0 53.4 59.6 72.1 72.0 0.34 0.22 5.82 0.90 3.17 2.00 1 1 0 58.1 58.1 0.0 17:56 2/1/07 41.9 50.2 -0.1 71.3 0.0 53.4 59.5 72.1 72.0 0.29 0.22 5.79 0.90 3.15 2.00 1 1 0 58.2 58.2 0.0 17:57 2/1/07 42.0 50.1 0.0 71.3 0.0 53.4 59.6 72.1 72.0 0.36 0.22 5.80 0.90 3.19 2.00 1 1 0 58.4 58.4 0.0 17:58 2/1/07 42.0 50.1 0.0 74.5 0.0 53.4 59.8 72.1 72.0 0.33 0.22 5.67 0.90 3.14 2.00 1 1 0 57.7 57.7 0.0 17:59 2/1/07 42.0 50.1 0.0 73.1 0.0 53.3 59.9 72.0 72.0 0.26 0.22 5.48 0.90 3.08 2.00 1 1 0 58.0 58.0 0.0 18:00 2/1/07 42.0 50.1 -0.1 78.0 0.0 53.3 59.9 72.0 72.0 0.20 0.22 5.33 0.90 3.05 2.00 1 1 0 58.3 58.3 0.0 18:01 2/1/07 41.9 50.2 -0.1 78.0 0.0 53.3 59.9 72.0 72.0 0.20 0.22 4.98 0.90 2.98 2.00 1 1 0 58.3 58.3 0.0 18:02 2/1/07 42.0 50.2 0.0 71.3 0.0 53.3 59.8 72.1 72.0 0.13 0.22 4.39 0.90 2.88 2.00 1 1 0 58.8 58.8 0.0 18:03 2/1/07 42.0 50.1 0.0 72.7 0.0 53.3 59.5 72.0 72.0 0.10 0.22 4.08 0.90 2.82 2.00 1 1 0 59.1 59.1 0.0
- 12. 0060SCHP 0060TCHP 0058SCHP 0058TCHP 56CHWGPM DCPLTSET DCPLTSET CHP1-AMP CHP2-AMP CHP2-VFD DCPL-VLV DCPL-VLV DCPL-FB 56CHR-T 56CHS-T CHW-DP CHW-DP CHW-DP DP-SET CHR-T CHR-T CHR-T CHR-T CHS-T CHS-T CHS-T CHS-T 49.8 45.0 0.8 43.6 55.4 3.01 47.0 55.4 10.0 10.0 53.7 0.1 11.9 42.0 100.0 100.6 43.7 48.4 4.1 45.5 48.1 46.0 69.1 49.8 45.0 0.8 43.7 55.5 3.02 46.9 55.3 10.0 10.0 53.8 0.1 11.9 42.0 100.0 100.6 43.8 48.4 4.3 45.5 48.1 46.0 67.6 49.8 45.0 0.8 43.8 55.4 3.03 47.0 55.4 10.0 10.0 53.8 0.1 11.9 42.0 100.0 100.6 44.0 48.3 4.5 45.5 48.1 46.0 65.6 49.8 45.0 0.8 43.8 55.5 3.04 47.0 55.4 10.0 10.0 53.8 0.1 11.9 42.0 100.0 100.6 44.0 48.3 4.6 45.5 48.1 46.0 63.8 49.8 45.0 0.8 43.9 55.5 3.00 47.2 55.4 10.0 10.0 53.8 0.1 11.9 42.0 100.0 100.6 44.0 48.3 4.7 45.5 48.1 46.0 61.9 49.8 45.0 0.8 43.9 55.5 3.02 47.2 55.4 10.0 10.0 53.8 0.1 11.9 42.0 100.0 100.6 44.1 48.3 4.8 45.5 48.1 46.0 60.0 49.8 45.0 0.8 43.8 55.4 3.01 47.2 55.4 10.0 10.0 53.8 0.1 11.9 42.0 100.0 100.6 44.1 48.4 5.0 45.5 48.1 46.0 58.2 49.8 45.0 0.8 43.7 55.3 3.02 47.0 55.4 10.0 10.0 53.7 0.1 11.9 42.0 100.0 100.6 43.8 48.5 5.1 45.5 48.1 46.0 56.3 49.8 45.0 0.8 43.7 55.4 3.03 46.9 55.3 10.0 10.0 53.7 0.1 11.9 42.0 100.0 100.6 43.8 48.7 5.2 45.5 48.1 46.0 54.4 49.8 45.0 0.8 43.7 55.4 3.06 46.8 55.3 10.0 10.0 53.7 0.1 11.9 42.0 100.0 100.6 43.8 48.8 5.3 45.5 48.1 46.0 52.5 49.8 45.0 0.8 43.7 55.4 3.08 46.8 55.3 10.0 10.0 53.5 0.1 11.9 42.0 100.0 100.6 43.8 48.9 5.4 45.5 48.1 46.0 50.6 49.8 45.0 0.8 43.8 55.3 3.14 46.8 55.4 10.0 10.0 53.4 0.1 11.9 42.0 100.0 100.6 43.8 49.0 5.6 45.6 48.6 46.0 49.7 49.8 45.0 0.8 43.9 55.3 3.11 46.8 55.3 10.0 10.0 53.3 0.1 11.9 42.0 100.0 100.6 44.0 49.3 5.6 46.4 48.6 46.0 58.3 49.8 45.0 0.8 44.0 55.3 3.15 46.8 55.4 10.0 10.0 53.7 0.1 11.8 42.0 100.0 100.6 44.0 49.4 5.6 46.4 48.6 46.0 60.0 49.8 45.0 0.8 43.9 55.3 3.13 46.8 55.3 10.0 10.0 53.3 0.1 11.8 42.0 100.0 100.6 43.8 49.8 5.7 46.4 48.6 46.0 61.5 49.8 45.0 0.8 43.9 55.3 3.10 46.8 55.2 10.0 10.0 53.3 0.1 11.8 42.0 100.0 100.6 44.0 49.9 5.5 46.4 48.6 46.0 63.2 49.8 45.0 0.8 43.9 55.3 3.06 46.8 55.2 10.0 10.0 53.3 0.1 11.8 42.0 100.0 100.6 44.1 50.0 5.4 46.4 48.6 46.0 64.8 49.8 45.0 0.8 43.7 55.3 3.03 46.8 55.2 10.0 10.0 53.5 0.1 11.8 42.0 100.0 100.6 44.2 50.2 5.3 46.4 48.6 46.0 66.4 49.8 45.0 0.8 43.6 55.3 3.00 46.8 55.2 10.0 10.0 53.5 0.1 11.8 42.0 100.0 100.6 44.1 50.4 5.1 46.5 48.6 46.0 69.1 49.8 45.0 0.8 43.6 55.3 2.96 46.8 55.2 10.0 10.0 53.5 0.1 11.8 42.0 100.0 100.6 44.1 50.5 4.8 46.6 48.6 46.0 72.4 49.8 45.0 0.8 43.6 55.3 2.90 46.9 55.3 10.0 10.0 53.7 0.1 11.8 42.0 100.0 100.6 43.8 50.5 4.5 46.7 48.7 46.0 76.2 49.8 45.0 0.8 43.5 55.3 2.90 46.9 55.2 10.0 10.0 53.6 0.1 11.8 42.0 100.0 100.6 43.7 50.4 4.2 46.7 48.8 46.0 79.1 49.8 45.0 0.8 43.6 55.3 2.90 47.0 55.3 10.0 10.0 53.5 0.1 11.8 42.0 100.0 100.6 43.7 50.3 3.9 46.7 48.8 46.0 81.9 49.8 45.0 0.8 43.6 55.3 2.90 47.0 55.3 10.0 10.0 53.5 0.1 11.8 42.0 100.0 100.6 43.7 50.2 3.9 46.4 48.8 46.0 80.8 49.8 45.0 0.8 43.6 55.3 2.90 46.9 55.2 10.0 10.0 53.5 0.1 11.8 42.0 100.0 100.6 43.7 49.9 3.9 46.3 48.8 46.0 81.1 49.8 45.0 0.8 43.6 55.3 2.91 46.9 55.3 10.0 10.0 53.3 0.1 11.8 42.0 100.0 100.6 43.8 49.7 3.9 45.9 48.8 46.0 77.9 49.8 45.0 0.8 43.7 55.3 2.93 47.0 55.2 10.0 10.0 53.3 0.1 11.8 42.0 100.0 100.6 43.8 49.3 3.9 45.9 48.8 46.0 77.6 49.8 45.0 0.8 43.9 55.3 2.93 47.0 55.2 10.0 10.0 53.3 0.1 11.8 42.0 100.0 100.6 44.1 49.1 3.9 45.9 48.8 46.0 77.4 49.8 45.0 0.8 44.0 55.3 2.93 47.2 55.2 10.0 10.0 53.2 0.1 11.8 42.0 100.0 100.6 44.2 49.0 3.9 45.9 48.8 46.0 77.1 49.8 45.0 0.8 43.9 55.3 2.91 47.2 55.3 10.0 10.0 53.2 0.1 11.8 42.0 100.0 100.6 44.1 48.8 3.9 45.9 48.6 46.0 76.9 49.8 45.0 0.8 43.9 55.3 2.87 47.2 55.2 10.0 10.0 53.2 0.1 11.8 42.0 100.0 100.6 44.1 48.8 3.9 45.9 48.6 46.0 76.6 49.8 45.0 0.8 43.8 55.4 2.83 47.2 55.2 10.0 10.0 53.3 0.1 11.8 42.0 100.0 100.6 43.8 48.7 3.8 45.9 48.6 46.0 76.4 49.8 45.0 0.8 43.7 55.3 2.82 47.2 55.3 10.0 10.0 53.2 0.1 11.8 42.0 100.0 100.6 43.8 48.7 3.8 45.8 48.5 46.0 75.4 49.8 45.0 0.8 43.6 55.4 2.73 47.2 55.3 10.0 10.0 53.3 0.1 11.8 42.0 100.0 100.6 43.8 48.5 3.7 45.5 48.4 46.0 70.8 49.8 45.0 0.8 43.7 55.4 2.89 47.2 55.3 10.0 10.0 53.3 0.1 11.8 42.0 100.0 100.6 43.8 48.5 3.7 45.5 48.1 46.0 69.0 49.8 45.0 0.8 43.7 55.5 2.87 47.2 55.3 10.0 10.0 53.3 0.1 11.8 42.0 100.0 100.6 43.8 48.5 4.2 45.5 48.1 46.0 67.1 49.8 45.0 0.8 43.6 55.6 2.91 47.2 55.4 10.0 10.0 53.3 0.1 11.8 42.0 100.0 100.6 43.8 48.4 4.2 45.5 48.1 46.0 65.2 49.8 45.0 0.8 43.7 55.6 2.91 47.2 55.5 10.0 10.0 53.3 0.1 11.8 42.0 100.0 100.6 43.8 48.5 4.4 45.5 48.1 46.0 63.3 49.8 45.0 0.8 43.7 55.6 2.97 47.0 55.5 10.0 10.0 53.3 0.1 11.8 42.0 100.0 100.6 44.0 48.4 4.5 45.5 48.1 46.0 61.5 49.8 45.0 0.8 43.8 55.5 2.97 47.0 55.5 10.0 10.0 53.3 0.1 11.8 42.0 100.0 100.6 43.8 48.5 4.7 45.5 48.1 46.0 59.6 49.8 45.0 0.8 43.7 55.5 3.03 47.0 55.5 10.0 10.0 53.2 0.1 11.8 42.0 100.0 100.6 44.0 48.5 5.0 45.5 48.1 46.0 57.8 49.8 45.0 0.8 43.8 55.5 3.03 46.8 55.5 10.0 10.0 53.2 0.1 11.8 42.0 100.0 100.6 44.0 48.7 5.1 45.5 48.1 46.0 55.9 49.8 45.0 0.8 43.8 55.5 3.10 46.8 55.4 10.0 10.0 53.1 0.1 11.8 42.0 100.0 100.6 43.8 48.8 5.2 45.5 48.1 46.0 54.0 49.8 45.0 0.8 43.8 55.4 3.09 46.8 55.4 10.0 10.0 53.2 0.1 11.8 42.0 100.0 100.6 44.0 49.0 5.4 45.5 48.6 46.0 52.0 49.8 45.0 0.8 43.8 55.4 3.07 46.8 55.4 10.0 10.0 53.1 0.1 11.8 42.0 100.0 100.6 44.0 49.1 5.5 45.6 48.6 46.0 50.2 49.8 45.0 0.8 43.8 55.4 3.13 46.8 55.4 10.0 10.0 53.0 0.1 11.8 42.0 100.0 100.6 44.0 49.3 5.4 46.4 48.6 46.0 58.9 49.8 45.0 0.8 43.8 55.4 3.10 46.8 55.4 10.0 10.0 53.0 0.1 11.8 42.0 100.0 100.6 44.0 49.7 5.6 46.4 48.6 46.0 60.6 49.8 45.0 0.8 43.7 55.3 3.09 46.8 55.3 10.0 10.0 53.1 0.1 11.8 42.0 100.0 100.6 44.0 49.8 5.5 46.4 48.6 46.0 62.2
- 13. 49.8 45.0 0.8 43.7 55.3 3.08 46.8 55.3 10.0 10.0 53.2 0.1 11.8 42.0 100.0 100.6 44.0 49.9 5.5 46.4 48.6 46.0 63.8 49.8 45.0 0.8 43.7 55.3 3.05 46.8 55.2 10.0 10.0 53.1 0.1 11.8 42.0 100.0 100.6 44.0 50.0 5.4 46.4 48.6 46.0 65.4 49.8 44.9 0.8 43.7 55.3 3.02 46.8 55.2 10.0 10.0 53.2 0.1 11.8 42.0 100.0 100.6 44.0 50.3 5.2 46.5 48.6 46.0 67.9 49.8 45.0 0.8 43.8 55.3 2.97 46.8 55.3 10.0 10.0 53.3 0.1 11.8 42.0 100.0 100.6 44.0 50.4 5.0 46.5 48.7 46.0 70.1 49.8 45.0 0.8 43.8 55.3 2.93 46.9 55.3 10.0 10.0 53.2 0.1 11.8 42.0 100.0 100.6 44.0 50.4 4.6 46.7 48.7 46.0 74.9 49.8 45.0 0.8 43.9 55.3 2.95 47.0 55.3 10.0 10.0 53.3 0.1 11.8 42.0 100.0 100.6 44.0 50.5 4.3 46.7 48.7 46.0 77.8 49.8 45.0 0.8 43.9 55.3 2.91 47.2 55.3 10.0 10.0 53.3 0.1 11.8 42.0 100.0 100.6 44.0 50.4 4.1 46.7 48.7 46.0 80.7 49.8 45.0 0.8 43.7 55.3 2.93 47.0 55.3 10.0 10.0 53.3 0.1 11.8 42.0 100.0 100.6 44.0 50.3 3.8 46.7 48.7 46.0 83.2 49.8 45.0 0.8 43.5 55.3 2.94 46.9 55.2 10.0 10.0 53.3 0.1 11.8 42.0 100.0 100.6 43.7 50.0 3.8 46.3 48.7 46.0 80.5 49.8 45.0 0.8 43.4 55.4 2.90 46.8 55.3 10.0 10.0 53.2 0.1 11.8 42.0 100.0 100.6 43.6 49.8 3.9 45.9 48.7 46.0 77.6 49.8 45.0 0.8 43.6 55.4 2.89 46.8 55.3 10.0 10.0 53.0 0.1 11.8 42.0 100.0 100.6 43.8 49.4 3.8 45.9 48.7 46.0 77.4 49.8 45.0 0.8 43.9 55.4 2.86 47.2 55.4 10.0 10.0 53.0 0.1 11.8 42.0 100.0 100.6 44.1 49.3 3.8 45.9 48.7 46.0 77.1 49.8 45.0 0.8 43.9 55.4 2.81 47.2 55.3 10.0 10.0 53.0 0.1 11.8 42.0 100.0 100.6 44.1 49.0 3.8 45.9 48.7 46.0 76.9 49.8 45.0 0.8 44.0 55.4 2.81 47.3 55.2 10.0 10.0 53.1 0.1 11.8 42.0 100.0 100.6 44.2 48.9 3.7 45.9 48.6 46.0 76.6 49.8 45.0 0.8 43.9 55.3 2.82 47.3 55.3 10.0 10.0 53.1 0.1 11.8 42.0 100.0 100.6 44.1 48.8 3.7 45.9 48.6 46.0 76.4 49.8 45.0 0.8 43.7 55.4 2.83 47.2 55.4 10.0 10.0 53.2 0.1 11.8 42.0 100.0 100.6 43.8 48.7 3.7 45.9 48.6 46.0 76.1 49.8 45.0 0.8 43.6 55.4 2.85 47.2 55.3 10.0 10.0 53.2 0.1 11.8 42.0 100.0 100.6 43.7 48.7 3.7 45.5 48.6 46.0 71.4 49.8 45.0 0.8 43.6 55.4 2.90 47.0 55.3 10.0 10.0 53.3 0.1 11.8 42.0 100.0 100.6 43.8 48.7 3.8 45.5 48.6 46.0 69.4 49.8 45.0 0.8 43.8 55.6 2.92 47.2 55.4 10.0 10.0 53.3 0.1 11.8 42.0 100.0 100.6 44.0 48.5 4.1 45.5 48.1 46.0 67.6 49.8 45.0 0.8 43.9 55.6 2.96 47.2 55.5 10.0 10.0 53.3 0.1 11.8 42.0 100.0 100.6 44.1 48.5 4.3 45.5 48.1 46.0 65.7 49.8 45.0 0.8 44.0 55.6 2.98 47.2 55.5 10.0 10.0 53.3 0.1 11.8 42.0 100.0 100.6 44.1 48.4 4.5 45.5 48.1 46.0 63.8 49.8 45.0 0.8 44.0 55.6 3.01 47.2 55.5 10.0 10.0 53.3 0.1 11.8 42.0 100.0 100.6 44.1 48.5 4.6 45.5 48.1 46.0 62.0 49.8 45.0 0.8 43.9 55.6 3.01 47.2 55.5 10.0 10.0 53.3 0.1 11.8 42.0 100.0 100.6 44.1 48.5 4.8 45.5 48.1 46.0 60.1 49.8 45.0 0.8 43.9 55.6 3.07 47.0 55.5 10.0 10.0 53.3 0.1 11.8 42.0 100.0 100.6 44.1 48.7 5.1 45.5 48.1 46.0 58.2 49.8 45.0 0.8 43.9 55.5 3.09 46.9 55.5 10.0 10.0 53.2 0.1 11.8 42.0 100.0 100.6 44.1 48.8 5.2 45.5 48.1 46.0 56.3 49.8 45.0 0.8 43.9 55.6 3.11 46.8 55.5 10.0 10.0 53.1 0.1 11.8 42.0 100.0 100.6 44.1 49.0 5.3 45.5 48.2 46.0 54.4 49.8 45.0 0.8 44.0 55.5 3.06 46.8 55.4 10.0 10.0 53.1 0.1 11.8 42.0 100.0 100.6 44.1 49.1 5.3 45.5 48.6 46.0 52.6 49.8 45.0 0.8 44.1 55.6 3.15 46.9 55.4 10.0 10.0 53.0 0.1 11.8 42.0 100.0 100.6 44.2 49.3 5.5 45.8 48.6 46.0 53.1 49.8 45.0 0.8 44.0 55.5 3.09 46.9 55.4 10.0 10.0 53.0 0.1 11.8 42.0 100.0 100.6 44.2 49.4 5.4 46.4 48.6 46.0 60.4 49.8 45.0 0.8 43.9 55.4 3.11 46.8 55.4 10.0 10.0 53.0 0.1 11.8 42.0 100.0 100.6 44.2 49.7 5.4 46.4 48.6 46.0 62.0 49.8 45.0 0.8 44.0 55.4 3.12 46.8 55.4 10.0 10.0 53.1 0.1 11.8 42.0 100.0 100.6 44.2 49.8 5.5 46.4 48.6 46.0 63.6 49.8 45.0 0.8 43.9 55.4 3.15 46.8 55.3 10.0 10.0 53.0 0.1 11.8 42.0 100.0 100.6 44.1 50.0 5.4 46.4 48.6 46.0 65.3 49.8 45.0 0.8 43.9 55.3 3.06 46.8 55.4 10.0 10.0 53.2 0.1 11.8 42.0 100.0 100.6 44.1 50.0 5.2 46.4 48.6 46.0 66.9 49.8 45.0 0.8 43.8 55.3 3.05 46.8 55.4 10.0 10.0 53.3 0.1 11.8 42.0 100.0 100.6 44.2 50.3 5.1 46.4 48.6 46.0 68.5 49.8 45.0 0.8 43.8 55.4 3.04 46.8 55.4 10.0 10.0 53.2 0.1 11.8 42.0 100.0 100.6 44.1 50.3 5.0 46.4 48.6 46.0 70.1 49.8 45.0 0.8 43.9 55.4 3.03 46.9 55.3 10.0 10.0 53.3 0.1 11.8 42.0 100.0 100.6 44.0 50.4 4.9 46.4 48.7 46.0 71.8 49.8 45.0 0.8 43.8 55.4 3.05 46.9 55.4 10.0 10.0 53.3 0.1 11.8 42.0 100.0 100.6 44.1 50.4 4.9 46.4 48.7 46.0 73.4 49.8 45.0 0.8 43.8 55.4 2.98 46.9 55.4 10.0 10.0 53.3 0.1 11.8 42.0 100.0 100.6 44.0 50.5 4.7 46.4 48.7 46.0 75.0 49.8 45.0 0.8 43.7 55.4 3.01 46.9 55.4 10.0 10.0 53.3 0.1 11.8 42.0 100.0 100.6 44.0 50.4 4.6 46.4 48.7 46.0 76.6 49.8 45.0 0.8 43.6 55.4 2.98 46.8 55.4 10.0 10.0 53.3 0.1 11.8 42.0 100.0 100.6 43.8 50.3 4.4 46.4 48.7 46.0 78.3 49.8 45.0 0.8 43.5 55.3 2.96 46.9 55.4 10.0 10.0 53.3 0.1 11.8 42.0 100.0 100.6 43.7 50.2 4.2 46.4 48.7 46.0 79.9 49.8 45.0 0.8 43.6 55.4 2.96 46.8 55.4 10.0 10.0 53.2 0.1 11.8 42.0 100.0 100.6 43.8 49.9 4.0 46.4 48.7 46.0 81.5 49.8 45.0 0.8 43.7 55.4 2.91 46.9 55.3 10.0 10.0 53.3 0.1 11.8 42.0 100.0 100.6 43.8 49.8 3.9 46.4 48.7 46.0 82.7 49.8 45.0 0.8 43.7 55.4 2.88 47.0 55.4 10.0 10.0 53.3 0.1 11.8 42.0 100.0 100.6 43.8 49.7 3.8 45.9 48.7 46.0 78.9 49.8 45.0 0.8 43.7 55.4 2.85 47.2 55.3 10.0 10.0 53.3 0.1 11.8 42.0 100.0 100.6 43.8 49.3 3.8 45.9 48.7 46.0 78.7 49.8 45.0 0.8 43.7 55.4 2.82 47.2 55.4 10.0 10.0 53.2 0.1 11.8 42.0 100.0 100.6 44.0 49.3 3.7 45.9 48.7 46.0 78.4 49.8 45.0 0.8 43.9 55.4 2.81 47.2 55.3 10.0 10.0 53.2 0.1 11.8 42.0 100.0 100.6 44.0 48.9 3.7 45.9 48.7 46.0 78.2 49.8 45.0 0.8 43.9 55.5 2.80 47.4 55.3 10.0 10.0 53.3 0.1 11.8 42.0 100.0 100.6 44.1 48.7 3.7 45.9 48.6 46.0 77.9 49.8 45.0 0.8 44.0 55.4 2.87 47.4 55.3 10.0 10.0 53.2 0.1 11.8 42.0 100.0 100.6 44.1 48.7 3.8 45.9 48.6 46.0 77.7 49.8 45.0 0.8 44.0 55.4 2.92 47.3 55.4 10.0 10.0 53.3 0.1 11.8 42.0 100.0 100.6 44.1 48.5 3.8 45.9 48.4 46.0 77.4 49.8 45.0 0.8 44.0 55.5 2.90 47.3 55.3 10.0 10.0 53.3 0.1 11.8 42.0 100.0 100.6 44.2 48.5 3.8 45.8 48.5 46.0 75.9 49.8 45.0 0.8 44.1 55.6 2.93 47.3 55.4 10.0 10.0 53.3 0.1 11.8 42.0 100.0 100.6 44.1 48.4 3.9 45.5 48.1 46.0 72.1 49.8 45.0 0.8 44.1 55.6 2.96 47.3 55.5 10.0 10.0 53.3 0.1 11.8 42.0 100.0 100.6 43.8 48.1 4.1 45.4 47.7 46.0 68.4 49.8 45.0 0.8 43.7 55.7 2.99 47.2 55.6 10.0 10.0 53.3 0.1 11.8 42.0 100.0 100.6 43.8 48.0 4.3 45.5 47.7 46.0 67.9