Download to read offline

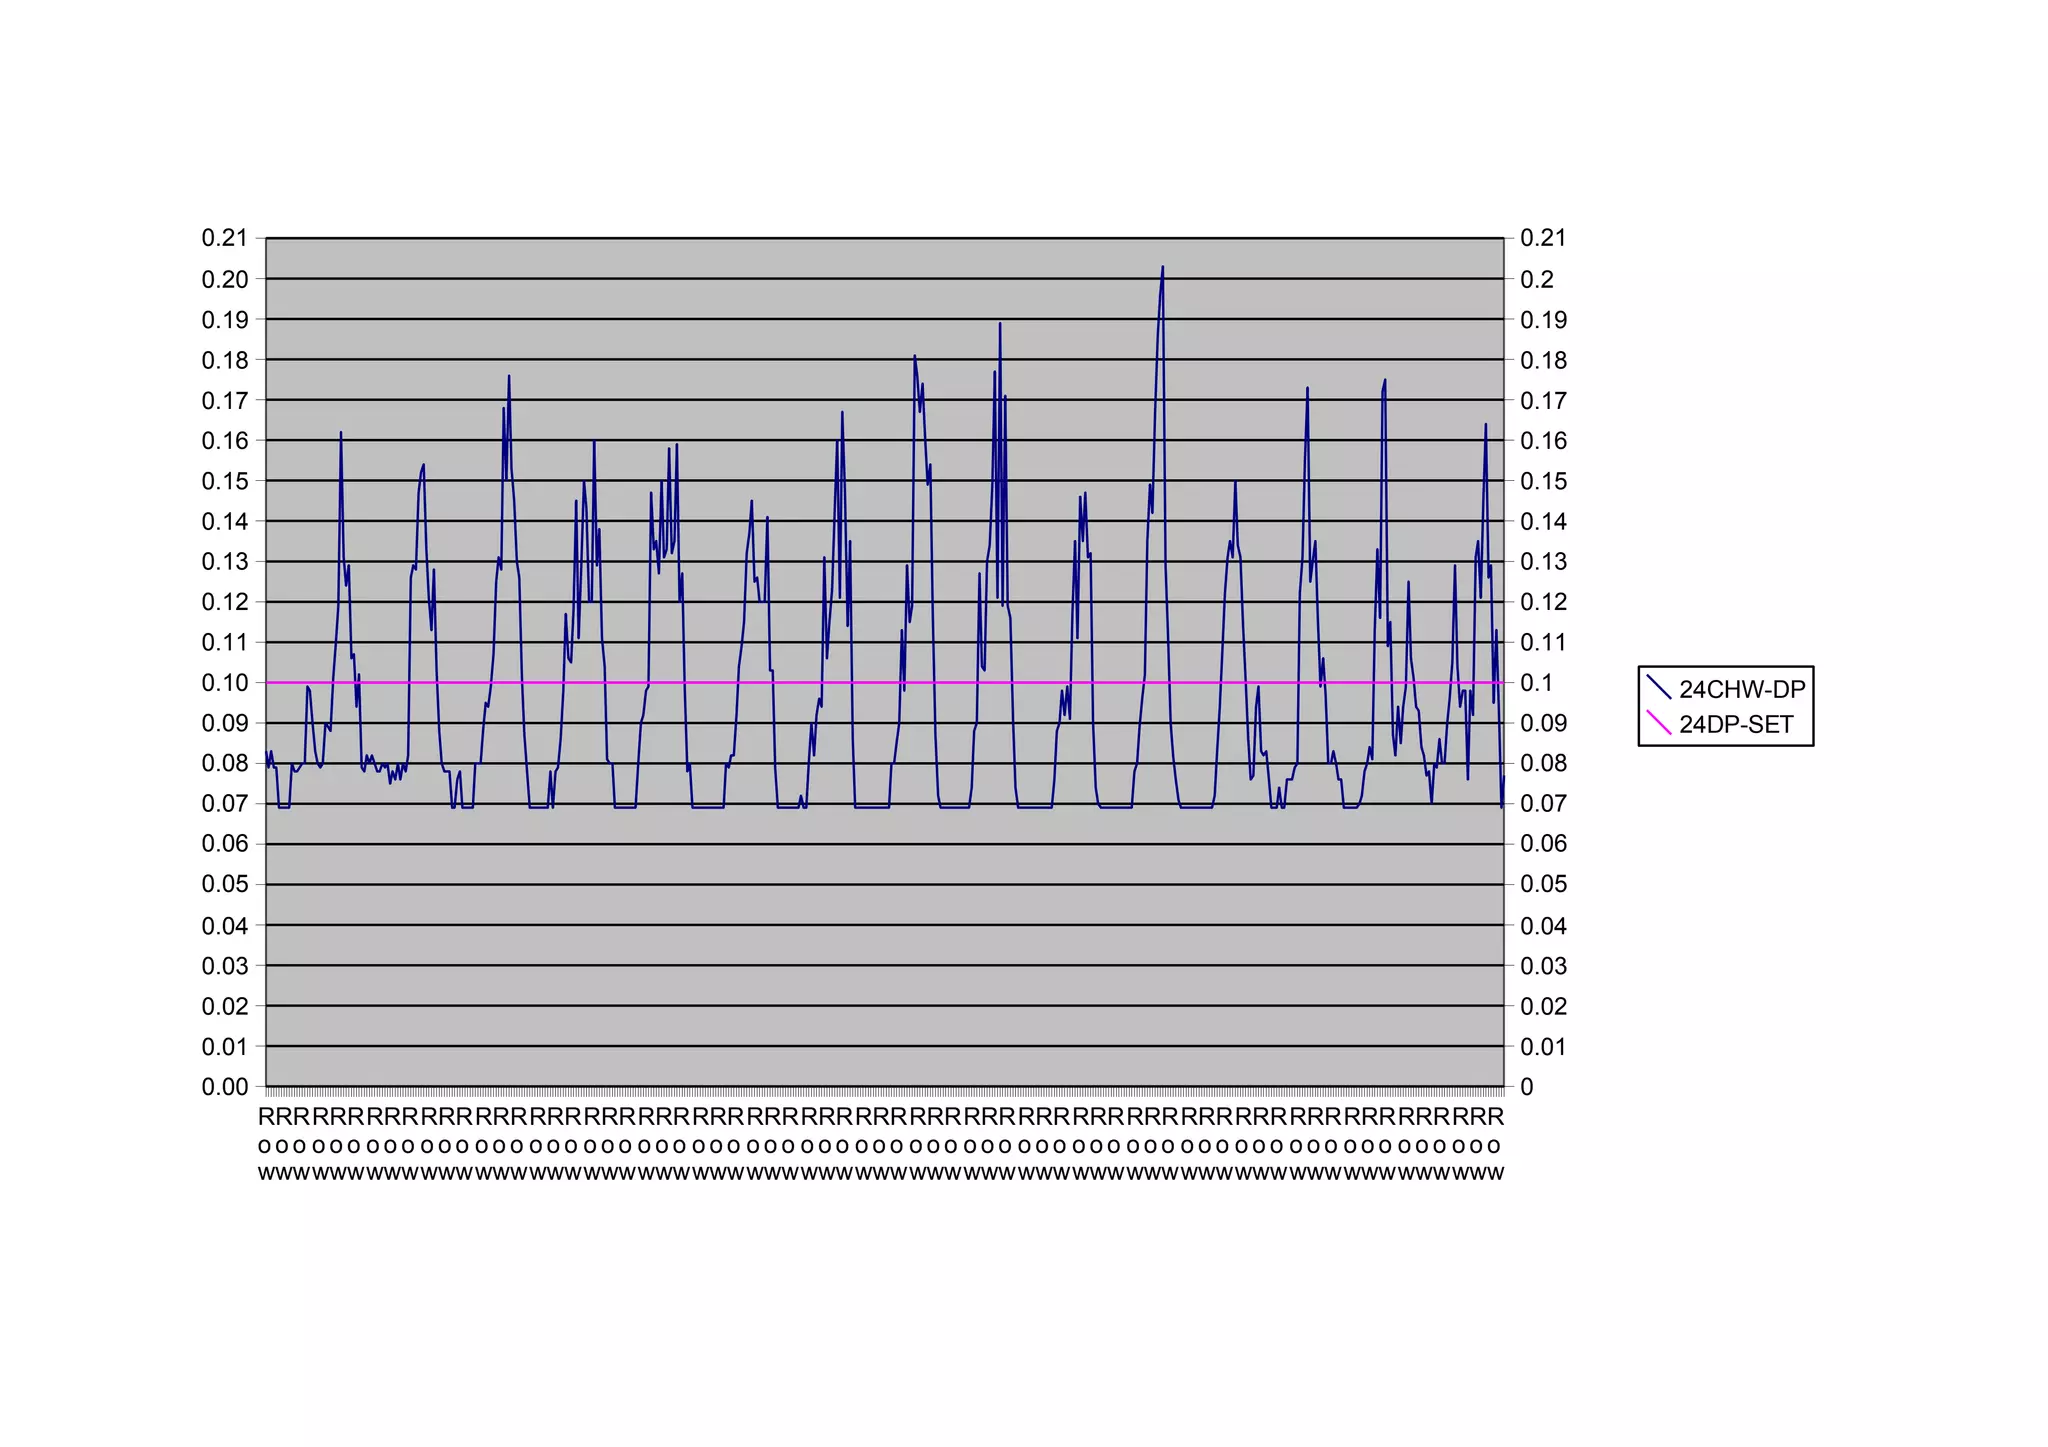

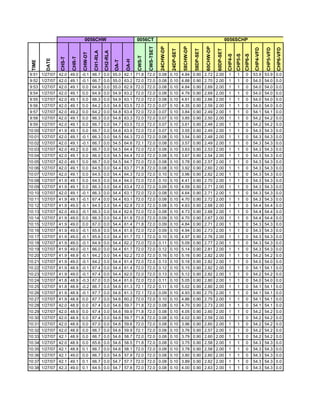
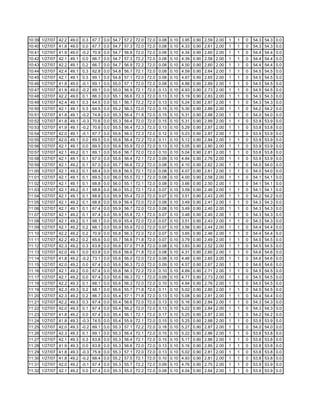
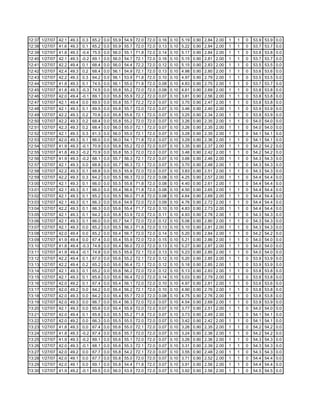
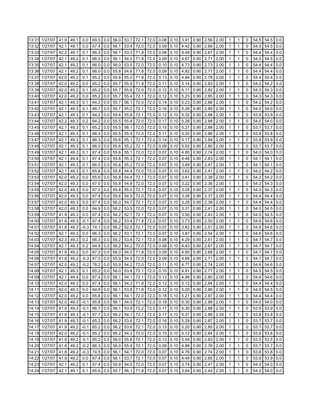
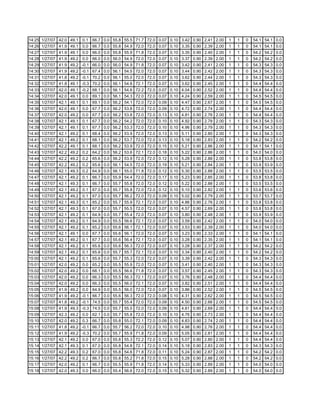
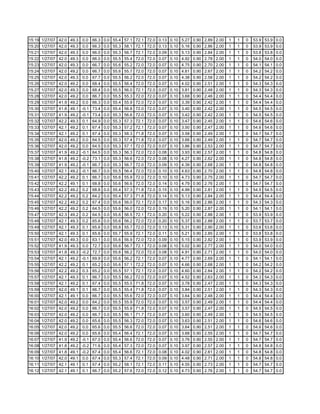
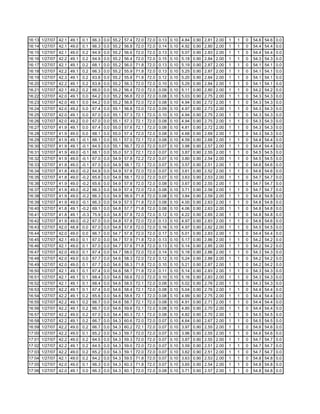
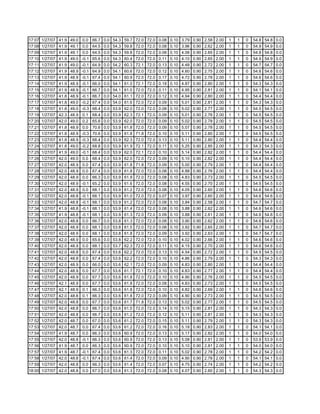
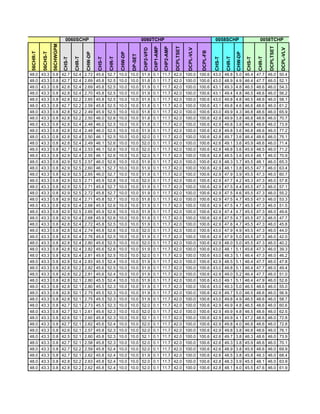
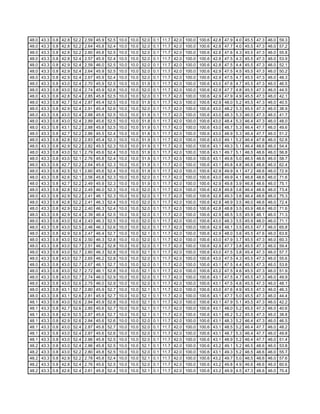

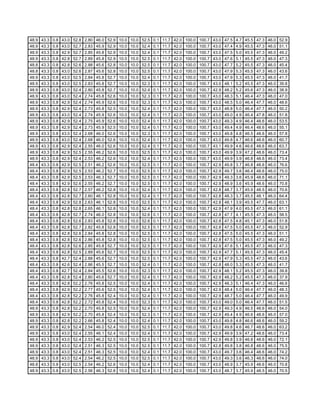
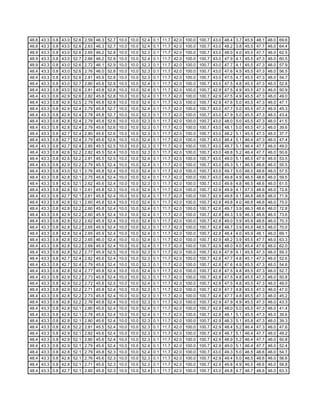
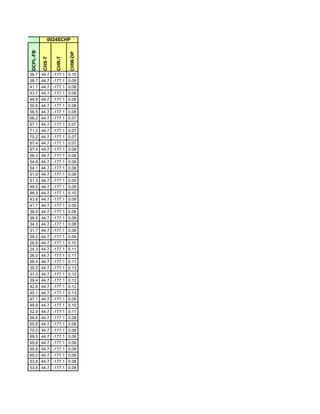
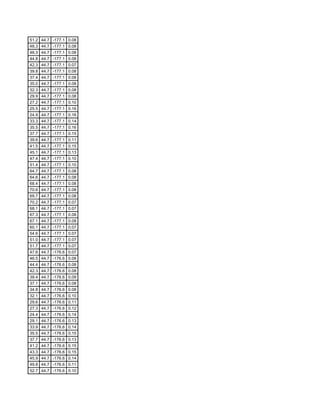
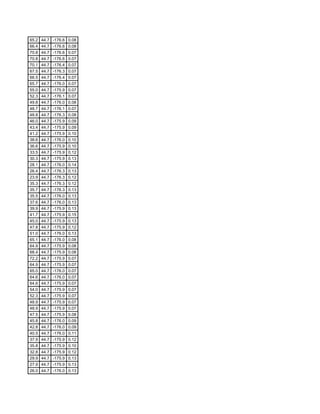

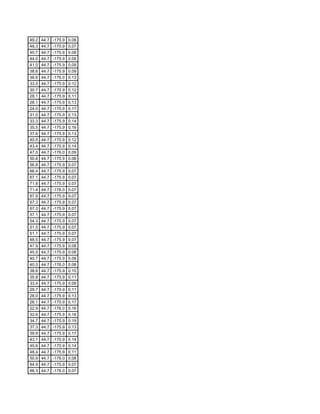
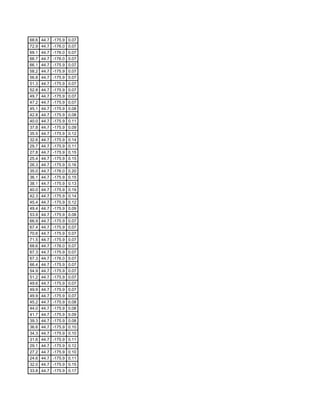
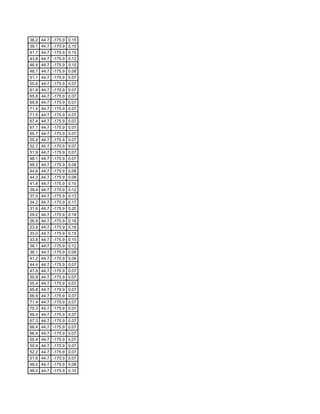
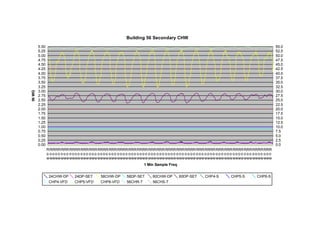

The document appears to be a log of temperature, pressure, and other system readings taken every minute over a 20 minute period. It includes outdoor air temperature and humidity, return air temperature, supply air temperature, chilled water supply and return temperatures, condenser water supply temperature, and readings from various pumps and compressors identified as CHP4-VFD, CHP5-VFD, etc. The readings fluctuate slightly but remain relatively stable over the course of the logging period.


![Getting Started with Apache Spark: Big Data Made Simple [Free Meetup]](https://cdn.slidesharecdn.com/ss_thumbnails/apachesparkgettingstarted-260203175547-8361bcc3-thumbnail.jpg?width=640&height=640&fit=bounds)


