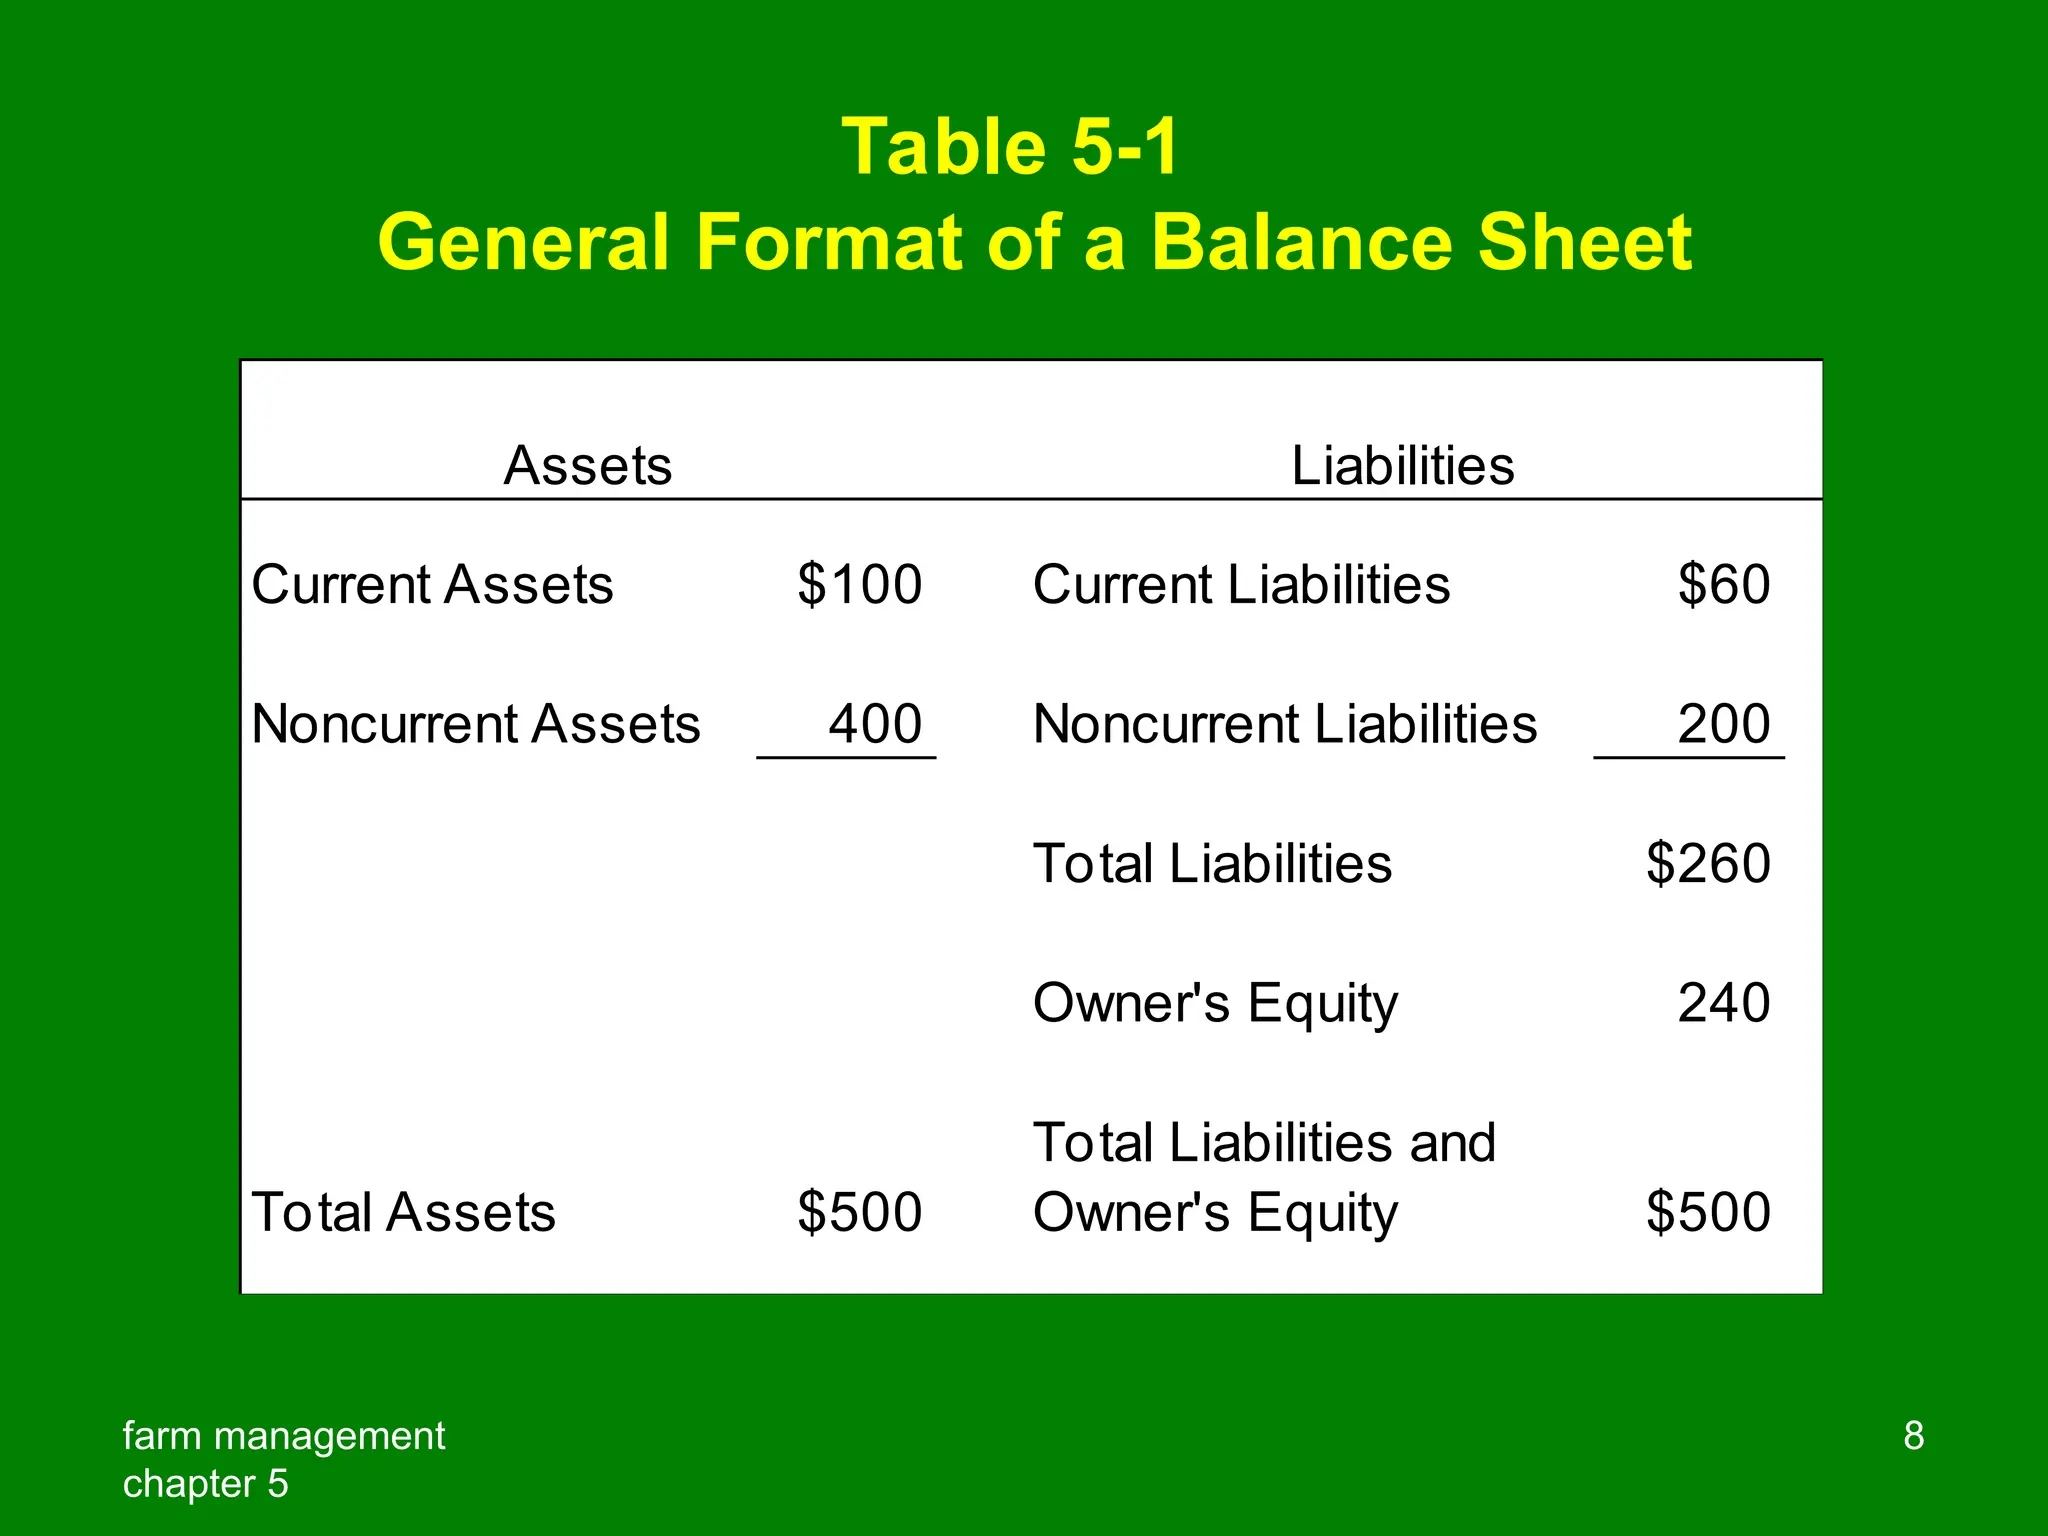
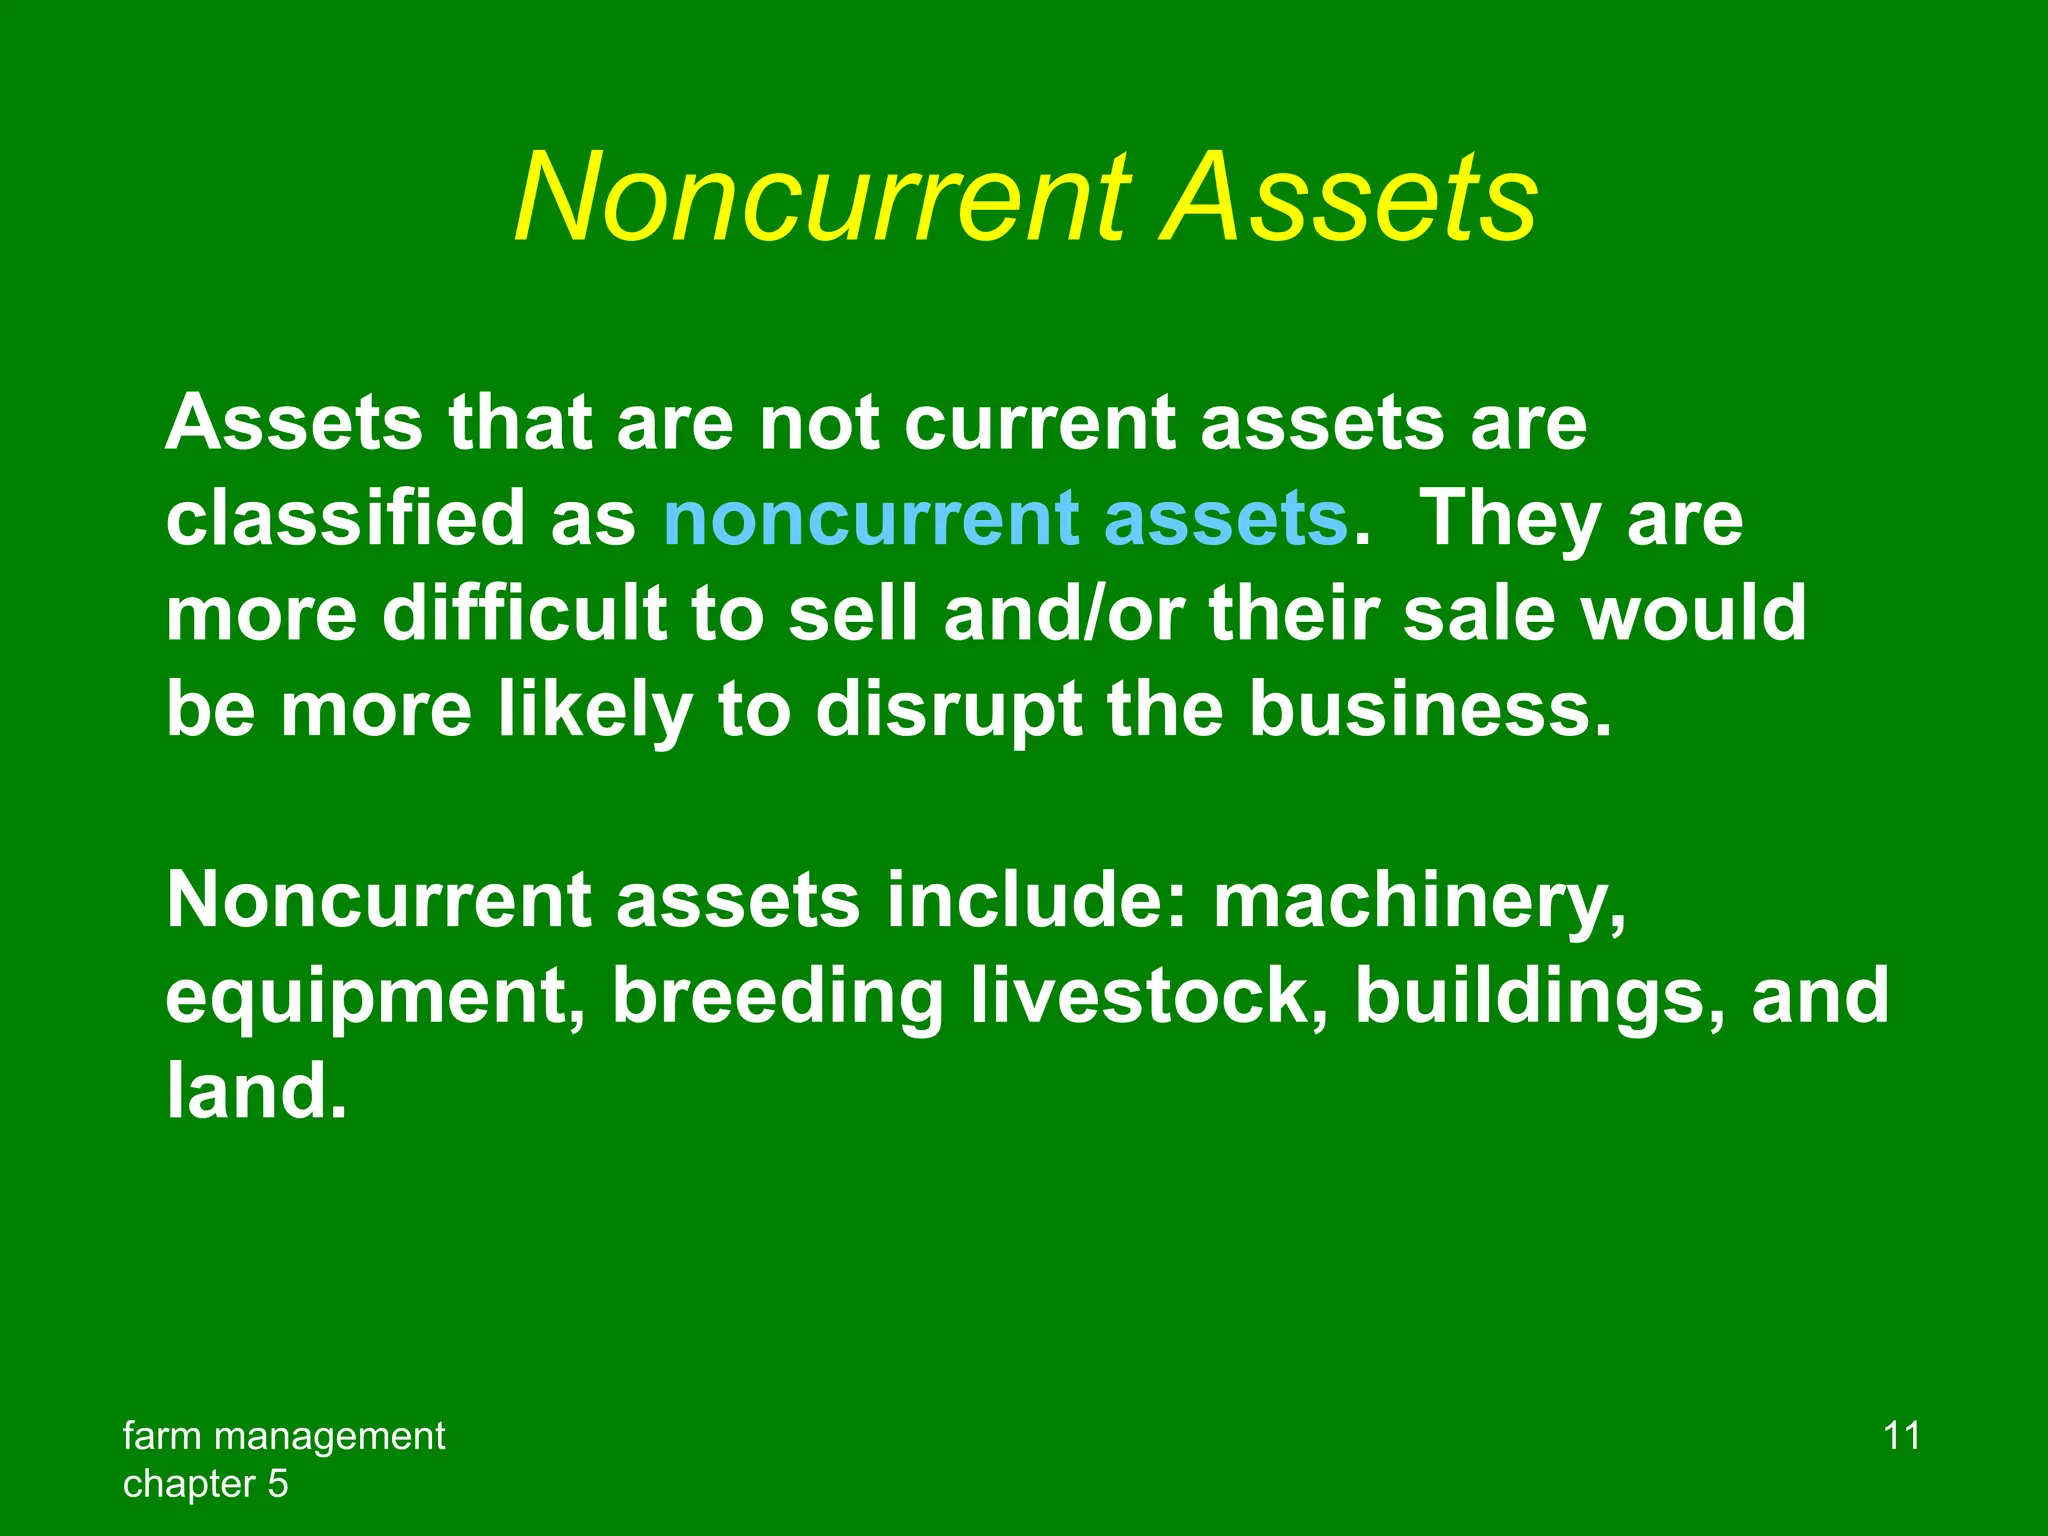
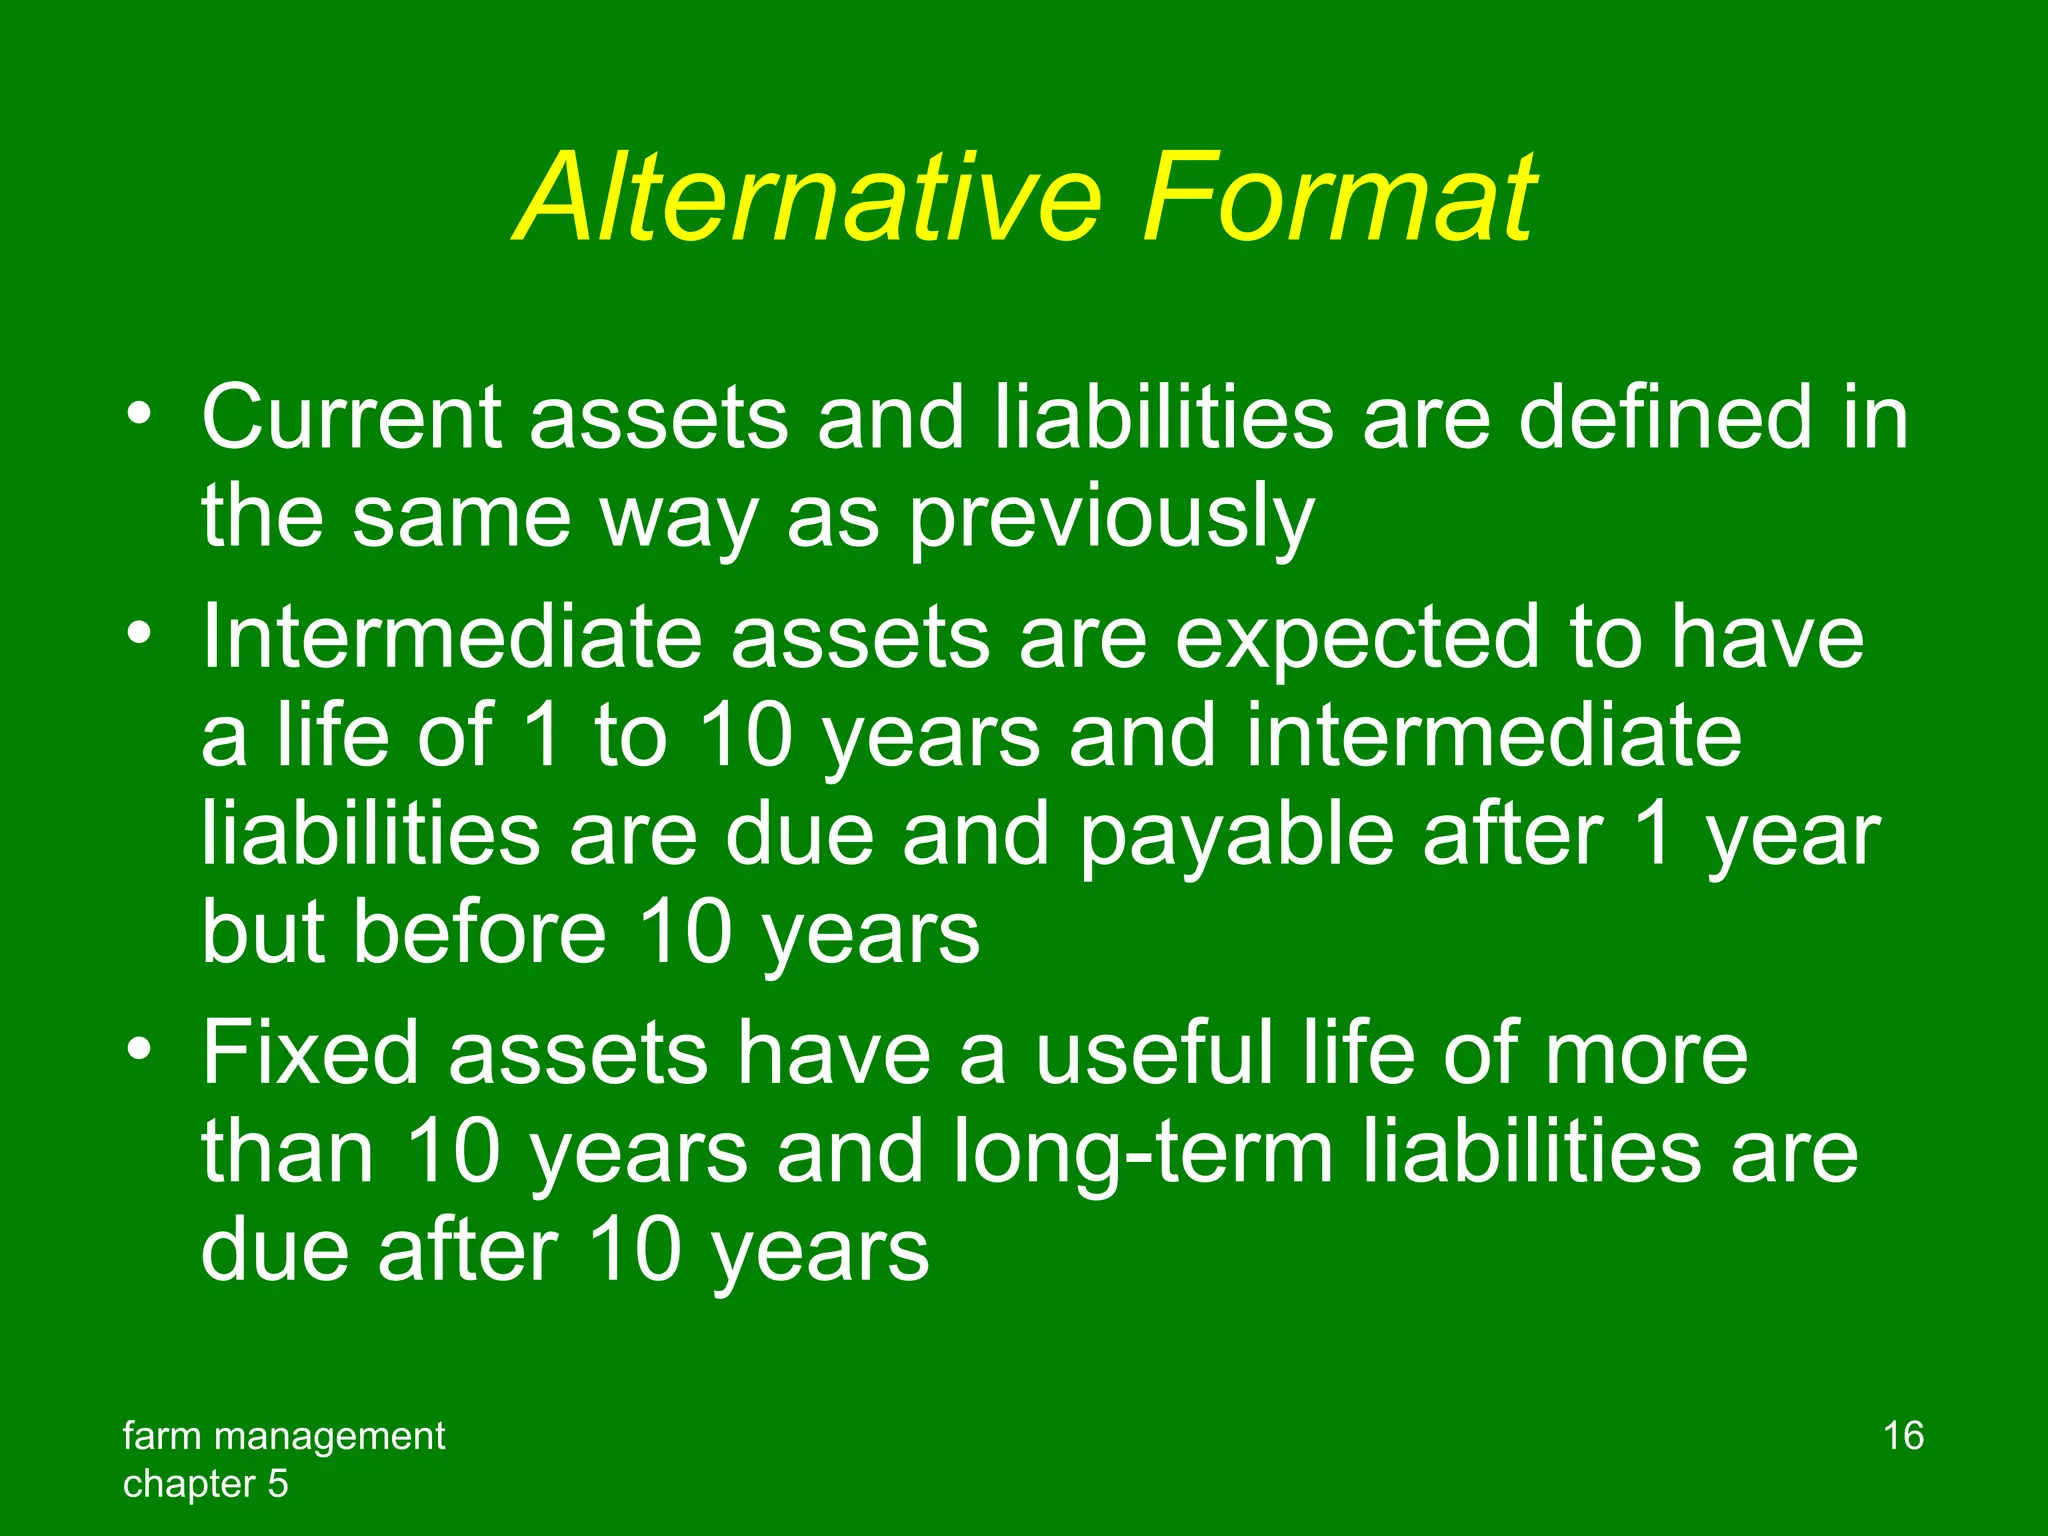
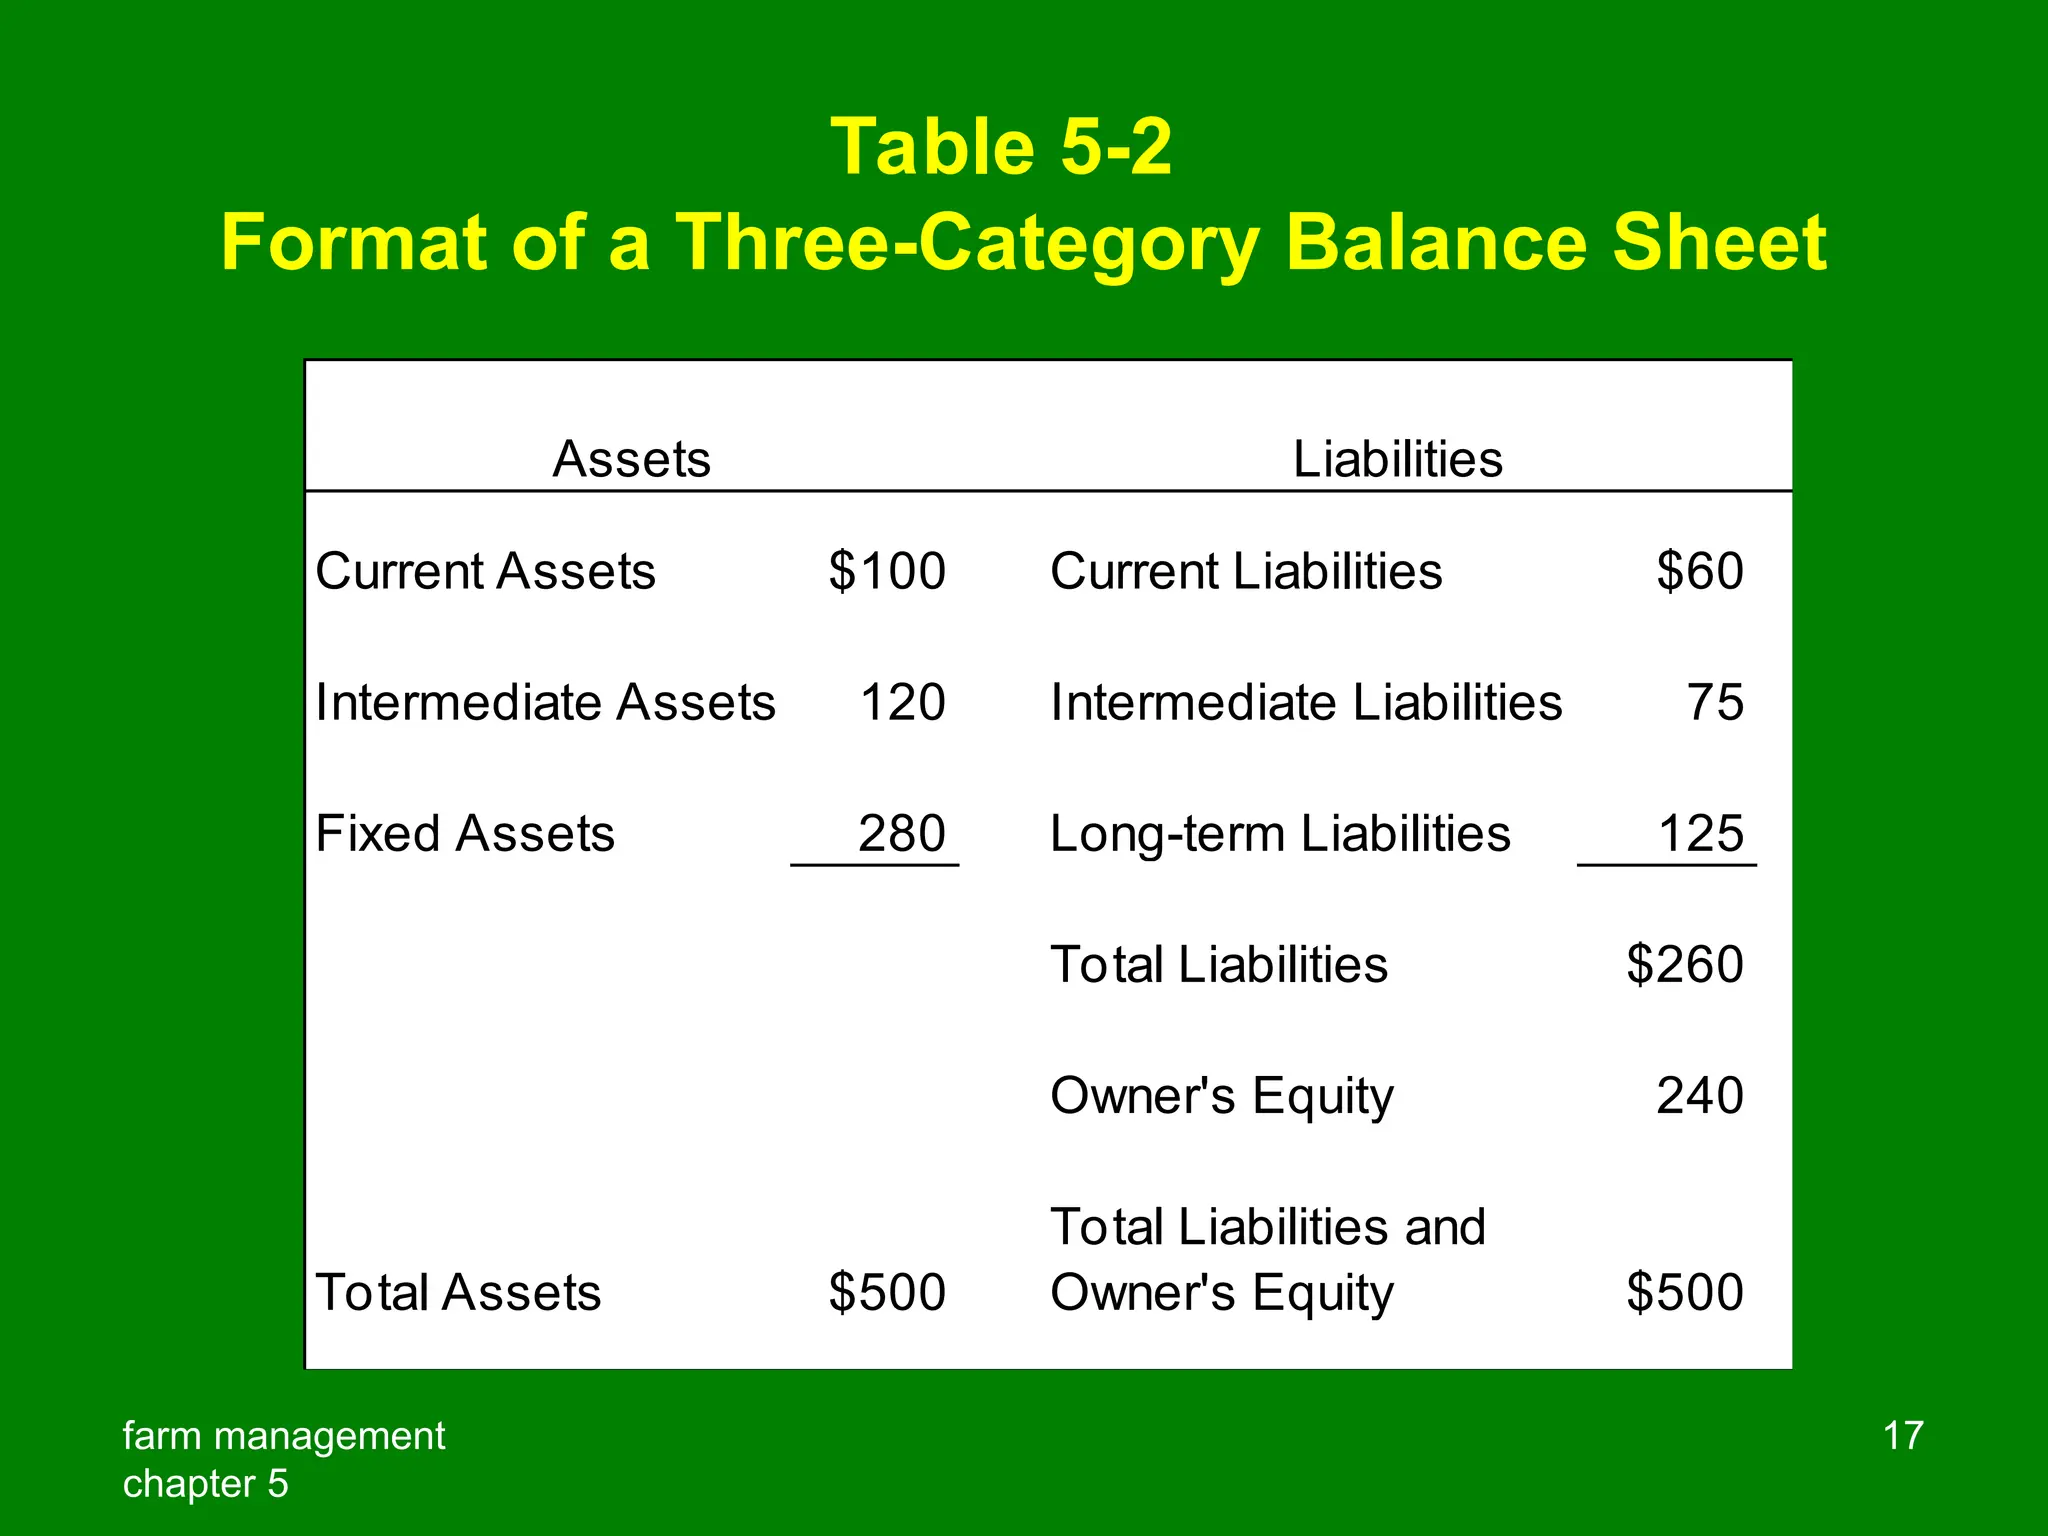
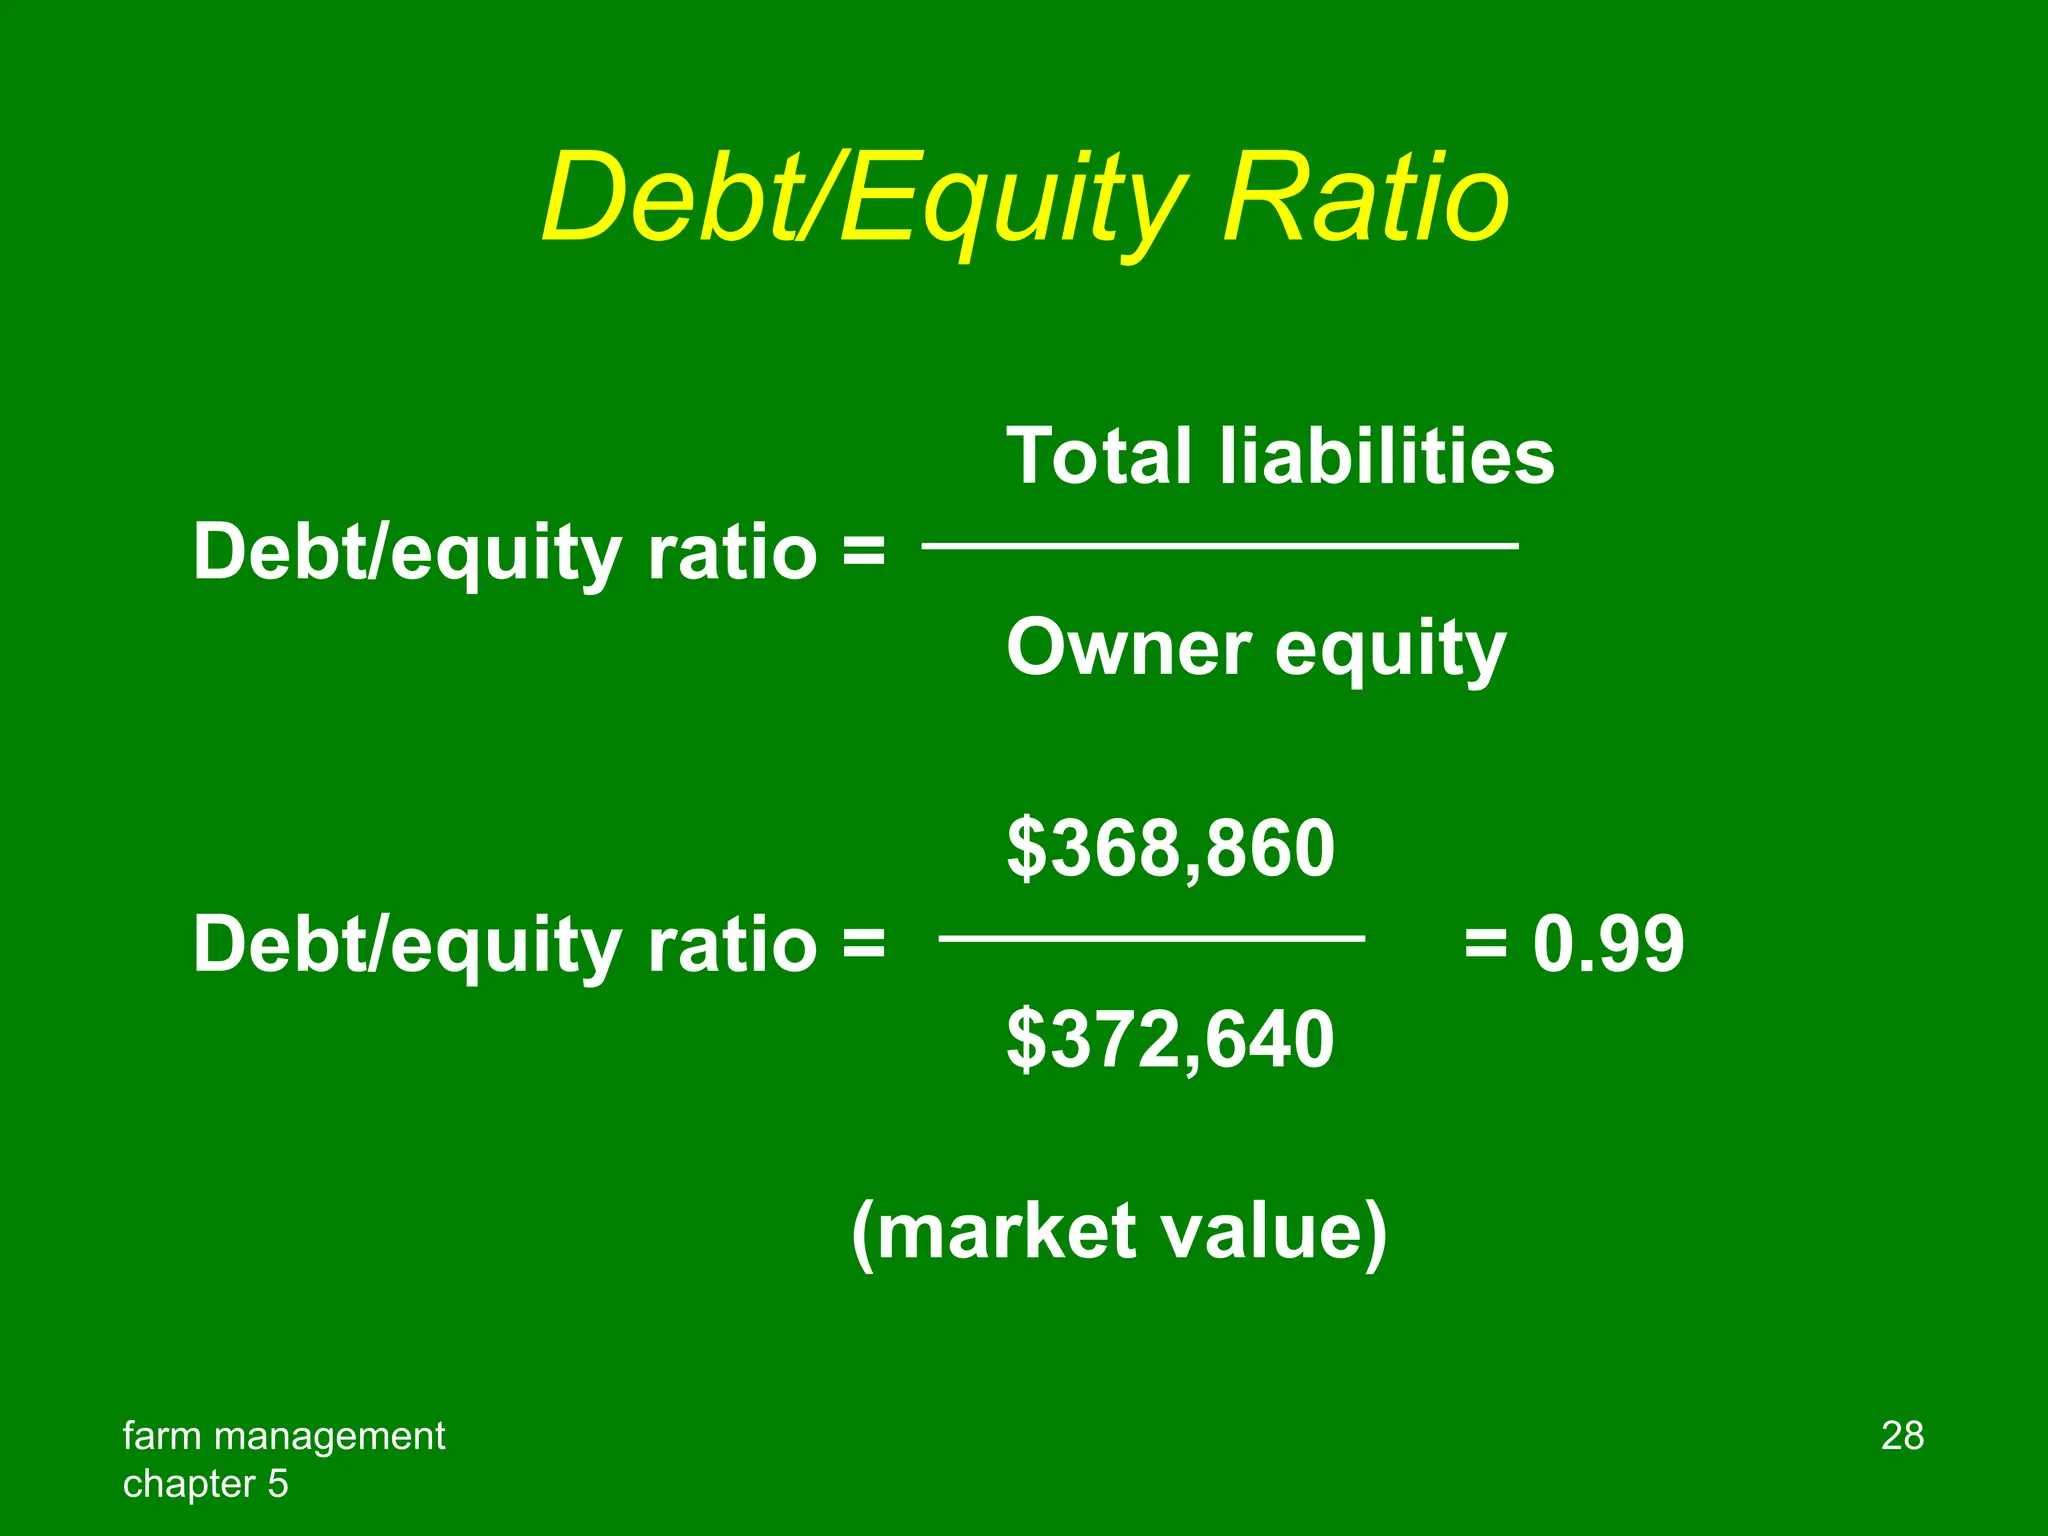
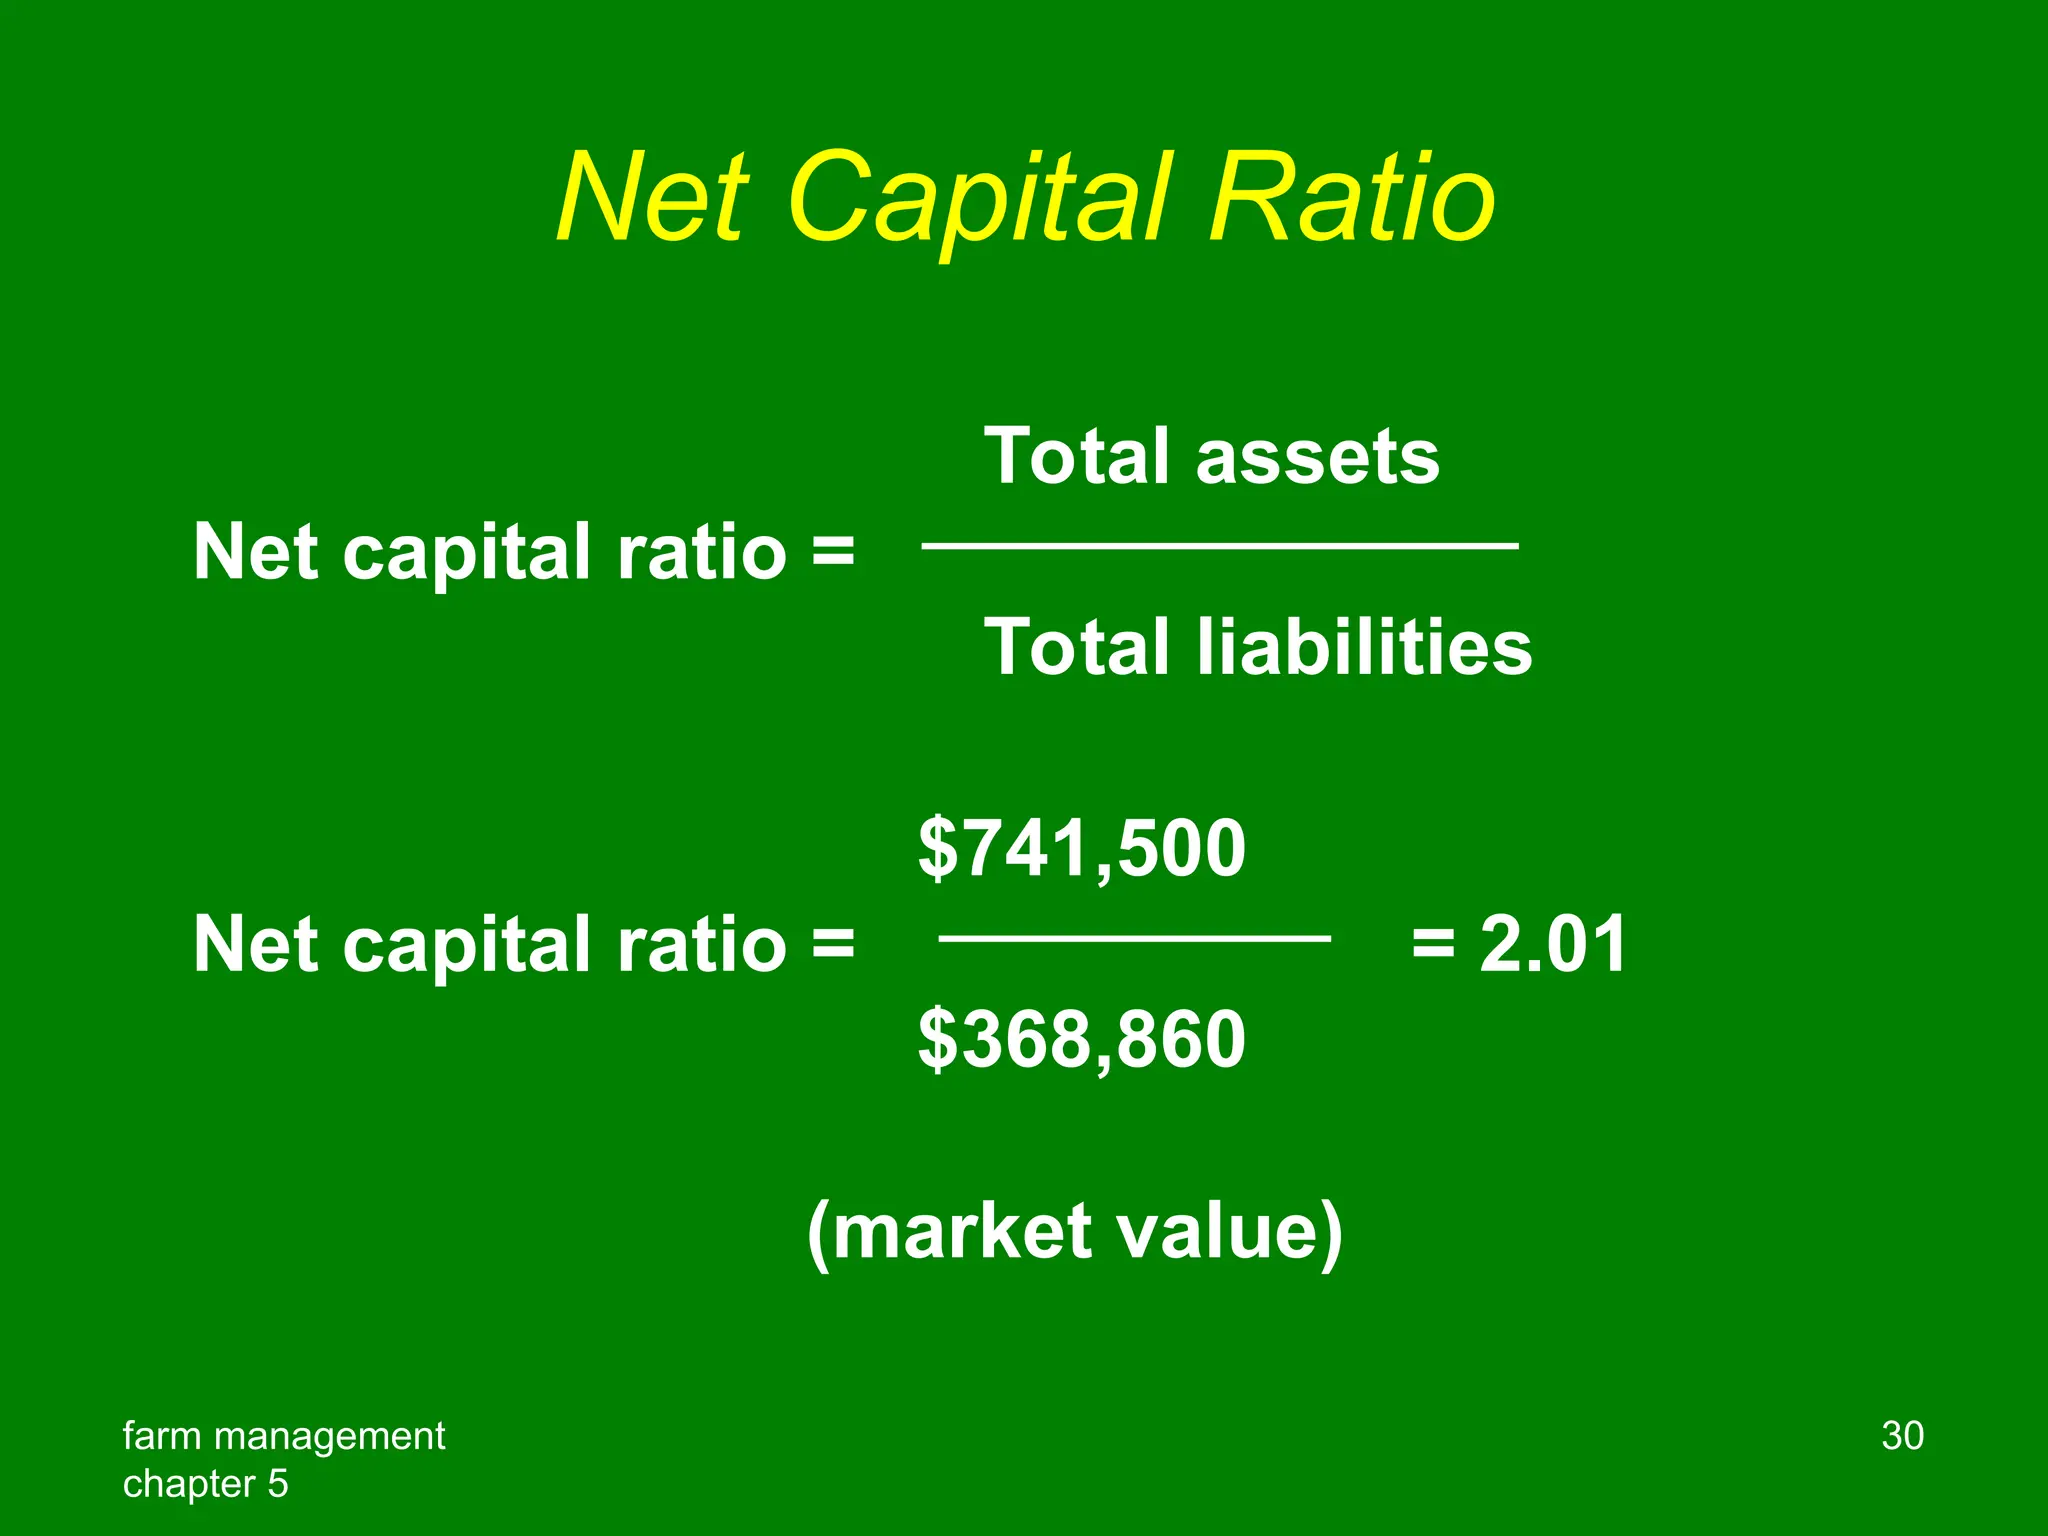
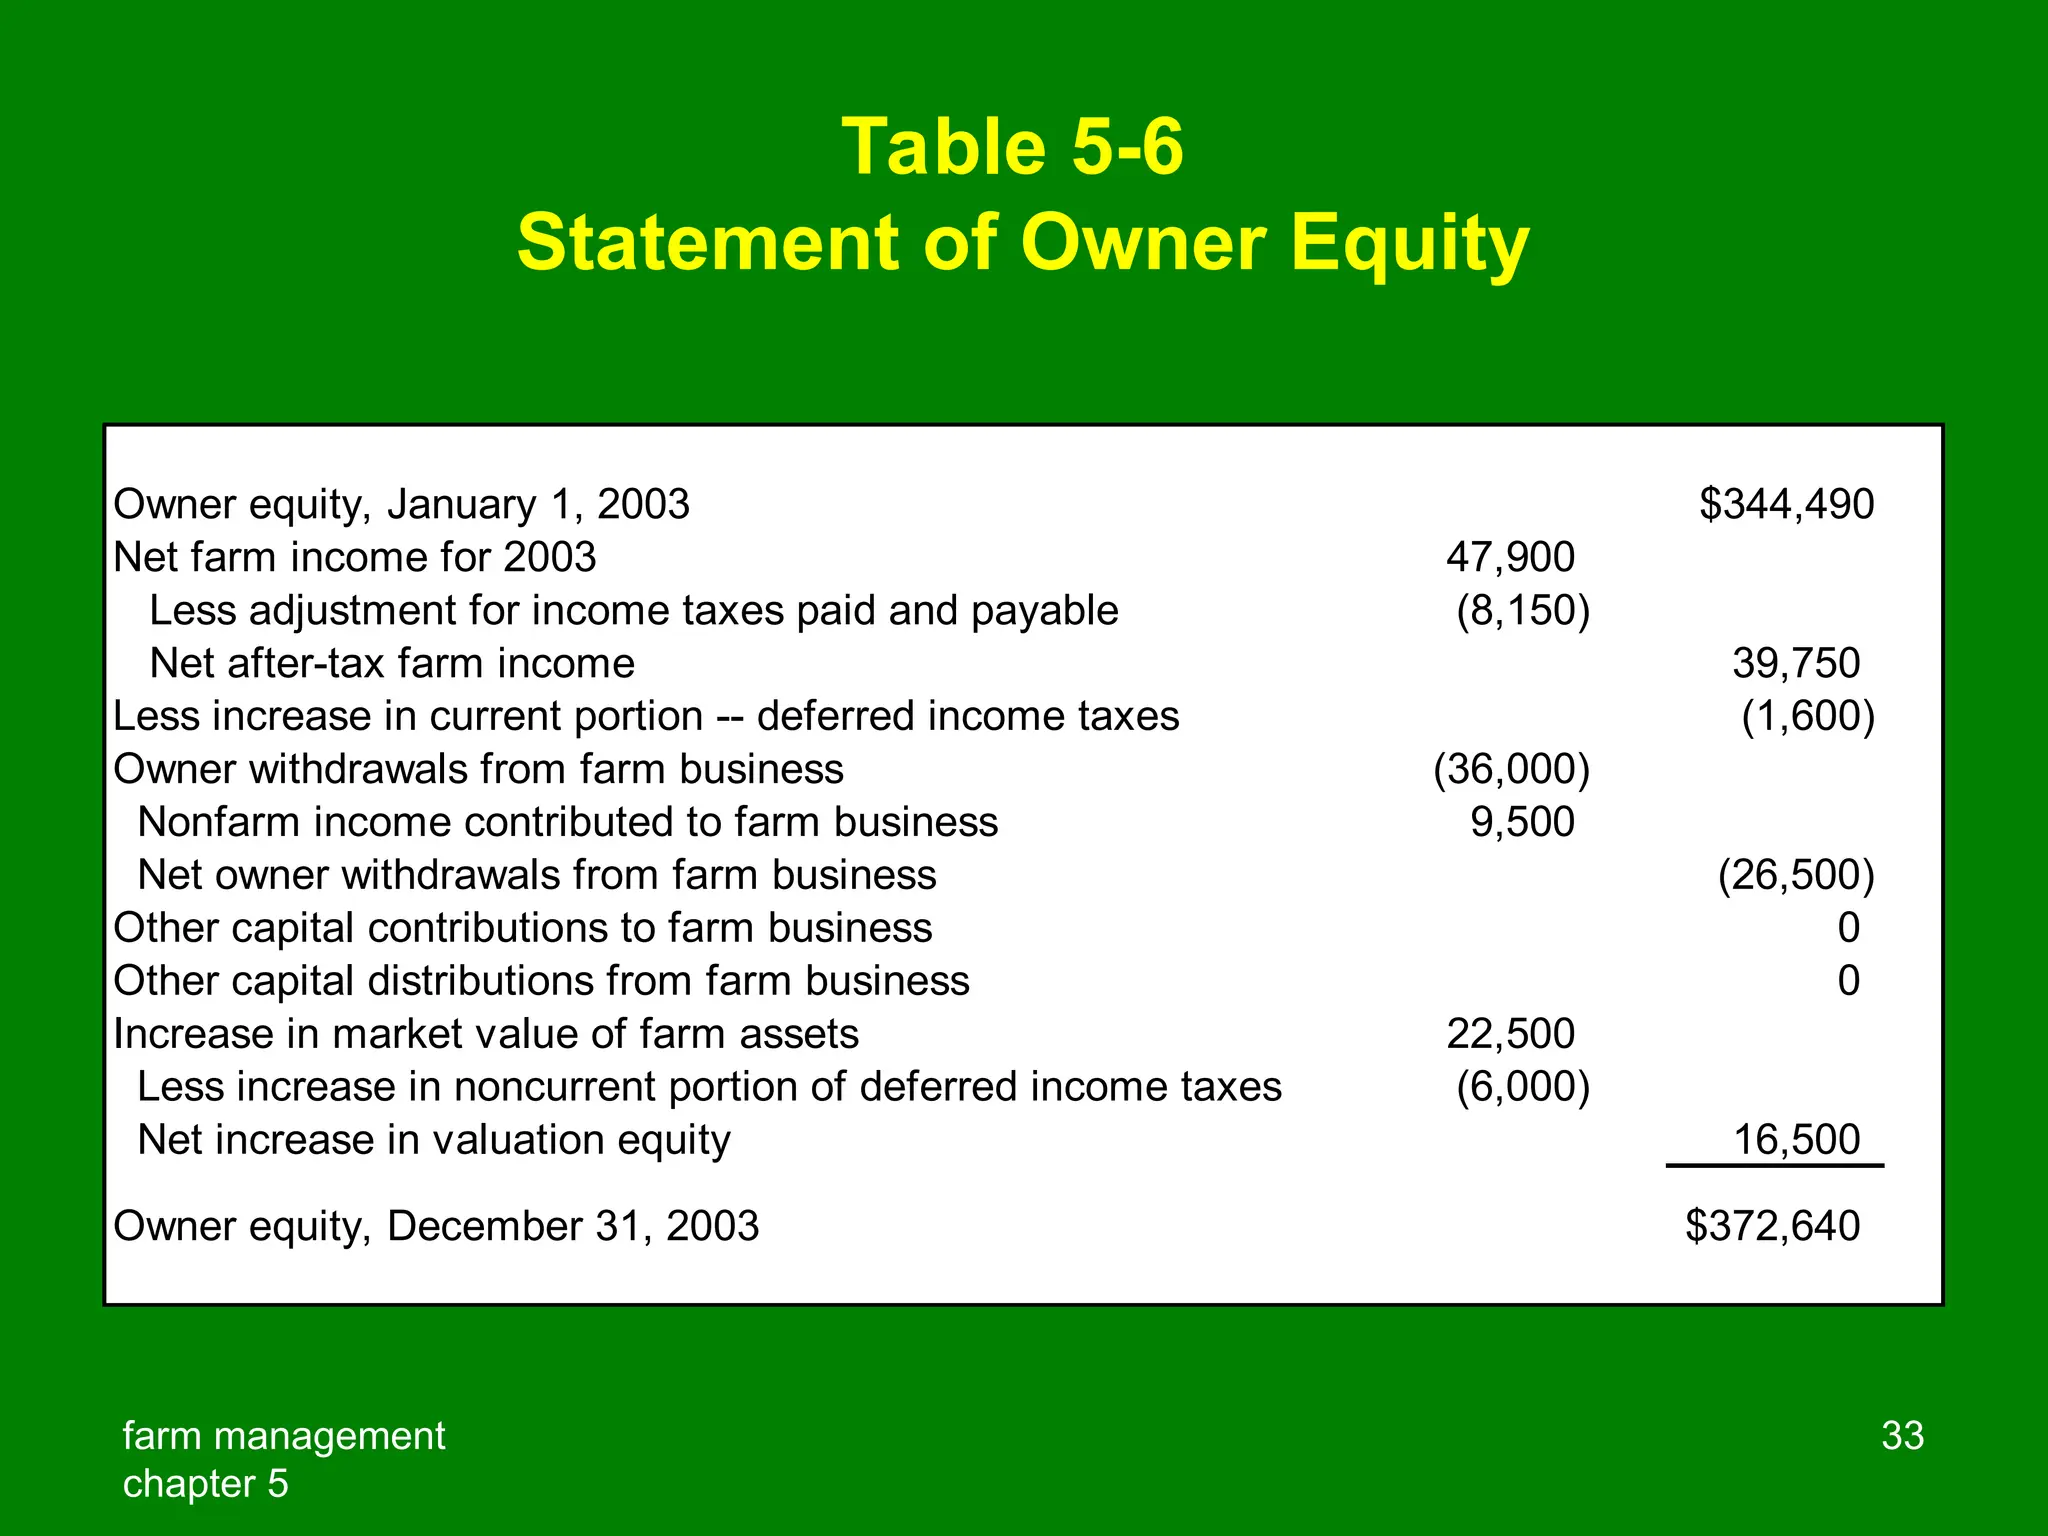
Farm Management
Chapter 5
The Balance Sheet and
Its Analysis
farm management
chapter 5
2
Chapter Outline
• Purpose and Use of a Balance Sheet
• Balance Sheet Format
• Asset Valuation and Related Problems
• Balance Sheet Example
• Balance Sheet Analysis
• Statement of Owner Equity
farm management
chapter 5
3
Chapter Objectives
1. To discuss the purpose of a balance sheet
2. To illustrate the format and structure of a balance
sheet
3. To outline some problems when valuing assets, and
the recommended valuation methods for different
types of assets
4. To show the difference between a cost and market
basis
5. To define owner equity or net worth and show its
importance
6. To analyze solvency and liquidity
7. To introduce and explain statement of owner equity
farm management
chapter 5
4
Purpose and Use of a Balance Sheet
• Systematic organization of everything
“owned” and “owed”
• Assets = liabilities + owner equity
• Owner equity = assets  liabilities
• Can complete at any time, but most
prepared at end of accounting period
• Provides measures of solvency and
liquidity
farm management
chapter 5
5
Solvency
Solvency measures the liabilities of the business
relative to the amount of owner equity invested
in the business. It provides an indication of the
ability to pay off all financial obligations or
liabilities if all assets were sold. If assets are
not greater than liabilities, the business is
insolvent.
farm management
chapter 5
6
Liquidity
Liquidity measures the ability of the business
to meet financial obligations as they come due
without disrupting the normal operations of
the business. Liquidity measures the ability
to generate cash needed to pay obligations.
Liquidity is generally measured over the next
accounting period and is a short-run concept.
farm management
chapter 5
7
Balance Sheet Format
• Assets shown on left or top
• Liabilities are shown on right or below
assets
• Owner equity shown on balance sheet and
liabilities + owner equity = assets
farm management
chapter 5
8
Table 5-1
General Format of a Balance Sheet
$100 $60
400 200
$260
240
$500 $500
Assets Liabilities
Noncurrent Assets
Current Assets Current Liabilities
Noncurrent Liabilities
Total Assets
Total Liabilities
Owner's Equity
Total Liabilities and
Owner's Equity
farm management
chapter 5
9
Assets
An asset has value for one of two reasons:
1) It can be sold to generate cash, or
2) It can be used to produce other goods
that in turn can be sold for cash in the
future.
farm management
chapter 5
10
Current Assets
Assets that can be sold easily to generate
cash are called liquid assets. Accounting
principles require current assets, which are
the more liquid assets, to be separated from
other assets on the balance sheet.
Current assets include: cash, marketable
stocks and bonds, accounts receivable, and
inventories of feed, grain, supplies and feeder
livestock.
farm management
chapter 5
11
Noncurrent Assets
Assets that are not current assets are
classified as noncurrent assets. They are
more difficult to sell and/or their sale would
be more likely to disrupt the business.
Noncurrent assets include: machinery,
equipment, breeding livestock, buildings, and
land.
farm management
chapter 5
12
Liabilities
A liability is an obligation or debt owed to
someone else. It represents an outsider’s
claim on the business.
farm management
chapter 5
13
Current Liabilities
Accounting principles require that current
liabilities be separated from other liabilities
on the balance sheet. Current liabilities are
financial obligations that will become due and
payable within one year from the date on the
balance sheet.
Examples: accounts payable, principal and
accrued interest on short-term loans, and
principal due within one year on longer
term loans.
farm management
chapter 5
14
Noncurrent Liabilities
Any liability that is not current is classified as
a noncurrent liability. These financial
obligations will become due and payable
some time after one year from the date
on the balance sheet.
farm management
chapter 5
15
Owner Equity
If all assets were to be sold and all debts paid
on the date of the balance sheet, the owner’s
equity would be the amount left over. Owner
equity changes when: 1) the business has a
profit or loss, 2) the owner invests more capital
from outside the business or withdraws money
from the business, or 3) assets change value.
Owner equity does not change when cash is
used to buy other assets or a loan is taken out
to purchase an asset with value equal to the
loan.
farm management
chapter 5
16
Alternative Format
• Current assets and liabilities are defined in
the same way as previously
• Intermediate assets are expected to have
a life of 1 to 10 years and intermediate
liabilities are due and payable after 1 year
but before 10 years
• Fixed assets have a useful life of more
than 10 years and long-term liabilities are
due after 10 years
farm management
chapter 5
17
Table 5-2
Format of a Three-Category Balance Sheet
$100 $60
120 75
280 125
$260
240
$500 $500
Total Assets
Intermediate Assets Intermediate Liabilities
Total Liabilities
Owner's Equity
Total Liabilities and
Owner's Equity
Fixed Assets
Current Assets Current Liabilities
Long-term Liabilities
Assets Liabilities
farm management
chapter 5
18
Asset Valuation and Related Problems
A cost-basis balance sheet has all assets valued
following the cost, cost less depreciation,
or farm production cost methods. The one
exception would be inventories of grain and
market livestock.
A market-basis balance sheet has all assets
valued at market value less estimated
selling costs.
farm management
chapter 5
19
Which is best?
Cost-basis balance sheets conform to
general accounting standards and are thus
comparable to balance sheets from other types
of businesses.
Market-basis balance sheets more accurately
reflect the actual financial position.
FFSC says both types of balance sheets are
needed for proper business analysis.
farm management
chapter 5
20
Table 5-3
Valuation Methods for Cost-Basis and
Market-Basis Balance Sheets
Cost Market
Basis Basis
Marketable securities Cost Market
Inventories of grain and
market livestock Market* Market
Accounts receivable Cost Cost
Prepaid expenses Cost Cost
Investment in growing crops Cost Cost
Purchased breeding livestock Cost Market
Raised breeding livestock Cost or a Market
base value
Machinery and Equipment Cost Market
Buildings and Improvements Cost Market
Land Cost Market
market livestock
Lower of cost or market is preferred for purchased grain and
Asset
*Market is acceptable for raised grain and market livestock
Table 5-4 Balance Sheet for I.M. Farmer,
December 31, 20XX
Currrent Assets: Cost Market Current Liabilities Cost Market
Cash/checking acct. $5,000 $5,000 Account Payable 6,000 6,000
Marketable securities 1,000 2,200 Notes payable within 1 year 15,000 15,000
Inventories Current portion of term debt 28,000 28,000
Crops 40,000 40,000 Accured Interest 15,700 15,700
Livestock 52,000 52,000 Income taxes payable 8,000 8,000
Supplies 4,000 4,000 Current portion - deferred taxes 15,020 15,260
Accounts receivable 1,200 1,200 Other accrued expenses 900 900
Prepaid expenses 500 500 Total Current Liabilities $88,620 $88,860
Investment in growing crops 7,600 7,600
Other current assets 0 0 Noncurrent Liabiltiies Cost Market
Total Current Assets $111,300 $112,500
Notes payable
Machinery 20,000 20,000
Noncurrent Assets: Cost Market Breeding Livestock 40,000 40,000
Real estate debt 175,000 175,000
Machines and equipment 67,500 95,000 Noncurrent portion - deferred taxes ------ 45,000
Breeding livestock (purch.) 48,000 60,000 Total Noncurrent Liabilities $235,000 $280,000
Breeding livestock (raised) 12,000 24,000 Total Liabilities $323,620 $368,860
Buildings and improvments 27,000 50,000
Land 288,000 400,000 Owner Equity
Other noncurrent assets 0 0
Total Noncurrent Assets $442,500 $629,000 Contributed capital 50,000 50,000
Total Assets $553,800 $741,500 Retained earnings 180,180 180,180
Valuation adjustment ------- 142,460
Total Equity $230,180 $372,640
Total liabilities and owner equity $553,800 $741,500
Assets Liabilities
farm management
chapter 5
22
Balance Sheet Example
• Assets: most differences show up in
valuation of noncurrent assets
• Liabilities: Little difference in liabilities
sections, other than deferred taxes
• Owner equity: valuation adjustment on
market-basis balance sheet accounts for
change in assets’ worth over time because
of changes in market conditions for item
farm management
chapter 5
23
Balance Sheet Analysis
• Liquidity measures: current ratio, working
capital
• Solvency measures: debt/asset ratio,
equity/asset ratio, debt/equity ratio, net
capital ratio
• Other measure: debt structure ratio
farm management
chapter 5
24
Current Ratio
Current asset value
Current ratio =
Current liability value
$112,500
Current ratio = = 1.27 (market value)
$88,860
farm management
chapter 5
25
Working Capital
Working capital =
Current assets  current liability
Working capital = $112,500  $88,860 = $23,640
(market value)
farm management
chapter 5
26
Debt/Asset Ratio
Total liabilities
Debt/asset ratio =
Total assets
$368,860
Debt/asset ratio = = 0.50
$741,500
(market value)
farm management
chapter 5
27
Equity/Asset Ratio
Owner equity
Equity/asset ratio =
Total assets
$372,640
Equity/asset ratio = = 0.50
$741,500
(market value)
farm management
chapter 5
28
Debt/Equity Ratio
Total liabilities
Debt/equity ratio =
Owner equity
$368,860
Debt/equity ratio = = 0.99
$372,640
(market value)
farm management
chapter 5
29
Table 5-5
Summary of I.M. Farmer’s Financial Condition
Liquidity
Current ratio 1.27
Working capital $23,640
Solvency:
Debt/asset ratio 0.50
Equity/asset ratio 0.50
Debt/equity ratio 0.99
Measure Market Ratio
farm management
chapter 5
30
Net Capital Ratio
Total assets
Net capital ratio =
Total liabilities
$741,500
Net capital ratio = = 2.01
$368,860
(market value)
farm management
chapter 5
31
Debt Structure Ratio
Current liabilities
Debt structure ratio =
Total liabilities
$88,860
Debt structure ratio = = .24 or 24%
$368,860
(market value)
farm management
chapter 5
32
Statement of Owner Equity
The FFSC recommends that a statement of
owner equity be part of a complete set of
financial records. The statement shows the
sources of change in owner equity over
the accounting period.
farm management
chapter 5
33
Table 5-6
Statement of Owner Equity
Owner equity, January 1, 2003 $344,490
Net farm income for 2003 47,900
Less adjustment for income taxes paid and payable (8,150)
Net after-tax farm income 39,750
Less increase in current portion -- deferred income taxes (1,600)
Owner withdrawals from farm business (36,000)
Nonfarm income contributed to farm business 9,500
Net owner withdrawals from farm business (26,500)
Other capital contributions to farm business 0
Other capital distributions from farm business 0
Increase in market value of farm assets 22,500
Less increase in noncurrent portion of deferred income taxes (6,000)
Net increase in valuation equity 16,500
Owner equity, December 31, 2003 $372,640
farm management
chapter 5
34
Summary
A balance sheet shows the financial position
of a business at a point in time. An important
consideration is the method used to value
assets. Cost methods reflect the original
investment value. Market valuation reflects
current collateral values. The FFSC
recommends listing both cost and market
values for complete information.

Farm Management Balance sheet and its analyis.ppt

  • 1.
    Farm Management Chapter 5 TheBalance Sheet and Its Analysis
  • 2.
    farm management chapter 5 2 ChapterOutline • Purpose and Use of a Balance Sheet • Balance Sheet Format • Asset Valuation and Related Problems • Balance Sheet Example • Balance Sheet Analysis • Statement of Owner Equity
  • 3.
    farm management chapter 5 3 ChapterObjectives 1. To discuss the purpose of a balance sheet 2. To illustrate the format and structure of a balance sheet 3. To outline some problems when valuing assets, and the recommended valuation methods for different types of assets 4. To show the difference between a cost and market basis 5. To define owner equity or net worth and show its importance 6. To analyze solvency and liquidity 7. To introduce and explain statement of owner equity
  • 4.
    farm management chapter 5 4 Purposeand Use of a Balance Sheet • Systematic organization of everything “owned” and “owed” • Assets = liabilities + owner equity • Owner equity = assets  liabilities • Can complete at any time, but most prepared at end of accounting period • Provides measures of solvency and liquidity
  • 5.
    farm management chapter 5 5 Solvency Solvencymeasures the liabilities of the business relative to the amount of owner equity invested in the business. It provides an indication of the ability to pay off all financial obligations or liabilities if all assets were sold. If assets are not greater than liabilities, the business is insolvent.
  • 6.
    farm management chapter 5 6 Liquidity Liquiditymeasures the ability of the business to meet financial obligations as they come due without disrupting the normal operations of the business. Liquidity measures the ability to generate cash needed to pay obligations. Liquidity is generally measured over the next accounting period and is a short-run concept.
  • 7.
    farm management chapter 5 7 BalanceSheet Format • Assets shown on left or top • Liabilities are shown on right or below assets • Owner equity shown on balance sheet and liabilities + owner equity = assets
  • 8.
    farm management chapter 5 8 Table5-1 General Format of a Balance Sheet $100 $60 400 200 $260 240 $500 $500 Assets Liabilities Noncurrent Assets Current Assets Current Liabilities Noncurrent Liabilities Total Assets Total Liabilities Owner's Equity Total Liabilities and Owner's Equity
  • 9.
    farm management chapter 5 9 Assets Anasset has value for one of two reasons: 1) It can be sold to generate cash, or 2) It can be used to produce other goods that in turn can be sold for cash in the future.
  • 10.
    farm management chapter 5 10 CurrentAssets Assets that can be sold easily to generate cash are called liquid assets. Accounting principles require current assets, which are the more liquid assets, to be separated from other assets on the balance sheet. Current assets include: cash, marketable stocks and bonds, accounts receivable, and inventories of feed, grain, supplies and feeder livestock.
  • 11.
    farm management chapter 5 11 NoncurrentAssets Assets that are not current assets are classified as noncurrent assets. They are more difficult to sell and/or their sale would be more likely to disrupt the business. Noncurrent assets include: machinery, equipment, breeding livestock, buildings, and land.
  • 12.
    farm management chapter 5 12 Liabilities Aliability is an obligation or debt owed to someone else. It represents an outsider’s claim on the business.
  • 13.
    farm management chapter 5 13 CurrentLiabilities Accounting principles require that current liabilities be separated from other liabilities on the balance sheet. Current liabilities are financial obligations that will become due and payable within one year from the date on the balance sheet. Examples: accounts payable, principal and accrued interest on short-term loans, and principal due within one year on longer term loans.
  • 14.
    farm management chapter 5 14 NoncurrentLiabilities Any liability that is not current is classified as a noncurrent liability. These financial obligations will become due and payable some time after one year from the date on the balance sheet.
  • 15.
    farm management chapter 5 15 OwnerEquity If all assets were to be sold and all debts paid on the date of the balance sheet, the owner’s equity would be the amount left over. Owner equity changes when: 1) the business has a profit or loss, 2) the owner invests more capital from outside the business or withdraws money from the business, or 3) assets change value. Owner equity does not change when cash is used to buy other assets or a loan is taken out to purchase an asset with value equal to the loan.
  • 16.
    farm management chapter 5 16 AlternativeFormat • Current assets and liabilities are defined in the same way as previously • Intermediate assets are expected to have a life of 1 to 10 years and intermediate liabilities are due and payable after 1 year but before 10 years • Fixed assets have a useful life of more than 10 years and long-term liabilities are due after 10 years
  • 17.
    farm management chapter 5 17 Table5-2 Format of a Three-Category Balance Sheet $100 $60 120 75 280 125 $260 240 $500 $500 Total Assets Intermediate Assets Intermediate Liabilities Total Liabilities Owner's Equity Total Liabilities and Owner's Equity Fixed Assets Current Assets Current Liabilities Long-term Liabilities Assets Liabilities
  • 18.
    farm management chapter 5 18 AssetValuation and Related Problems A cost-basis balance sheet has all assets valued following the cost, cost less depreciation, or farm production cost methods. The one exception would be inventories of grain and market livestock. A market-basis balance sheet has all assets valued at market value less estimated selling costs.
  • 19.
    farm management chapter 5 19 Whichis best? Cost-basis balance sheets conform to general accounting standards and are thus comparable to balance sheets from other types of businesses. Market-basis balance sheets more accurately reflect the actual financial position. FFSC says both types of balance sheets are needed for proper business analysis.
  • 20.
    farm management chapter 5 20 Table5-3 Valuation Methods for Cost-Basis and Market-Basis Balance Sheets Cost Market Basis Basis Marketable securities Cost Market Inventories of grain and market livestock Market* Market Accounts receivable Cost Cost Prepaid expenses Cost Cost Investment in growing crops Cost Cost Purchased breeding livestock Cost Market Raised breeding livestock Cost or a Market base value Machinery and Equipment Cost Market Buildings and Improvements Cost Market Land Cost Market market livestock Lower of cost or market is preferred for purchased grain and Asset *Market is acceptable for raised grain and market livestock
  • 21.
    Table 5-4 BalanceSheet for I.M. Farmer, December 31, 20XX Currrent Assets: Cost Market Current Liabilities Cost Market Cash/checking acct. $5,000 $5,000 Account Payable 6,000 6,000 Marketable securities 1,000 2,200 Notes payable within 1 year 15,000 15,000 Inventories Current portion of term debt 28,000 28,000 Crops 40,000 40,000 Accured Interest 15,700 15,700 Livestock 52,000 52,000 Income taxes payable 8,000 8,000 Supplies 4,000 4,000 Current portion - deferred taxes 15,020 15,260 Accounts receivable 1,200 1,200 Other accrued expenses 900 900 Prepaid expenses 500 500 Total Current Liabilities $88,620 $88,860 Investment in growing crops 7,600 7,600 Other current assets 0 0 Noncurrent Liabiltiies Cost Market Total Current Assets $111,300 $112,500 Notes payable Machinery 20,000 20,000 Noncurrent Assets: Cost Market Breeding Livestock 40,000 40,000 Real estate debt 175,000 175,000 Machines and equipment 67,500 95,000 Noncurrent portion - deferred taxes ------ 45,000 Breeding livestock (purch.) 48,000 60,000 Total Noncurrent Liabilities $235,000 $280,000 Breeding livestock (raised) 12,000 24,000 Total Liabilities $323,620 $368,860 Buildings and improvments 27,000 50,000 Land 288,000 400,000 Owner Equity Other noncurrent assets 0 0 Total Noncurrent Assets $442,500 $629,000 Contributed capital 50,000 50,000 Total Assets $553,800 $741,500 Retained earnings 180,180 180,180 Valuation adjustment ------- 142,460 Total Equity $230,180 $372,640 Total liabilities and owner equity $553,800 $741,500 Assets Liabilities
  • 22.
    farm management chapter 5 22 BalanceSheet Example • Assets: most differences show up in valuation of noncurrent assets • Liabilities: Little difference in liabilities sections, other than deferred taxes • Owner equity: valuation adjustment on market-basis balance sheet accounts for change in assets’ worth over time because of changes in market conditions for item
  • 23.
    farm management chapter 5 23 BalanceSheet Analysis • Liquidity measures: current ratio, working capital • Solvency measures: debt/asset ratio, equity/asset ratio, debt/equity ratio, net capital ratio • Other measure: debt structure ratio
  • 24.
    farm management chapter 5 24 CurrentRatio Current asset value Current ratio = Current liability value $112,500 Current ratio = = 1.27 (market value) $88,860
  • 25.
    farm management chapter 5 25 WorkingCapital Working capital = Current assets  current liability Working capital = $112,500  $88,860 = $23,640 (market value)
  • 26.
    farm management chapter 5 26 Debt/AssetRatio Total liabilities Debt/asset ratio = Total assets $368,860 Debt/asset ratio = = 0.50 $741,500 (market value)
  • 27.
    farm management chapter 5 27 Equity/AssetRatio Owner equity Equity/asset ratio = Total assets $372,640 Equity/asset ratio = = 0.50 $741,500 (market value)
  • 28.
    farm management chapter 5 28 Debt/EquityRatio Total liabilities Debt/equity ratio = Owner equity $368,860 Debt/equity ratio = = 0.99 $372,640 (market value)
  • 29.
    farm management chapter 5 29 Table5-5 Summary of I.M. Farmer’s Financial Condition Liquidity Current ratio 1.27 Working capital $23,640 Solvency: Debt/asset ratio 0.50 Equity/asset ratio 0.50 Debt/equity ratio 0.99 Measure Market Ratio
  • 30.
    farm management chapter 5 30 NetCapital Ratio Total assets Net capital ratio = Total liabilities $741,500 Net capital ratio = = 2.01 $368,860 (market value)
  • 31.
    farm management chapter 5 31 DebtStructure Ratio Current liabilities Debt structure ratio = Total liabilities $88,860 Debt structure ratio = = .24 or 24% $368,860 (market value)
  • 32.
    farm management chapter 5 32 Statementof Owner Equity The FFSC recommends that a statement of owner equity be part of a complete set of financial records. The statement shows the sources of change in owner equity over the accounting period.
  • 33.
    farm management chapter 5 33 Table5-6 Statement of Owner Equity Owner equity, January 1, 2003 $344,490 Net farm income for 2003 47,900 Less adjustment for income taxes paid and payable (8,150) Net after-tax farm income 39,750 Less increase in current portion -- deferred income taxes (1,600) Owner withdrawals from farm business (36,000) Nonfarm income contributed to farm business 9,500 Net owner withdrawals from farm business (26,500) Other capital contributions to farm business 0 Other capital distributions from farm business 0 Increase in market value of farm assets 22,500 Less increase in noncurrent portion of deferred income taxes (6,000) Net increase in valuation equity 16,500 Owner equity, December 31, 2003 $372,640
  • 34.
    farm management chapter 5 34 Summary Abalance sheet shows the financial position of a business at a point in time. An important consideration is the method used to value assets. Cost methods reflect the original investment value. Market valuation reflects current collateral values. The FFSC recommends listing both cost and market values for complete information.