This document provides information to help students study for the ACCA F9 Financial Management exam. It outlines what the exam covers, the skills required, and how to improve exam chances. The F9 exam tests knowledge of investment, financing and dividend policy decisions. Students must be able to perform calculations, interpret data, explain techniques, and apply skills to practical contexts. Practicing varied questions under timed conditions is emphasized as essential exam preparation. Answering Section C questions requires focused, organization-specific responses based on provided scenarios.


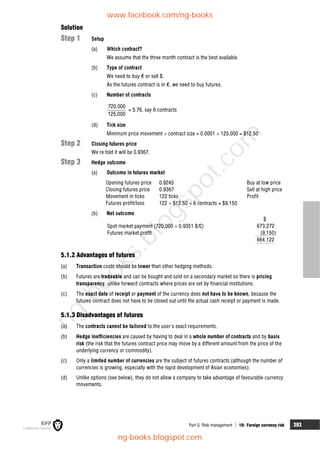
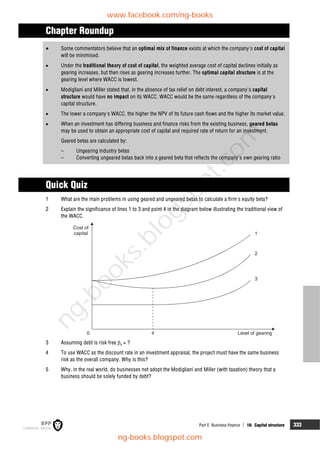
![176 8: Investment appraisal using DCF methods Part D Investment appraisal
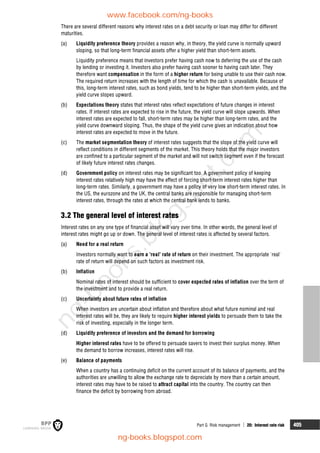
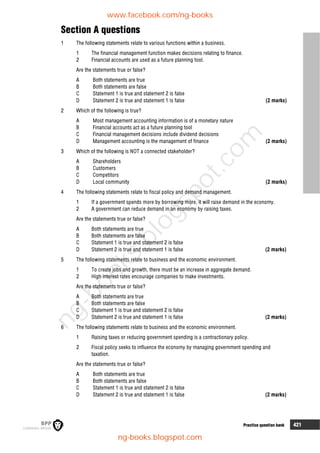
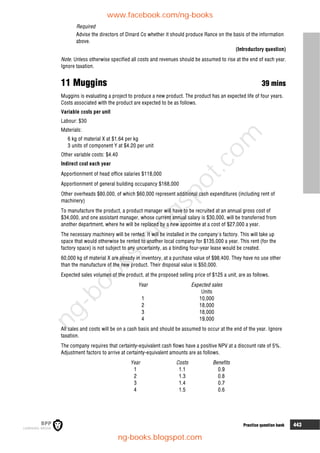
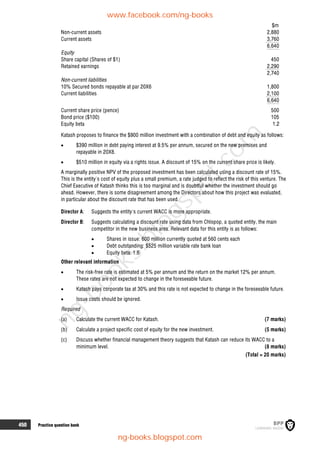
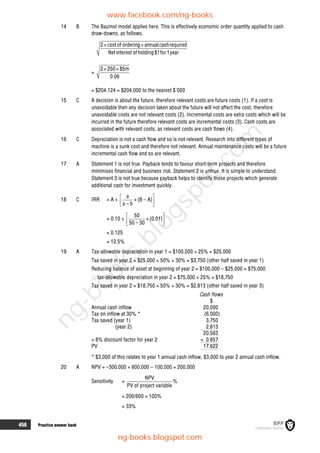
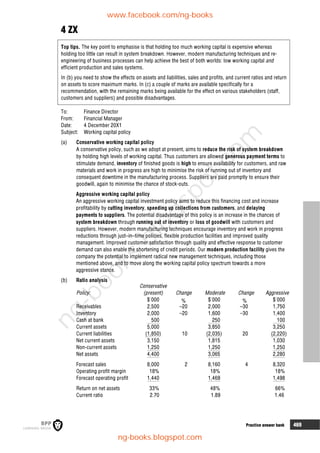
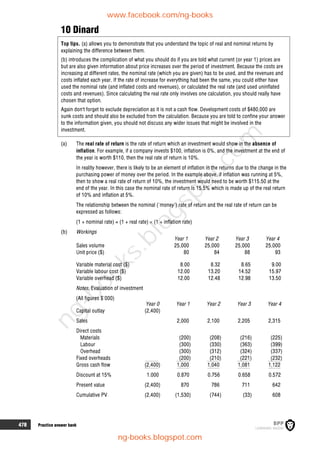
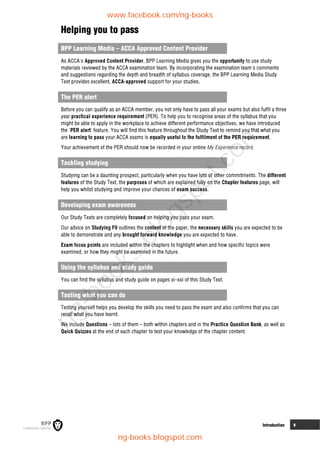
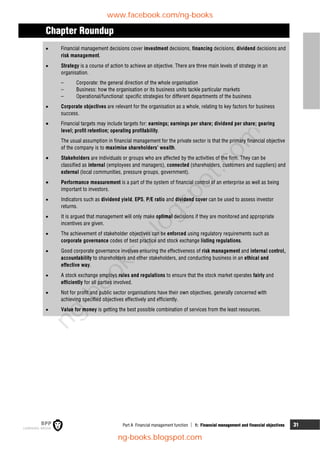
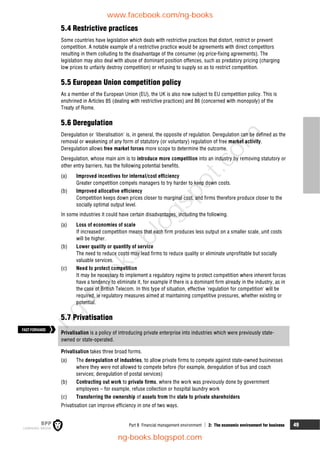
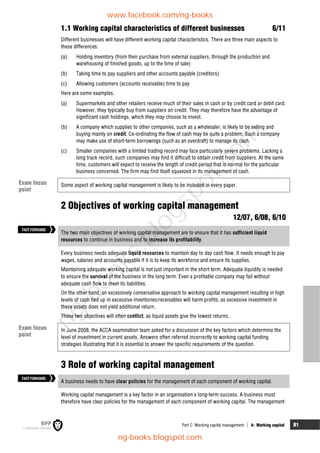
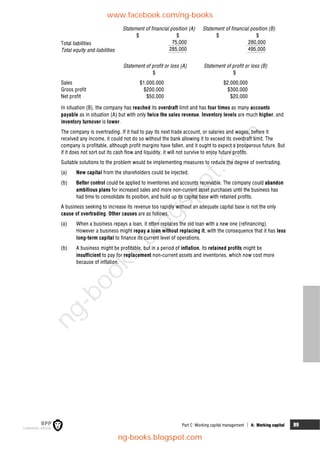
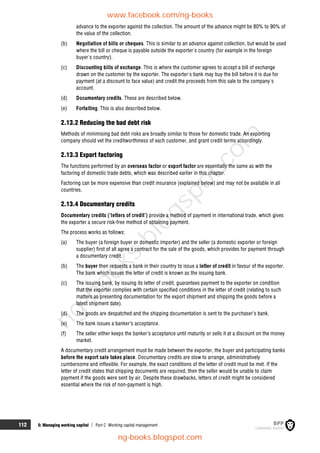
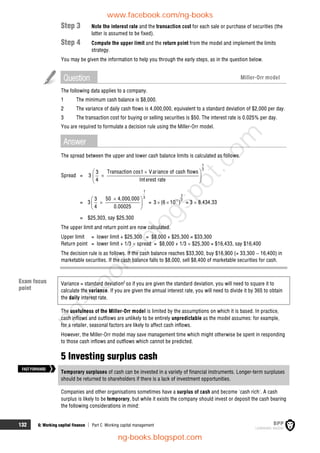
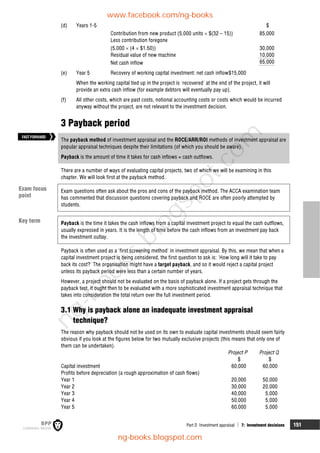
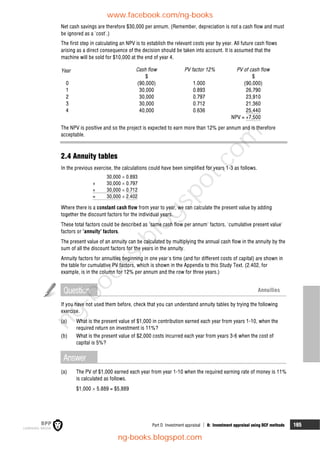
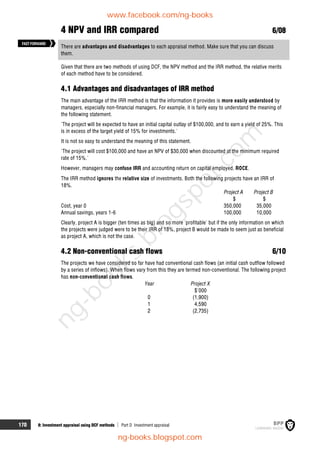
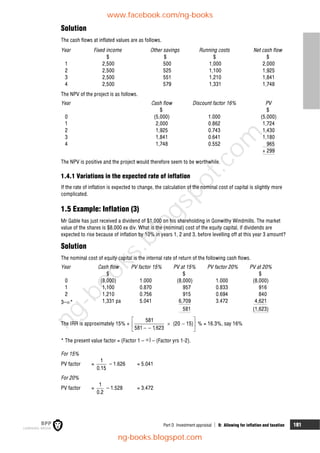
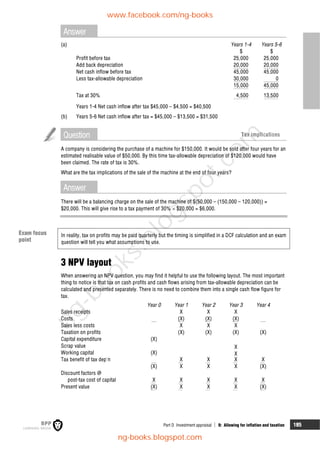
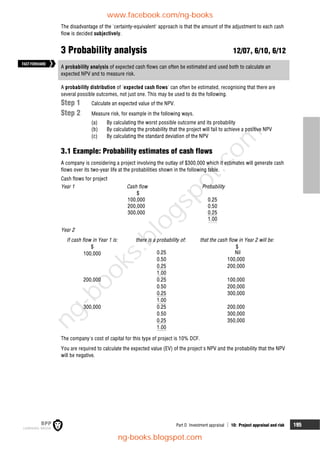
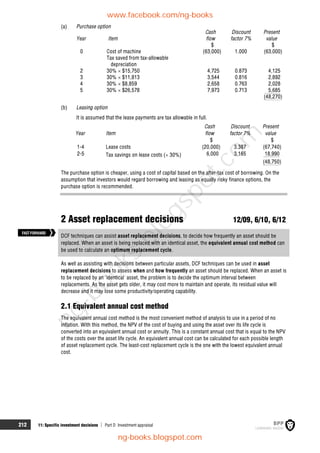
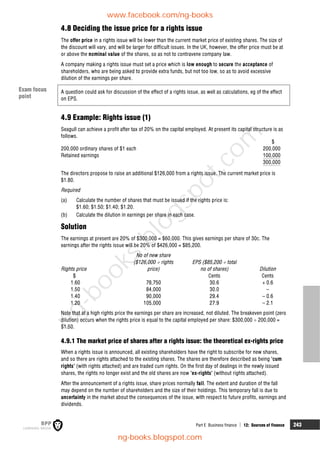
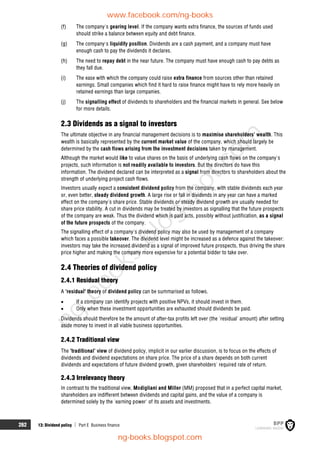
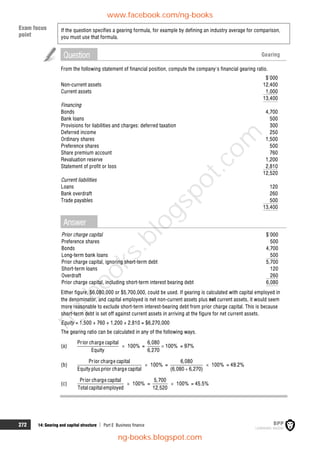
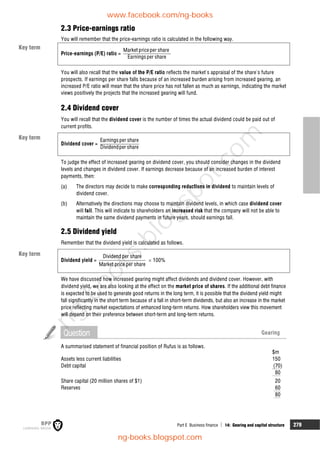
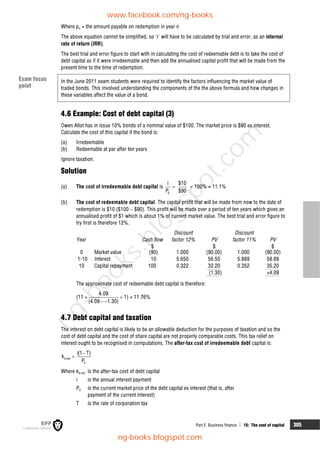
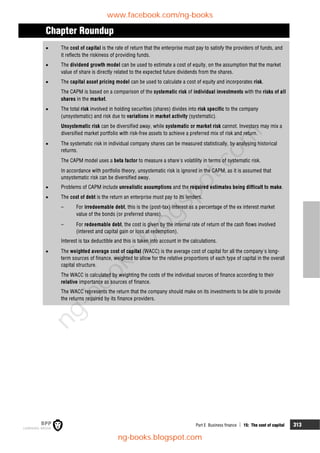
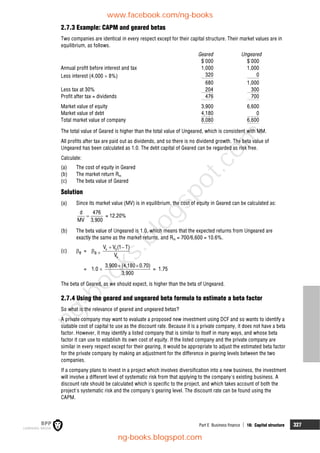
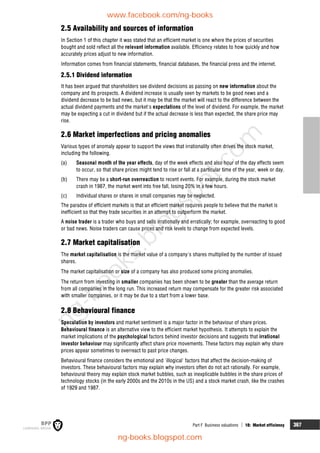
Answers to Quick Quiz
1 FV = PV (1 + r)n
2 PV = FV n
r)
(1
1
3 (a) A cash outlay to be incurred at the beginning of an investment project occurs in year 0.
(b) A cash outlay, saving or inflow which occurs during the course of a time period is assumed to
occur all at once at the end of the time period.
(c) A cash outlay or receipt that occurs at the beginning of a time period is taken to occur at the end of
the time period.
4 Annual cash flow/discount rate
5 (a) It takes account of the time value of money.
(b) It uses all cash flows relating to a project.
(c) It allows for the timing of cash flows.
6 D 15% + {(3,670/[3,670 + 1,390]) 3%} = 17.2%
7 (a) Included
(b) Not included (non-cash)
(c) Not included (past cost)
(d) Not included (included in the discount rate)
Now try the questions below from the Practice Question Bank
Number Level Marks Approximate time
Section A Q18 Examination 2 4 mins
Section C Q6 Introductory N/A 39 mins
Section C Q7 Examination 20 39 mins
Section C Q8 Introductory N/A 39 mins
www.facebook.com/ng-books
ng-books.blogspot.com
n
g
-
b
o
o
k
s
.
b
l
o
g
s
p
o
t
.
c
o
m](https://image.slidesharecdn.com/f9financialmanagement-studytext2016-2017-220618221639-e43e6ffa/85/F9-Financial-Management-Study-Text-2016-2017-pdf-201-320.jpg)


![Part D Investment appraisal 10: Project appraisal and risk 199
A computer would calculate the NPV many times over using the values established in this way with more
random numbers, and the results would be analysed to provide the following.
(a) An expected NPV for the project
(b) A statistical distribution pattern for the possible variation in the NPV above or below this average
The decision whether to go ahead with the project would then be made on the basis of expected return
and risk.
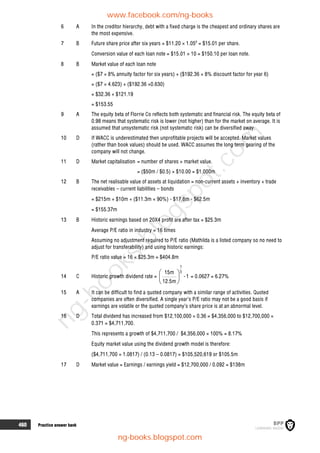
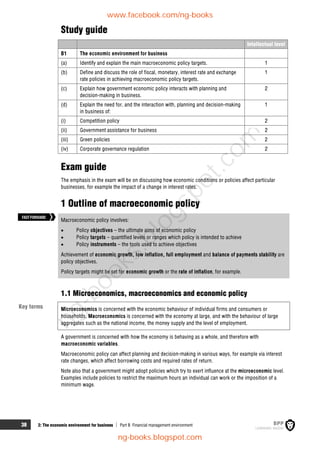
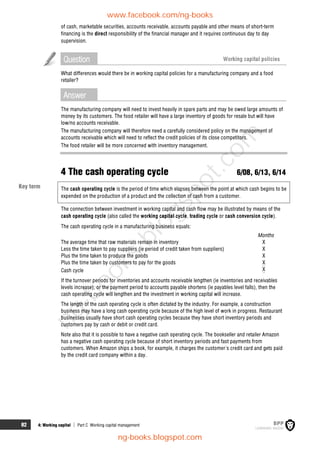
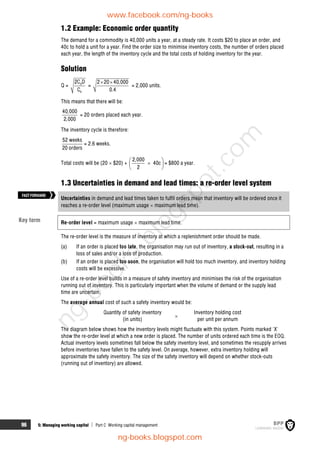
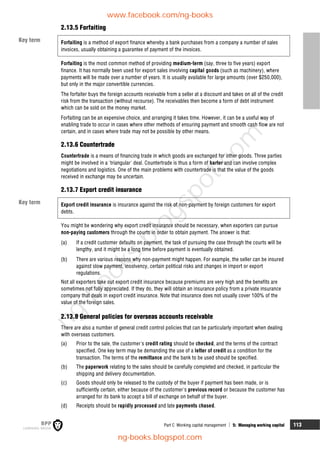
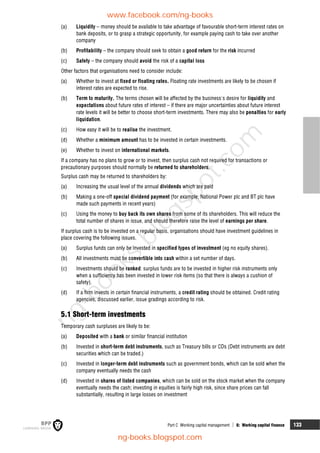
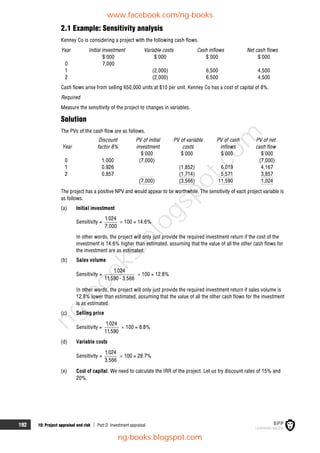
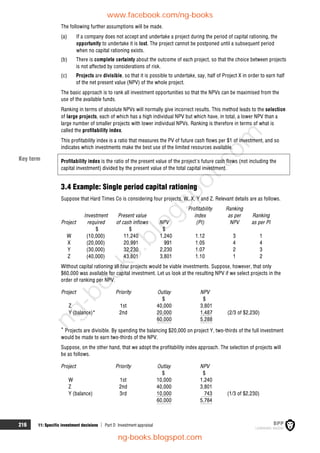
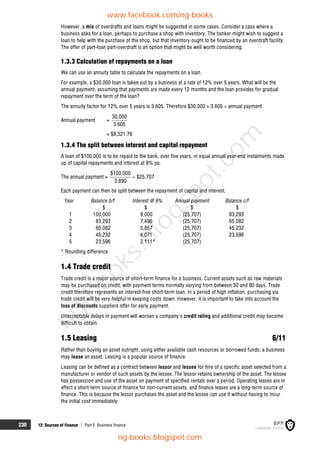
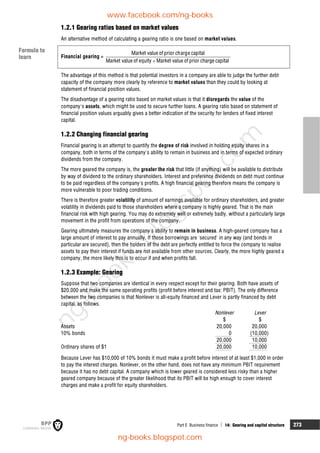
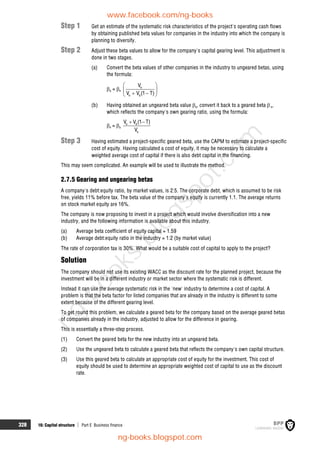
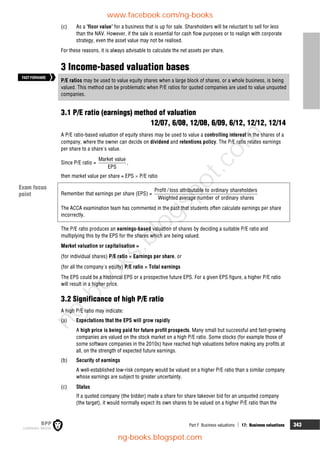
4.3 Discounted payback (adjusted payback)
The discounted payback period (DPP) is the time it will take before a project's cumulative NPV turns from
being negative to being positive.
The payback method of investment appraisal, discussed in Chapter 7, recognises uncertainty in
investment decisions by focusing on the near future. Short-term projects are preferred to long-term
projects and liquidity is emphasised.
The discounted payback period is the length of time before the cumulative PV of cash inflows from the
projects begins to exceed the initial outflow. It is similar to the payback method, but uses discounted cash
flows rather than non-discounted cash flows to measure the payback period.
Discounted payback uses discounted cash flows. This is also known as adjusted payback.
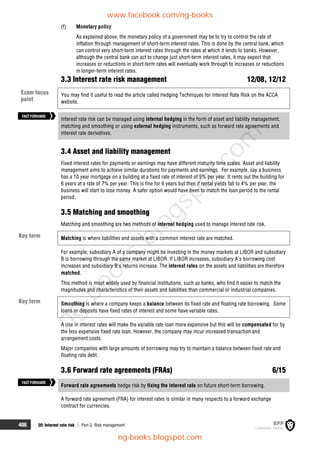
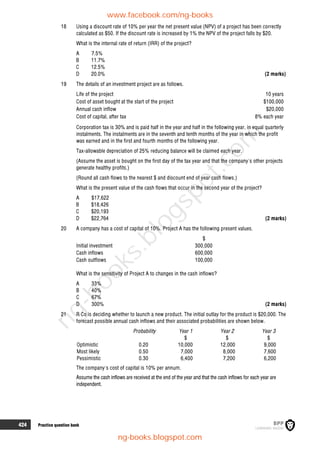
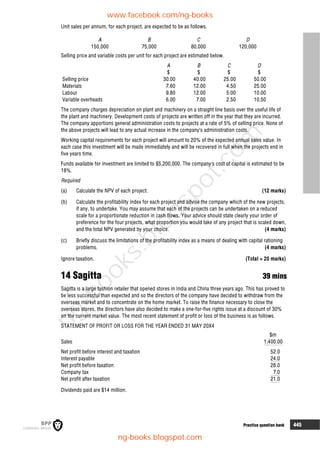
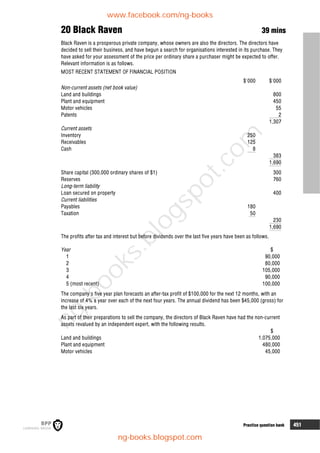
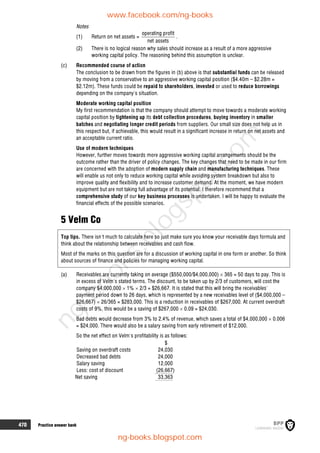
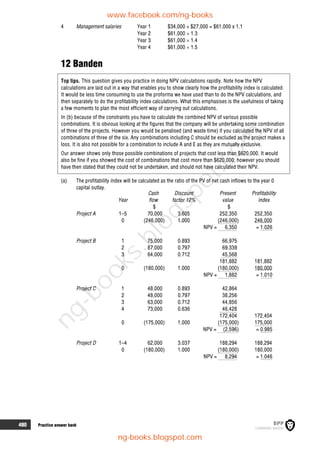
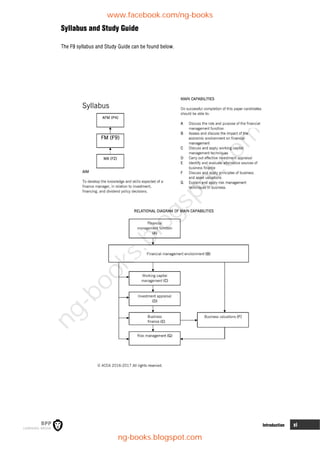
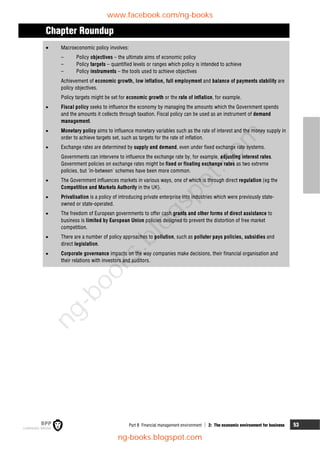
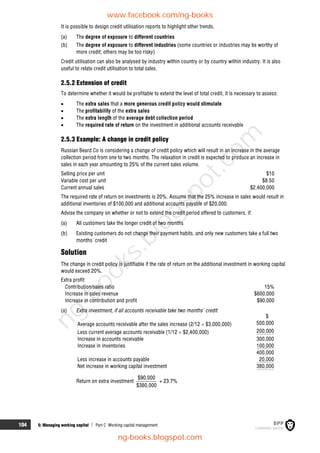
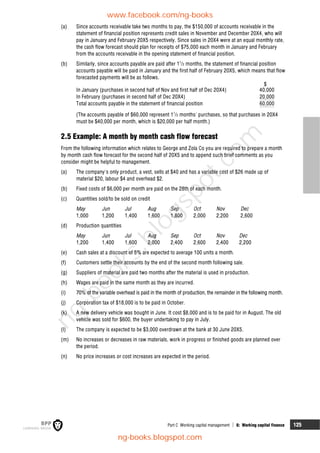
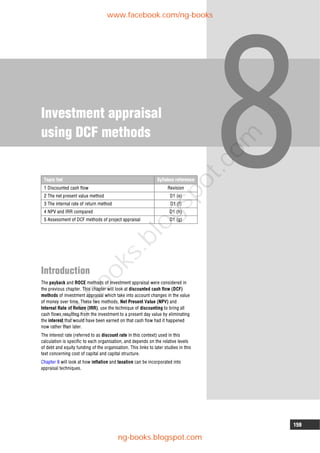
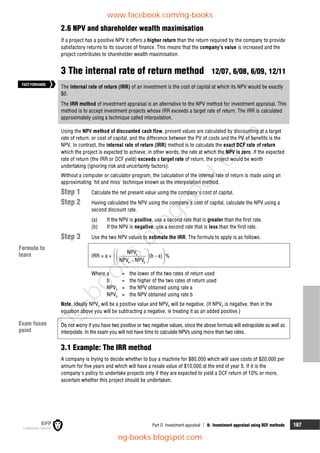
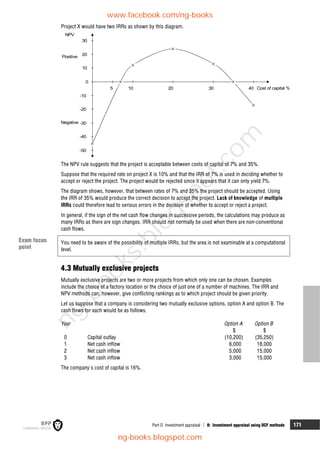
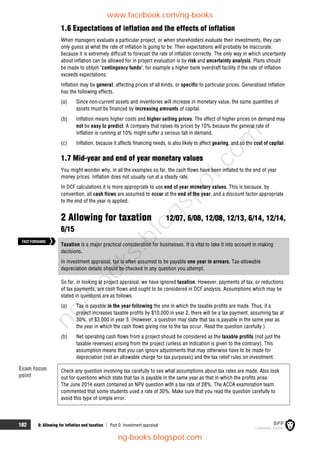
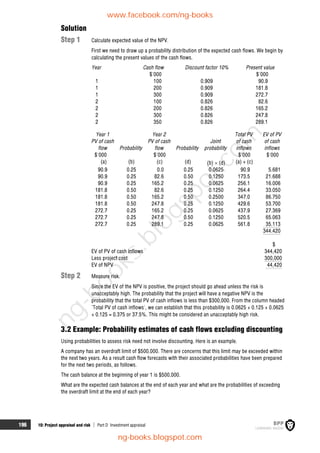
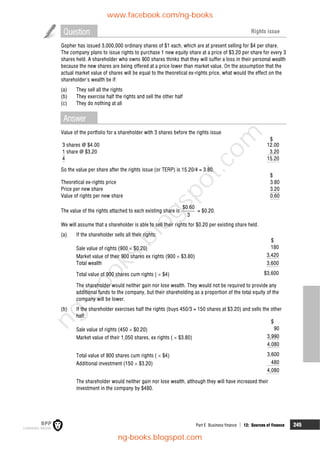
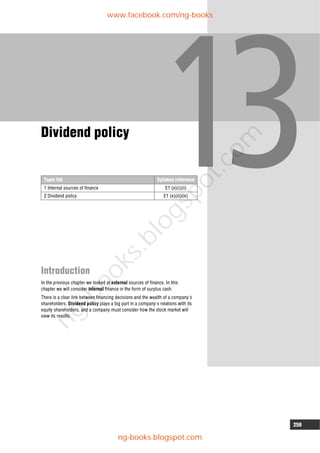
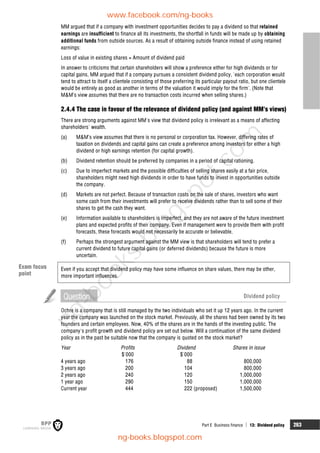
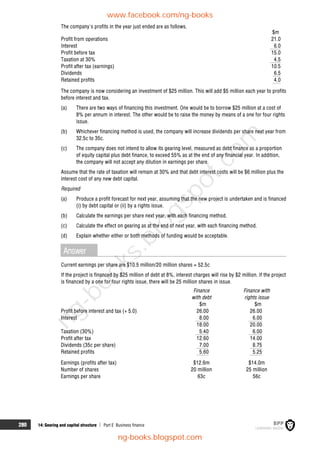
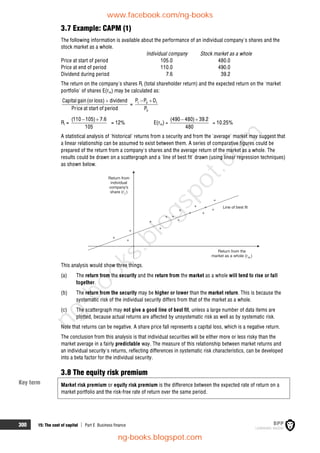
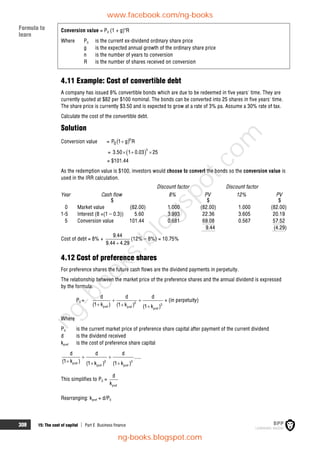
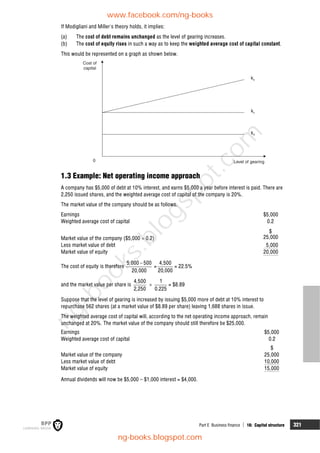
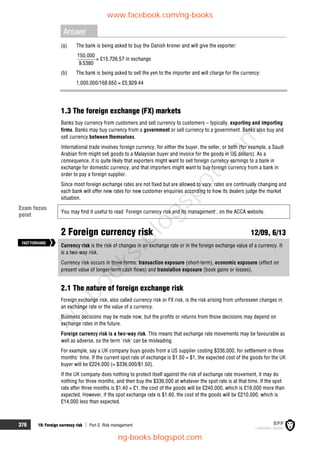
For example, if we have a cost of capital of 10% and a project with the cash flows shown below, we can
calculate a discounted payback period.
Discount Present Cumulative
Year Cash flow factor value NPV
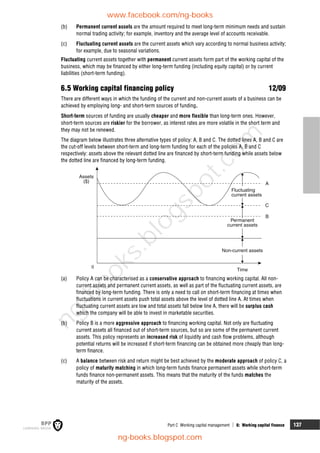
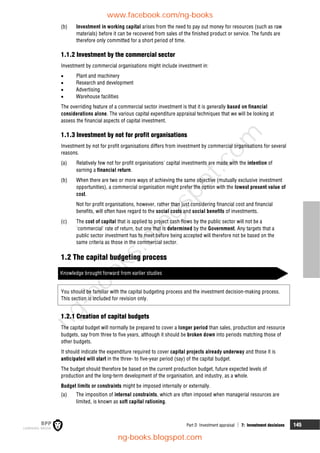
$ 10% $ $
0 (100,000) 1.000 (100,000) (100,000)
1 30,000 0.909 27,270 (72,730)
2 50,000 0.826 41,300 (31,430)
3 40,000 0.751 30,040 (1,390)
4 30,000 0.683 20,490 19,100
5 20,000 0.621 12,420 31,520
NPV = 31,520
The DPP is early in year 4.
It may be approximated as 3 years + [1,390/(1,390 + 19,100)] × 12 months
= 3 years 0.8 months, say 3 years 1 month.
A company can set a target DPP, and choose not to undertake any projects with a DPP in excess of a
certain number of years, say, five years.
4.4 Advantages and disadvantages of discounted payback period
The approach has all the perceived advantages of the payback period method of investment appraisal: it
is easy to understand and calculate, and it provides a focus on liquidity where this is relevant. In addition,
however, it also takes into account the time value of money. It therefore bridges the gap between the
theoretically superior NPV method and the regular payback period method.
However, it does differ from NPV in that the discount rate used is the unadjusted cost of capital whereas
NPV often uses an adjusted rate to reflect project risk and uncertainty.
Because the DPP approach takes the time value of money into consideration, it produces a longer
payback period than the non-discounted payback approach, and takes into account more of the project's
cash flows.
FASTFORWARD
www.facebook.com/ng-books
ng-books.blogspot.com
n
g
-
b
o
o
k
s
.
b
l
o
g
s
p
o
t
.
c
o
m](https://image.slidesharecdn.com/f9financialmanagement-studytext2016-2017-220618221639-e43e6ffa/85/F9-Financial-Management-Study-Text-2016-2017-pdf-224-320.jpg)


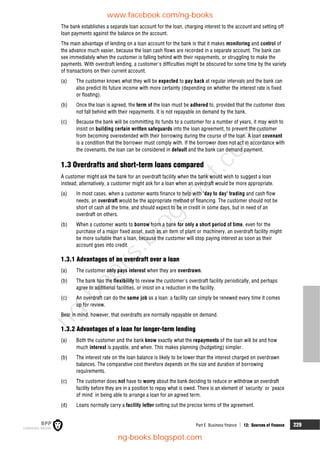


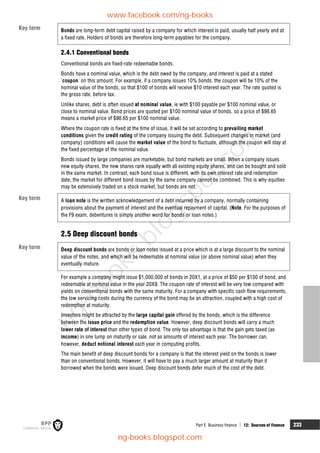


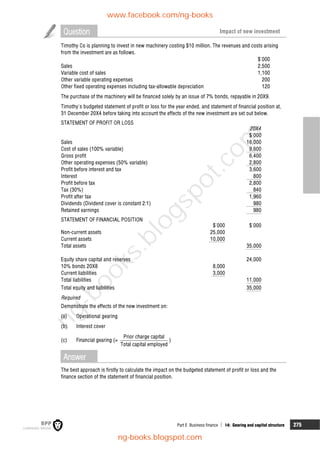


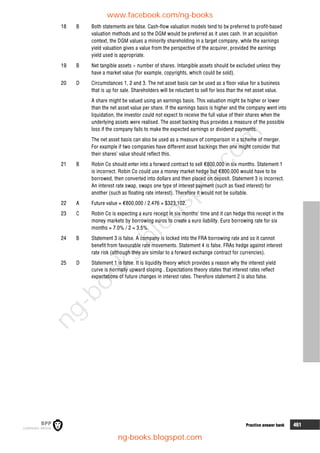
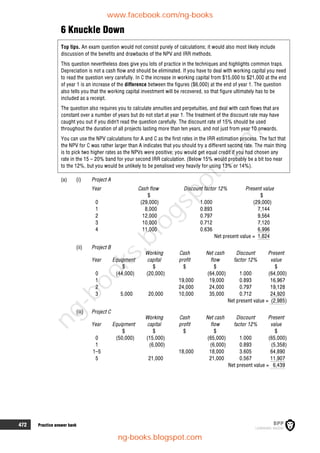
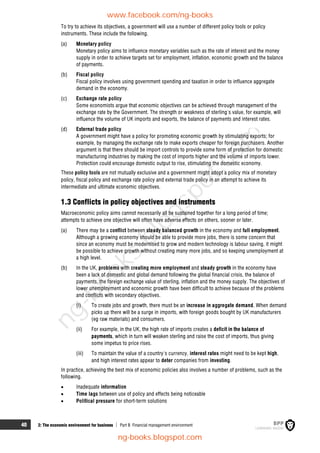
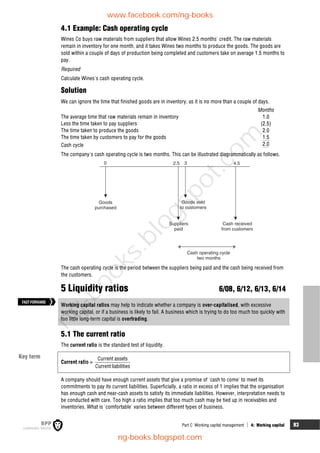
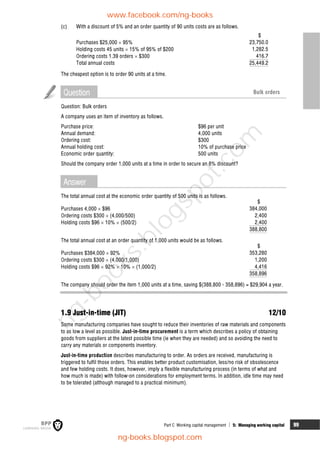
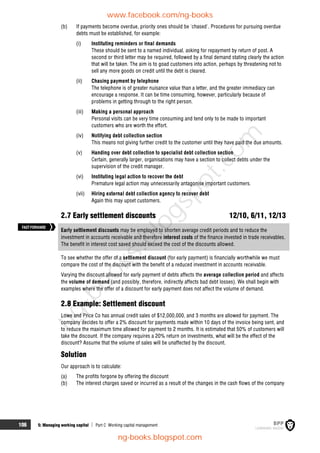
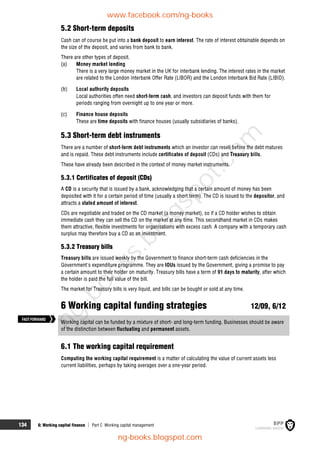
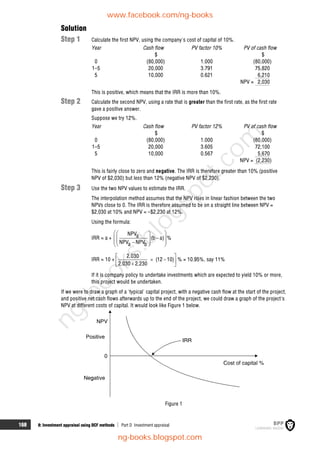
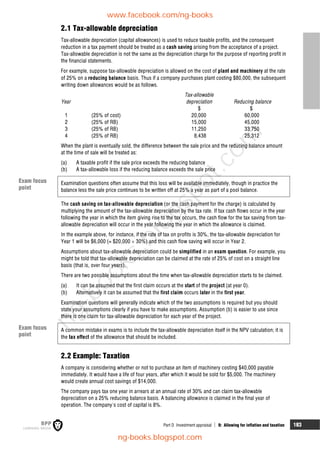
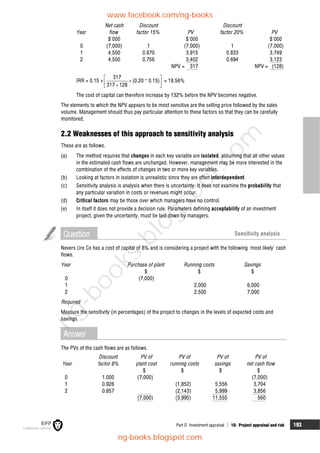
![Part E Business finance 16: Capital structure 329
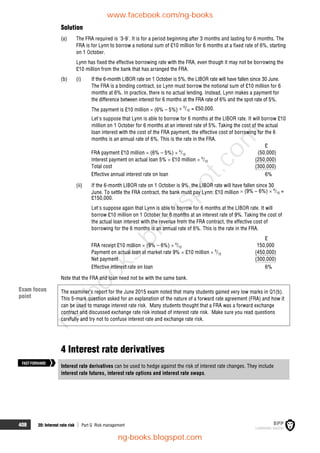
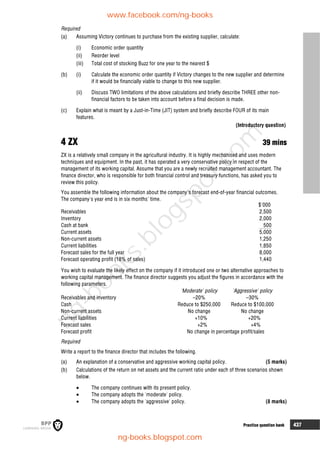
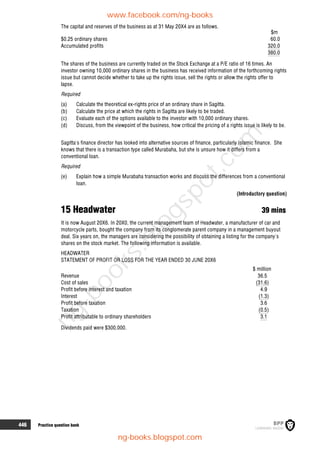
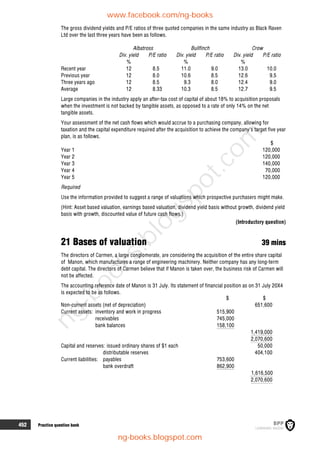
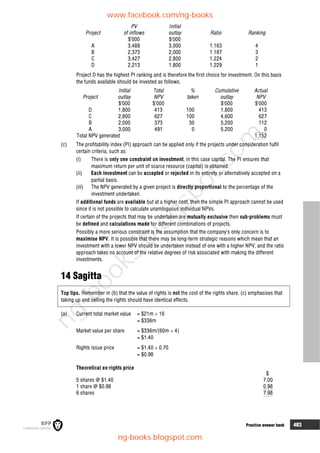
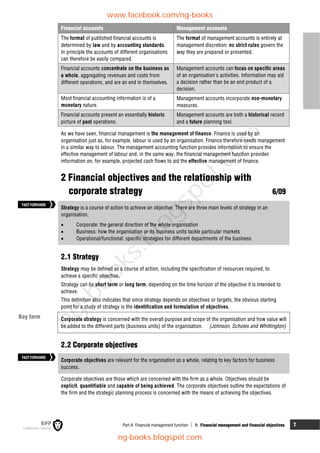
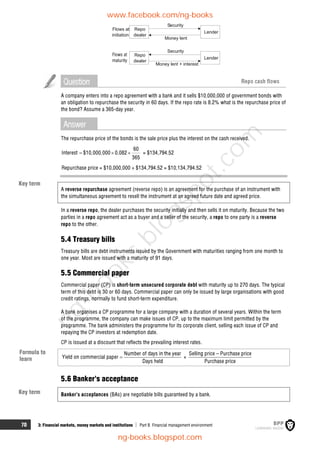
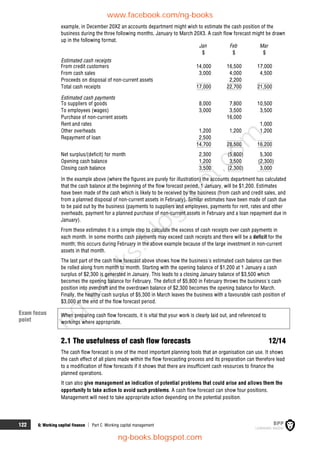
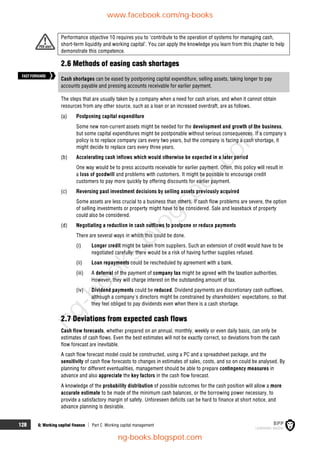
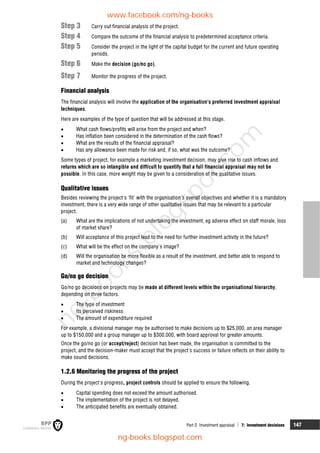
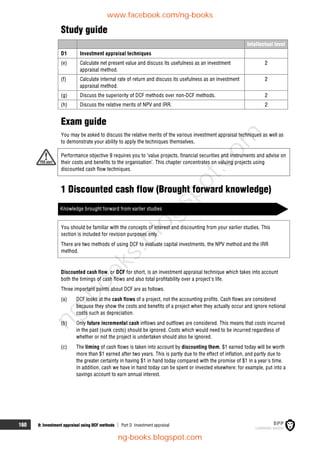
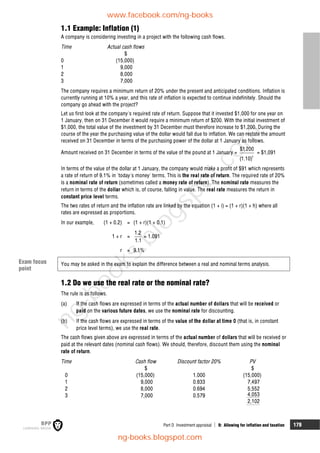
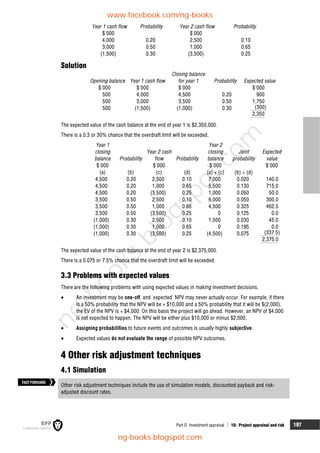
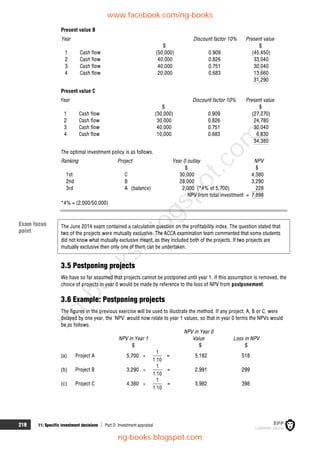
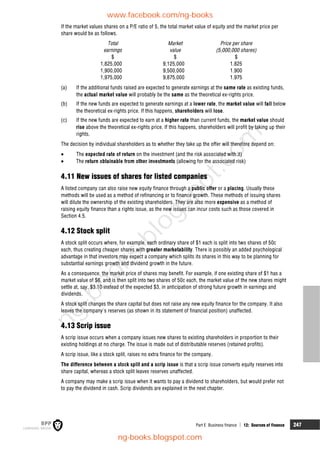
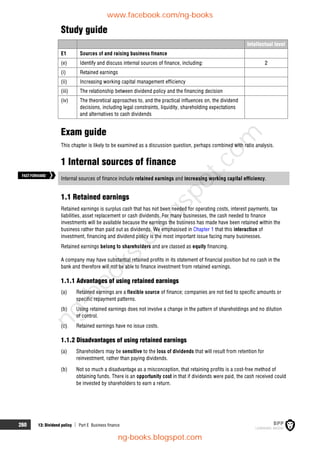
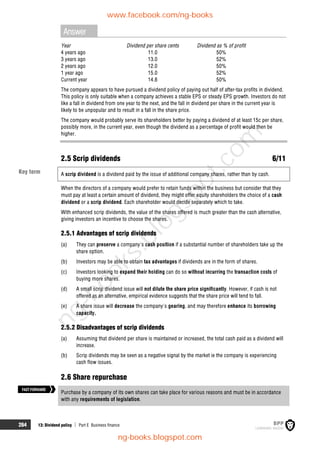
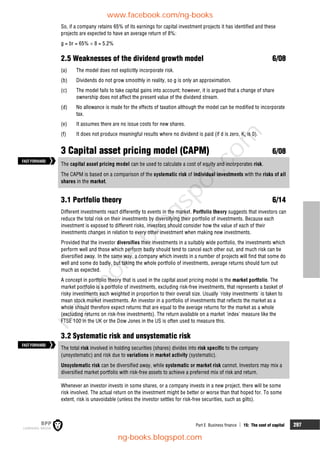
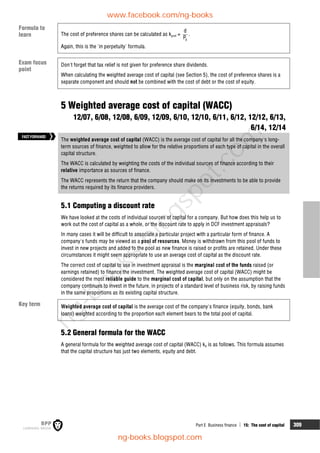
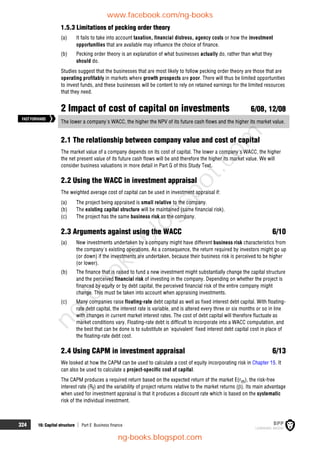
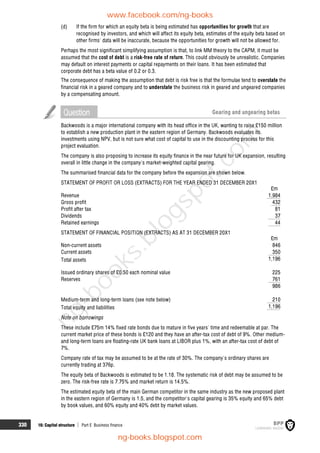
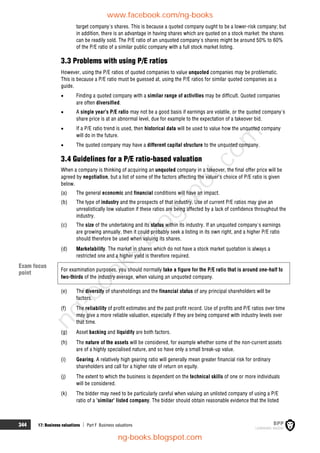
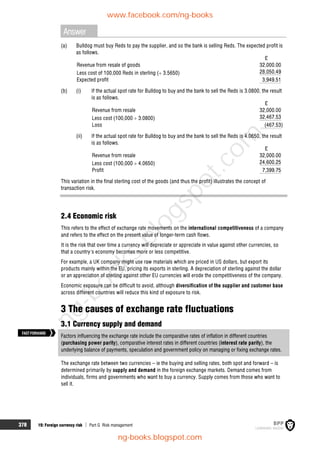
The beta value for the industry is 1.59.
Step 1 Convert the geared beta value for the industry to an ungeared beta (asset beta) for the
industry.
a = 1.59
2
2 (1(1 0.30))
= 1.18
Step 2 Convert this ungeared industry beta back into a geared beta, which reflects the company's
own gearing level of 2:5.
e = 1.18
5 (2(1 0.30))
5
= 1.51
Step 3 (a) This is a project-specific beta for the firm's equity capital and so, using the CAPM,
we can estimate the project-specific cost of equity as:
keg = 11% + (16% – 11%) 1.51 = 18.55%
(b) The project will presumably be financed in a gearing ratio of 2:5 debt to equity, and
so the project-specific cost of capital ought to be:
[5/7 18.55%] + [2/7 70% 11%] = 15.45%
Question Ungeared and geared betas
Two companies are identical in every respect except for their capital structure. XY has a debt:equity ratio
of 1:3, and its equity has a value of 1.20. PQ has a debt:equity ratio of 2:3. Corporation tax is at 30%.
Estimate a value for PQ's equity.
Answer
Estimate an ungeared beta from XY data.
a = 1.20
3
3 (1(1 0.30))
= 0.973
Estimate a geared beta for PQ using this ungeared beta.
e = 0.973
3 (2(1– 0.30))
3
= 1.427
2.7.6 Weaknesses in the formula
The problems with using the geared and ungeared beta formula for calculating a firm's equity beta from
data about other firms are as follows.
(a) It is difficult to identify other firms with identical operating characteristics.
(b) Estimates of beta values from share price information are not wholly accurate. They are based
on statistical analysis of historical data and, as the previous example shows, estimates using one
firm's data will differ from estimates using another firm's data.
(c) There may be differences in beta values between firms caused by:
(i) Different cost structures (eg the ratio of fixed costs to variable costs)
(ii) Size differences between firms
(iii) Debt capital not being risk free
www.facebook.com/ng-books
ng-books.blogspot.com
n
g
-
b
o
o
k
s
.
b
l
o
g
s
p
o
t
.
c
o
m](https://image.slidesharecdn.com/f9financialmanagement-studytext2016-2017-220618221639-e43e6ffa/85/F9-Financial-Management-Study-Text-2016-2017-pdf-354-320.jpg)


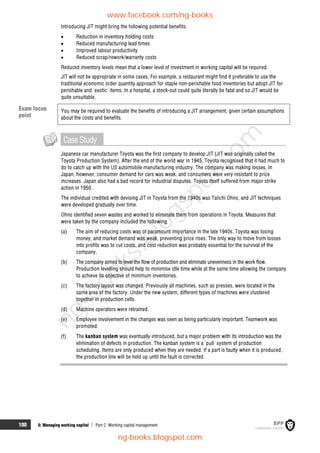
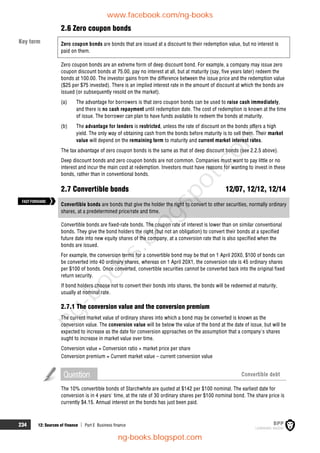
![382 19: Foreign currency risk Part G Risk management
For example, in July 2015, the price of a Big Mac in America was $4.79. At market exchange rates, the
price of a Big Mac in China was $2.74. So the Big Mac index suggests that the yuan was undervalued by
43% at the time.
3.5 The Fisher effect
The term Fisher effect is sometimes used in looking at the relationship between interest rates and
expected rates of inflation (see Chapter 9, Section 1).
The rate of interest is seen as being made up of two parts: the real required rate of return (real interest
rate) plus a premium for inflation. Then:
[1 + nominal (money) rate] = [1 + real interest rate] [1 + inflation rate]
(1 + i) = (1 + r)(1 + h)
Countries with relatively high rates of inflation will generally have high nominal rates of interest, partly
because high interest rates are a mechanism for reducing inflation, and partly because of the Fisher effect:
higher nominal interest rates serve to allow investors to obtain a high enough real rate of return where
inflation is relatively high.
According to the international Fisher effect, nominal interest rate differentials between countries provide
an unbiased predictor of future changes in spot exchange rates. The currency of countries with relatively
high interest rates is expected to depreciate against currencies with lower interest rates, because the
higher interest rates are considered necessary to compensate for the anticipated currency depreciation.
Given free movement of capital internationally, this idea suggests that the real rate of return in different
countries will equalise as a result of adjustments to spot exchange rates.
The international Fisher effect can be expressed as:
a a
b b
1 i 1 h
1 i 1 h
Where ia is the nominal interest rate in country a
ib is the nominal interest rate in country b
ha is the inflation rate in country a
hb is the inflation rate in country b
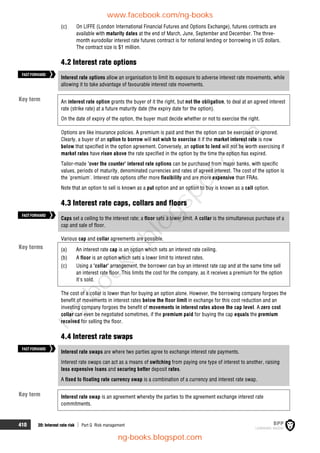
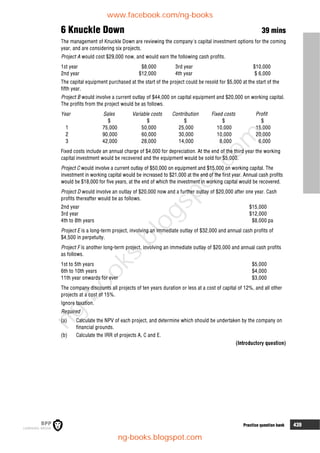
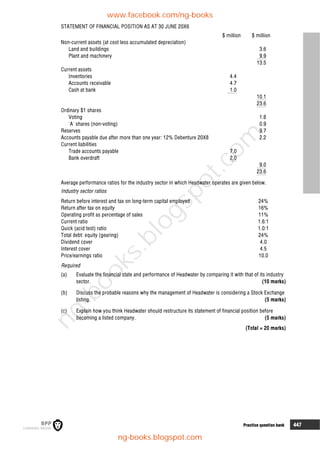
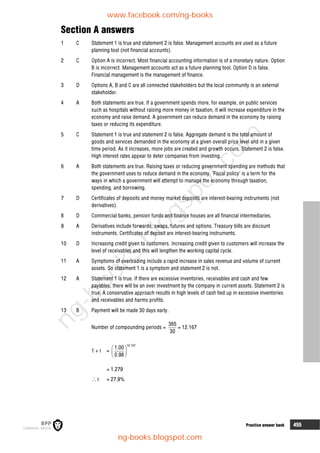
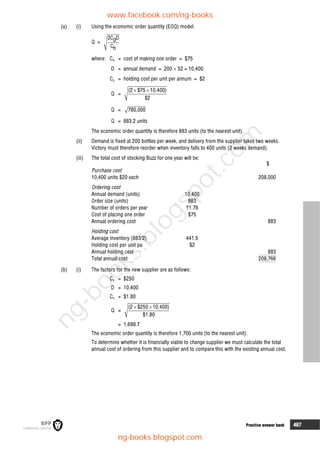
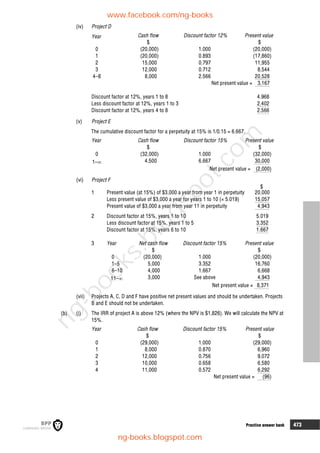
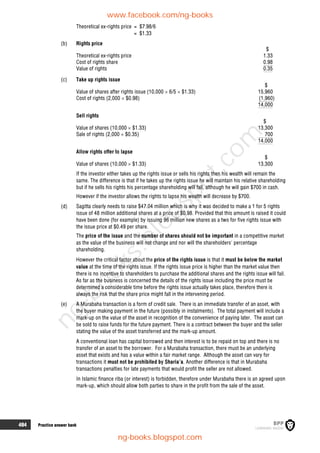
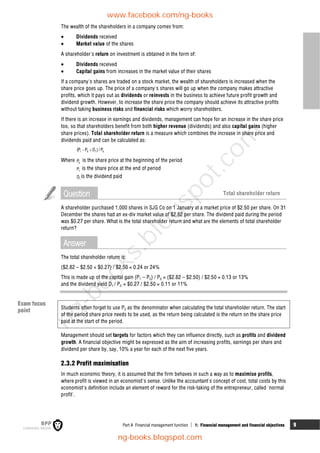
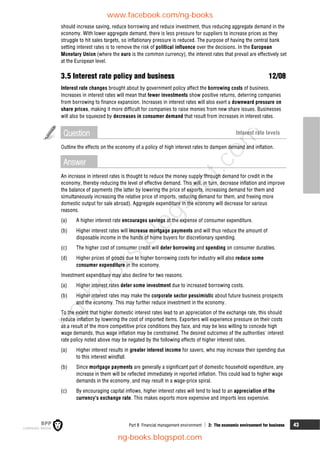
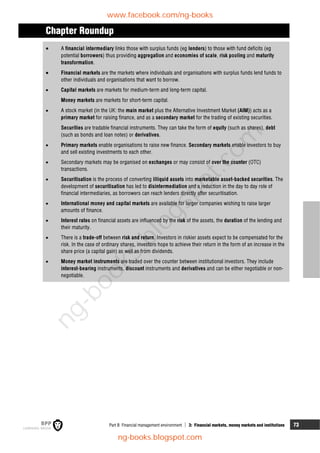
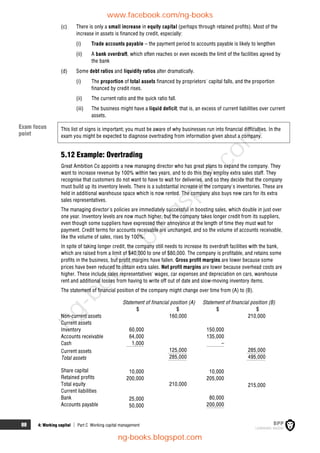
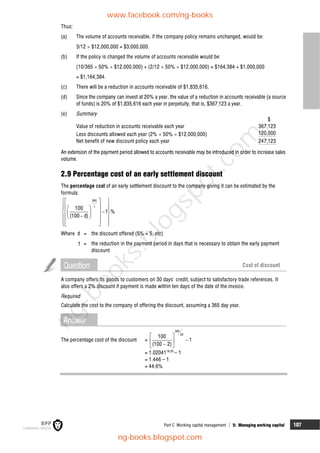
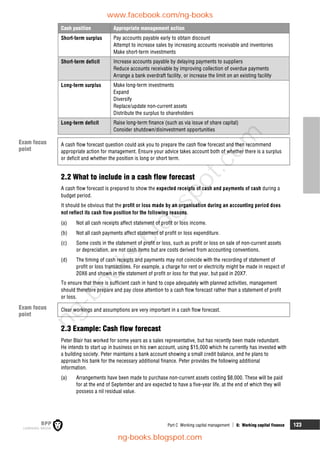
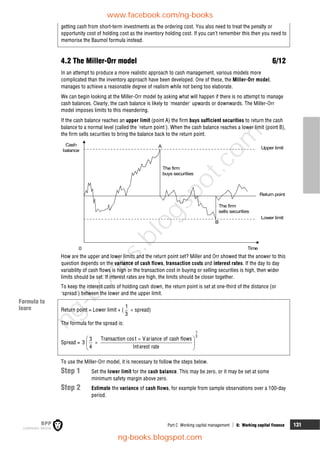
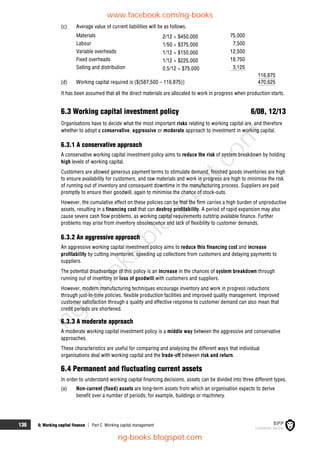
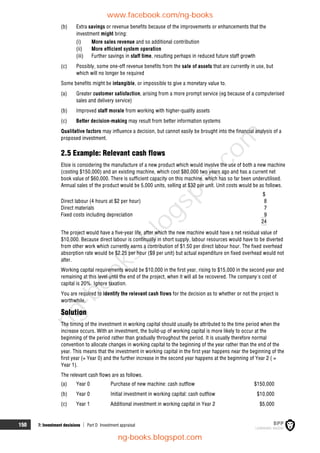
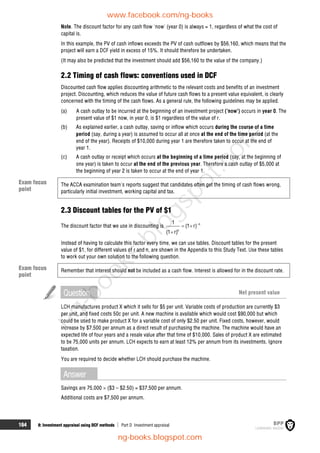
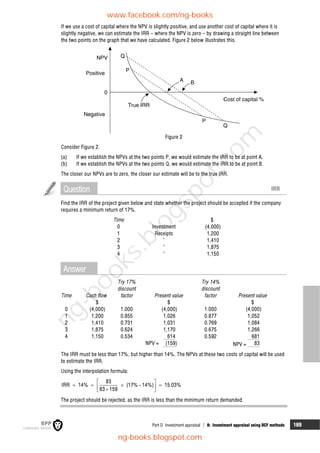
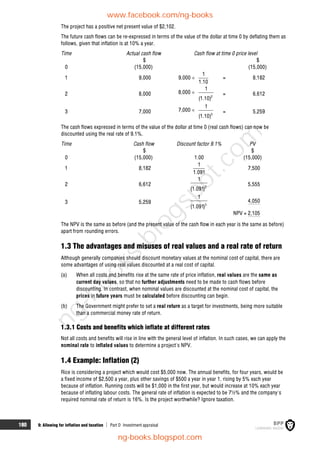
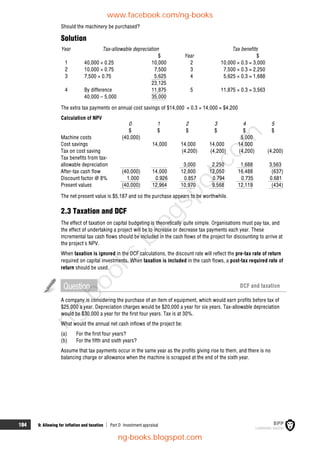
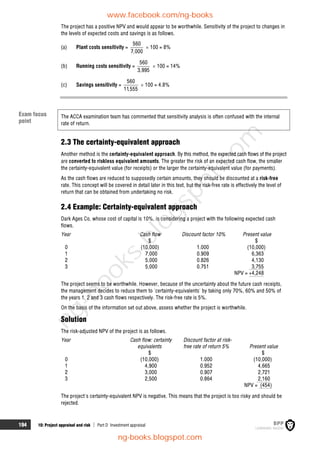
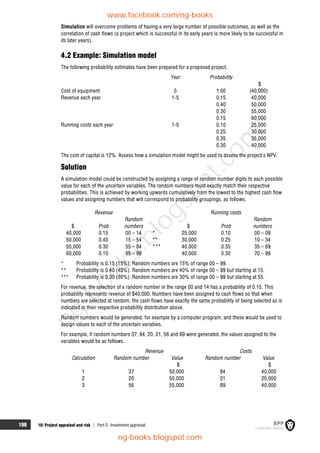
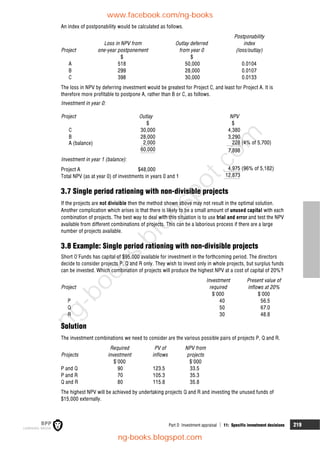
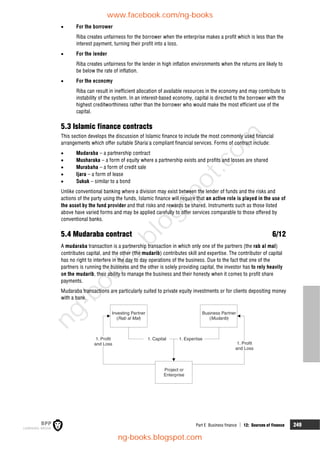
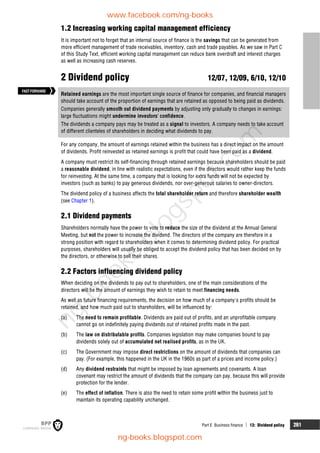
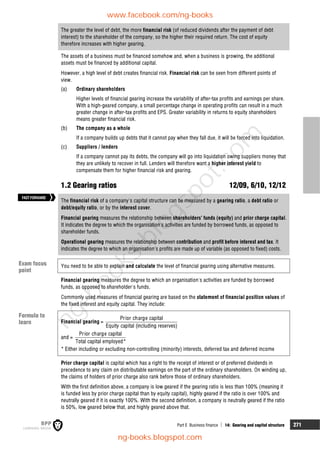
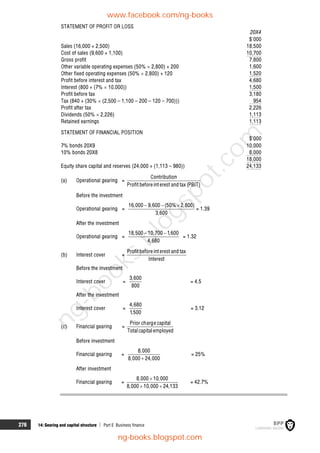
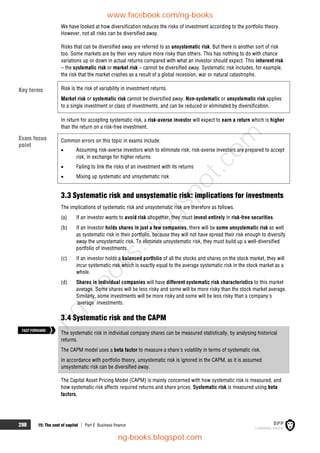
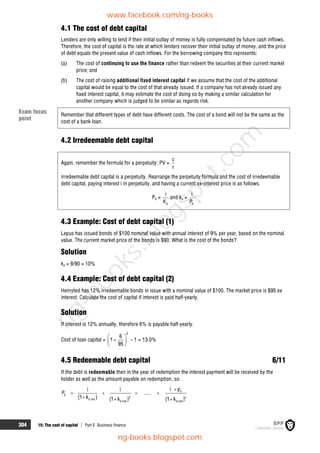
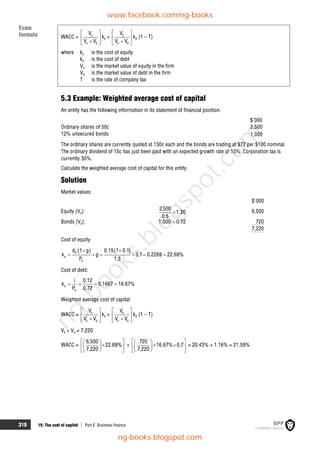
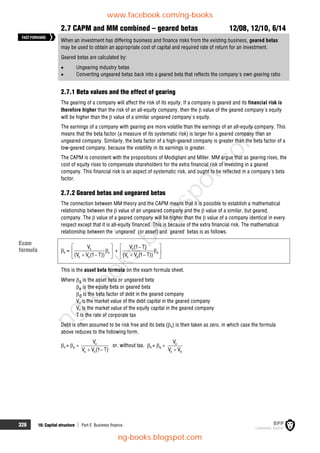
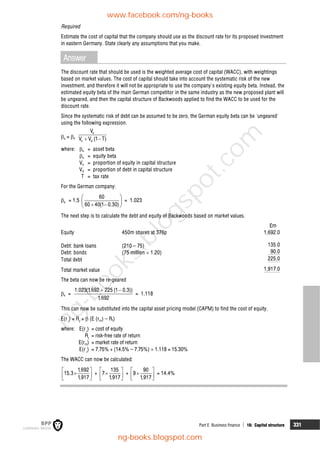
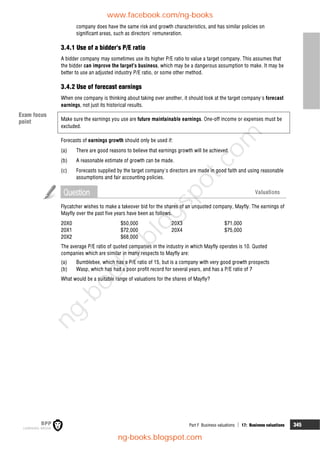
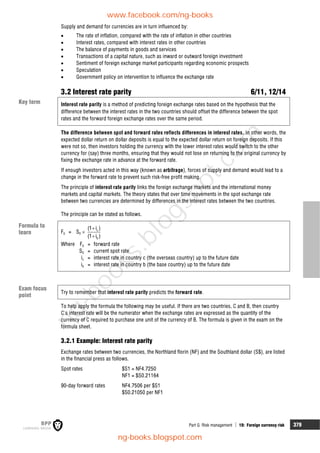
3.6 Four-way equivalence
The four-way equivalence model states that in equilibrium, differences between forward and spot rates,
differences in interest rates, expected differences in inflation rates and expected changes in spot rates are
equal to one another.
(equals)
Expectation
theory
(equals)
Fisher effects
Difference in interest rates Expected differences in
inflation rates
Expected change in spot
rate
Difference between forward
and spot
(equals)
Interest rate parity
(equals)
International
Fisher effects
(equals)
Purchasing power
parity
Exam
formula
www.facebook.com/ng-books
ng-books.blogspot.com
n
g
-
b
o
o
k
s
.
b
l
o
g
s
p
o
t
.
c
o
m](https://image.slidesharecdn.com/f9financialmanagement-studytext2016-2017-220618221639-e43e6ffa/85/F9-Financial-Management-Study-Text-2016-2017-pdf-407-320.jpg)