Exercise3 2
•
0 likes•116 views
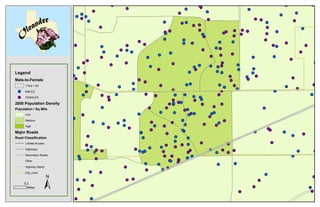
This map shows population density by gender in 2000, with dots representing groups of 50 people broken down by male and female. It also shows roads and their classifications, from limited access highways to secondary roads to city limits, all overlaid on a color-coded population density scale ranging from low to medium to high density per square mile.
Report
Share
Report
Share
Download to read offline
Recommended
Tony dize project by mayra
Mayra discusses Tony Dize, a reggaeton artist known for party music with a Latin style that blends reggae, rap, and dance. His music evokes feelings of happiness and sometimes sadness, and makes people want to party. Tony Dize has a great voice for singing, meaningful lyrics, and a unique singing style. His songs reflect on relationships and everyday experiences that most people can relate to.
Oliver Festival of the Grape Photos
The Okanagan Valley's largest family fall wine festival!
Held annually at the Oliver Recreation Centre, the Festival of the Grape celebrates the grape harvest in the Okanagan Valley. Organised by the South Okanagan Chamber of Commerce and hundreds of volunteers, the Festival of the Grape attracts over 3,500 people from western Canada to sample the finest wines from 50+ Okangan wineries and taste the best in Okanagan cuisine from innovative local chefs and local food vendors. The family-oriented one-day event has something for everyone. Some of these include: entertaining grandstand music. grape stomping competitions, a separate Kids Zone play area for children including activities, games nd farm animals; local arts and crafts and trade show vendors. Parking is free.
Academia, part of my 2014-2015 lectures at the University of Bergamo.
Academia, part of my 2014-2015 lectures at the University of Bergamo. It's stimulus material, posted to improve communication with current students. It's not interesting for the academia.
Robert Lepage PrÉsentatique2003
Dans le cadre du cours de Méthodologie - Une présentatique sur Robert Lepage
Relevantes del lunes 3 de enero de 2011
La Unión Europea ha acordado un paquete de sanciones contra Rusia por su invasión de Ucrania. Las sanciones incluyen restricciones a las transacciones con bancos rusos clave y la prohibición de la venta de aviones y equipos a Rusia. Los líderes de la UE también acordaron excluir a varios bancos rusos del sistema SWIFT de mensajería financiera.
GBSYS - Solución Informática para Sector Público - 2013
Este documento describe una solución de planificación de recursos gubernamentales (GRP) para el sector público. Un GRP es un sistema integrado que rastrea la situación financiera, la gestión presupuestaria, las compras, los activos y los inventarios de una organización. Un GRP ofrece ventajas como la reducción de errores, información en línea confiable y la capacidad de que toda la organización comparta la misma información. La implementación exitosa de un GRP requiere el liderazgo y la visión de la alta dirección para definir objet
Pronombres
This document contains a series of numbers without any other context or information provided. It is not possible to provide a meaningful summary with only these numbers given.
Como registrarse en focebook,
Este documento proporciona instrucciones sobre cómo registrarse y usar Facebook. Explica que los usuarios deben ingresar su correo electrónico y contraseña, y que si ya están registrados deben ingresar esos datos. También describe cómo registrar nuevos datos de usuario, buscar y ver perfiles de otras personas, publicar mensajes y fotos para que otros usuarios puedan verlos, y enviar mensajes privados. Resalta que Facebook es un medio para comunicarse y conocer amigos de todo el mundo.
Scotland – Ireland Archaeological Collaboration - Ireland
Scotland – Ireland Archaeological Collaboration - IrelandRoyal Commission on the Ancient and Historical Monuments of Scotland (RCAHMS)
Scotland – Ireland Archaeological Collaboration
On the 30th October 2014 Historic Scotland hosted a gathering at Edinburgh Castle. Over 50 archaeologists from Scotland, Northern Ireland and the Republic of Ireland gathered together with experts in funding from the Arts and Humanities Research Council, Scotland Europa, the Heritage Lottery Fund, Resourcing Scotland’s Heritage and Creative Scotland (Creative Europe). There was also a delegate from the Isle of Man. The presentations from the day are on this slideshare.
Ann Lynch - The National Monuments Service, Department of Arts, Heritage and the Gaeltacht, IrelandWhat's Sant Jordi?
Sant Jordi is celebrated annually on April 23rd in Catalonia. It is the feast day of Sant Jordi, the patron saint of Catalonia. On this day, lovers and friends give each other roses and books to celebrate both romance and literature. The streets are filled with rose markets and bookstands as all of Catalonia honors their patron saint and enjoys this cultural tradition.
Bucharest in the 30s (v.m.)
The document is comprised of dates from April 1932 to May 1937 with a few dates in September 1939. There is no other substantive information provided beyond the listing of dates.
Maldive New Hotel
The document discusses the benefits of exercise for mental health. Regular physical activity can help reduce anxiety and depression and improve mood and cognitive function. Exercise causes chemical changes in the brain that may help protect against mental illness and improve symptoms.
All about africa
This document provides information about various topics related to Africa, including its education system, wildlife, climate, tallest mountain, culture and arts, rainforests, languages and population, desertification and water issues, and economic conditions. It discusses how the education system has shifted from preparing youth for adulthood to prioritizing education, and details Africa's biodiversity including over 300 mammal and 800 bird species in South Africa. The climate varies by latitude and proximity to the equator. Mt. Kilimanjaro is the highest peak. Traditional African music incorporates drums and other instruments, while masks were important in cultural rituals. Deforestation threatens rainforests. The population speaks many languages and is over 1 billion. Desertification and
Life during the depression chapter 9 geeegeeee
During the Great Depression, many families struggled to afford basic necessities like food and housing. Soup kitchens opened to feed those who could not afford meals as a drought devastated farms. Unemployment was rampant as people turned to cheap forms of entertainment like movies, radio, and board games to escape their hardships temporarily. President Hoover attempted to stimulate the economy through public works projects and encouraging banks to lend more money, though his efforts did little to alleviate the suffering of the Depression.
M. shadows
M. Shadows is a singer and musician from Huntington Beach, California who has been performing hard rock and metalcore music since 1999. Known for his harsh screaming vocals delivered without straining his voice, M. Shadows' song lyrics often reflect on difficult situations and emotions, as well as recent hardships like the death of his band's drummer.
Deadmau5
Deadmau5 is an electronic music artist known for projecting an electronic sound from the stage that excites crowds. His loud yet soothing songs can elicit mixed emotions from listeners, bringing either happiness and excitement or calm and relaxation depending on the track. In addition to his musical talents as a DJ, Deadmau5, whose stage name comes from his mouse-themed helmet, has won 11 awards out of 19 nominations, reflecting his skills as an artist and the impact of his music.
Tupac amaru shakur sergio
Tupac Amaru Shakur was known for gangster rap music that sold over 75 million records, making him one of the best-selling music artists. His music dealt with themes of violence and hardship in inner cities. Tupac had a rough, thug-like style influenced by his upbringing in poverty in the ghetto. His music elicited different emotions, from excitement to sadness to providing a soundtrack for cruising. Tupac demonstrated his talents through starring in several movies as well as producing hit songs that sold millions. His music reflected the suffering of people in society that was hidden from view.
The beatles jeanie
This artist or group performs many different types of music that has evolved over the years due to changes in their moods and experiences. Their talents are uniquely demonstrated through their music which can make listeners feel various emotions like happy, sad, slow or hyper depending on the song. The music both reflected and challenged the society in which it was created by addressing approved and unapproved topics.
Music power point
Queen is a British rock band formed in London in 1971. The original members were lead singer Freddie Mercury (1970-1991), guitarist Brian May (1970-present), drummer Roger Taylor (1970-present), and bassist John Deacon (1971-1997). The student describes Queen's style as "epic and revolutionizing" and says their music can make them feel motivated, comic, or a little down. They note Freddie Mercury's background as an opera singer gave him an amazing voice that helped make Queen's sound unique.
Lil wayne isaiah
Lil Wayne is a rap and hip hop artist known for his talented group of young and grown performers. His music gets listeners in a zone as they flow to the beats and lyrics, demonstrating his special talent for consistently producing popular music that inspires youth to pursue their dreams in rap.
More Related Content
Viewers also liked
Pronombres
This document contains a series of numbers without any other context or information provided. It is not possible to provide a meaningful summary with only these numbers given.
Como registrarse en focebook,
Este documento proporciona instrucciones sobre cómo registrarse y usar Facebook. Explica que los usuarios deben ingresar su correo electrónico y contraseña, y que si ya están registrados deben ingresar esos datos. También describe cómo registrar nuevos datos de usuario, buscar y ver perfiles de otras personas, publicar mensajes y fotos para que otros usuarios puedan verlos, y enviar mensajes privados. Resalta que Facebook es un medio para comunicarse y conocer amigos de todo el mundo.
Scotland – Ireland Archaeological Collaboration - Ireland
Scotland – Ireland Archaeological Collaboration - IrelandRoyal Commission on the Ancient and Historical Monuments of Scotland (RCAHMS)
Scotland – Ireland Archaeological Collaboration
On the 30th October 2014 Historic Scotland hosted a gathering at Edinburgh Castle. Over 50 archaeologists from Scotland, Northern Ireland and the Republic of Ireland gathered together with experts in funding from the Arts and Humanities Research Council, Scotland Europa, the Heritage Lottery Fund, Resourcing Scotland’s Heritage and Creative Scotland (Creative Europe). There was also a delegate from the Isle of Man. The presentations from the day are on this slideshare.
Ann Lynch - The National Monuments Service, Department of Arts, Heritage and the Gaeltacht, IrelandWhat's Sant Jordi?
Sant Jordi is celebrated annually on April 23rd in Catalonia. It is the feast day of Sant Jordi, the patron saint of Catalonia. On this day, lovers and friends give each other roses and books to celebrate both romance and literature. The streets are filled with rose markets and bookstands as all of Catalonia honors their patron saint and enjoys this cultural tradition.
Bucharest in the 30s (v.m.)
The document is comprised of dates from April 1932 to May 1937 with a few dates in September 1939. There is no other substantive information provided beyond the listing of dates.
Maldive New Hotel
The document discusses the benefits of exercise for mental health. Regular physical activity can help reduce anxiety and depression and improve mood and cognitive function. Exercise causes chemical changes in the brain that may help protect against mental illness and improve symptoms.
Viewers also liked (13)
Scotland – Ireland Archaeological Collaboration - Ireland
Scotland – Ireland Archaeological Collaboration - Ireland
CSA - Sondage soir du vote 2cd tour Présidentielle BFMTV RMC 20Minutes
CSA - Sondage soir du vote 2cd tour Présidentielle BFMTV RMC 20Minutes
More from angelagig
All about africa
This document provides information about various topics related to Africa, including its education system, wildlife, climate, tallest mountain, culture and arts, rainforests, languages and population, desertification and water issues, and economic conditions. It discusses how the education system has shifted from preparing youth for adulthood to prioritizing education, and details Africa's biodiversity including over 300 mammal and 800 bird species in South Africa. The climate varies by latitude and proximity to the equator. Mt. Kilimanjaro is the highest peak. Traditional African music incorporates drums and other instruments, while masks were important in cultural rituals. Deforestation threatens rainforests. The population speaks many languages and is over 1 billion. Desertification and
Life during the depression chapter 9 geeegeeee
During the Great Depression, many families struggled to afford basic necessities like food and housing. Soup kitchens opened to feed those who could not afford meals as a drought devastated farms. Unemployment was rampant as people turned to cheap forms of entertainment like movies, radio, and board games to escape their hardships temporarily. President Hoover attempted to stimulate the economy through public works projects and encouraging banks to lend more money, though his efforts did little to alleviate the suffering of the Depression.
M. shadows
M. Shadows is a singer and musician from Huntington Beach, California who has been performing hard rock and metalcore music since 1999. Known for his harsh screaming vocals delivered without straining his voice, M. Shadows' song lyrics often reflect on difficult situations and emotions, as well as recent hardships like the death of his band's drummer.
Deadmau5
Deadmau5 is an electronic music artist known for projecting an electronic sound from the stage that excites crowds. His loud yet soothing songs can elicit mixed emotions from listeners, bringing either happiness and excitement or calm and relaxation depending on the track. In addition to his musical talents as a DJ, Deadmau5, whose stage name comes from his mouse-themed helmet, has won 11 awards out of 19 nominations, reflecting his skills as an artist and the impact of his music.
Tupac amaru shakur sergio
Tupac Amaru Shakur was known for gangster rap music that sold over 75 million records, making him one of the best-selling music artists. His music dealt with themes of violence and hardship in inner cities. Tupac had a rough, thug-like style influenced by his upbringing in poverty in the ghetto. His music elicited different emotions, from excitement to sadness to providing a soundtrack for cruising. Tupac demonstrated his talents through starring in several movies as well as producing hit songs that sold millions. His music reflected the suffering of people in society that was hidden from view.
The beatles jeanie
This artist or group performs many different types of music that has evolved over the years due to changes in their moods and experiences. Their talents are uniquely demonstrated through their music which can make listeners feel various emotions like happy, sad, slow or hyper depending on the song. The music both reflected and challenged the society in which it was created by addressing approved and unapproved topics.
Music power point
Queen is a British rock band formed in London in 1971. The original members were lead singer Freddie Mercury (1970-1991), guitarist Brian May (1970-present), drummer Roger Taylor (1970-present), and bassist John Deacon (1971-1997). The student describes Queen's style as "epic and revolutionizing" and says their music can make them feel motivated, comic, or a little down. They note Freddie Mercury's background as an opera singer gave him an amazing voice that helped make Queen's sound unique.
Lil wayne isaiah
Lil Wayne is a rap and hip hop artist known for his talented group of young and grown performers. His music gets listeners in a zone as they flow to the beats and lyrics, demonstrating his special talent for consistently producing popular music that inspires youth to pursue their dreams in rap.
Jimi hendrix salvador
Jimi Hendrix was an influential psychedelic rock guitarist known for his diverse music styles including hard rock, blues rock, and acid rock. He was one of the first black rock artists of his generation and was renowned for his unique guitar playing talents, including playing left-handed and often destroying his guitar on stage after concerts. Hendrix had a huge impact on music in the 1960s and inspired many other artists with his innovative and groovy psychedelic rock sound.
Kid cudi judah
Kid Cudi is an alternative hip hop artist known for his unique style that focuses on life struggles rather than money or fame. His music makes listeners feel chill and understood as many can relate to his lyrics. Out of his many talents, his strongest is his skill as a songwriter who creates chill music that reflects a chill influence on society.
Edith j
Swagland is part of the greater world of Halla, where all lives are unique. Swagland believes in equality, freedom of choice, and swag. Discrimination is the worst crime. Technology is advanced, with underground cities and voice-activated holographic computers. Hard labor is done by robots so humans are safe. Swaglanians have free will to choose their own path in life and everything is colorful, unlike the controlled and colorless world of Jonas. The Swagland pledge emphasizes living in the present moment.
Alifornia a by me
Aliforniaa is a planet located billions of miles from Earth. It has advanced technology like flying cars and monkeys with jet packs. All Aliforniaans believe in not picking their noses and wearing blue hats on Fridays. They pray to Allah on Sundays. When laws are broken, the leader Darth Vader punishes criminals by making them walk on hot coals or punching them. Aliforniaa is compared to Jonas's world, which does not have a religion and has less advanced technology.
Jose lopez
Orchids, bromeliads, succulents, and aloe are common plant varieties found in tropical dry forests. Rhinoceroses, hornbills, snakes, hog deer, and tigers are some animal species. Quercusoleoides is a keystone tree species. Tropical dry forests have distinct wet and dry seasons, warm temperatures year-round, and are located in parts of Africa, South America, Central America, India, and Australia. They have good soil for agriculture and tourism activities like hiking and camping. Conservation efforts include more efficient farming and forestry, and reserves to protect species and ecosystems.
Tropical savanna
The document summarizes information about the tropical savanna biome. It describes several animal species found in the savanna, including lions, black mambas, koala bears, and Nile crocodiles. It also lists some plant species that grow in the savanna, such as the Senegal Gum Acacia and elephant grass. Elephants and lions are identified as keystone species. The tropical savanna is characterized by vast plains, small rivers, and mountain ranges. Conservation efforts are focused on preventing poaching and protecting endangered species.
Desrt biome
1) The document describes several animals and plants commonly found in desert biomes, including the roadrunner, Texas horned lizard, caracal, black widow spider, barrel cactus, brittle bush, chain fruit cholla, and creosote bush.
2) It provides details on the climate and characteristics of desert biomes, noting low precipitation, variable temperatures, and soil rich in minerals but poor in organic material.
3) Examples of desert locations mentioned include Africa, Asia, the Middle East, United States, Mexico, and Australia.
Science of flight
Daniel Bernoulli discovered the principle that explains how lift is generated to allow planes to fly. The Bernoulli principle states that the shape of airplane wings causes air flowing over the top to travel faster than underneath, resulting in lower pressure above and lift. The four forces of flight that act on a plane are lift, which pushes it up; thrust, which propels it forward; drag, which slows it down; and gravity, which pulls it toward the earth.
Marlene Echeverria, A Healthy Reptile
Royal pythons, also known as ball pythons, curl into a ball when stressed and make good pets as they are harmless, venomless, and grow to around 4-5 feet. They need an enclosure with enough space, humidity control, hiding places, climbing branches, and a thermostat to regulate temperature as they are cold-blooded. Proper care involves cleaning water bowls weekly, spot cleaning waste daily, and a full enclosure cleaning every few months. Ball pythons shed periodically and may appear dull or have cloudy eyes before shedding.
More from angelagig (20)
Recently uploaded
Project Management Semester Long Project - Acuity
Acuity is an innovative learning app designed to transform the way you engage with knowledge. Powered by AI technology, Acuity takes complex topics and distills them into concise, interactive summaries that are easy to read & understand. Whether you're exploring the depths of quantum mechanics or seeking insight into historical events, Acuity provides the key information you need without the burden of lengthy texts.
Programming Foundation Models with DSPy - Meetup Slides
Prompting language models is hard, while programming language models is easy. In this talk, I will discuss the state-of-the-art framework DSPy for programming foundation models with its powerful optimizers and runtime constraint system.
AI 101: An Introduction to the Basics and Impact of Artificial Intelligence
Imagine a world where machines not only perform tasks but also learn, adapt, and make decisions. This is the promise of Artificial Intelligence (AI), a technology that's not just enhancing our lives but revolutionizing entire industries.
Main news related to the CCS TSI 2023 (2023/1695)
An English 🇬🇧 translation of a presentation to the speech I gave about the main changes brought by CCS TSI 2023 at the biggest Czech conference on Communications and signalling systems on Railways, which was held in Clarion Hotel Olomouc from 7th to 9th November 2023 (konferenceszt.cz). Attended by around 500 participants and 200 on-line followers.
The original Czech 🇨🇿 version of the presentation can be found here: https://www.slideshare.net/slideshow/hlavni-novinky-souvisejici-s-ccs-tsi-2023-2023-1695/269688092 .
The videorecording (in Czech) from the presentation is available here: https://youtu.be/WzjJWm4IyPk?si=SImb06tuXGb30BEH .
TrustArc Webinar - 2024 Global Privacy Survey
How does your privacy program stack up against your peers? What challenges are privacy teams tackling and prioritizing in 2024?
In the fifth annual Global Privacy Benchmarks Survey, we asked over 1,800 global privacy professionals and business executives to share their perspectives on the current state of privacy inside and outside of their organizations. This year’s report focused on emerging areas of importance for privacy and compliance professionals, including considerations and implications of Artificial Intelligence (AI) technologies, building brand trust, and different approaches for achieving higher privacy competence scores.
See how organizational priorities and strategic approaches to data security and privacy are evolving around the globe.
This webinar will review:
- The top 10 privacy insights from the fifth annual Global Privacy Benchmarks Survey
- The top challenges for privacy leaders, practitioners, and organizations in 2024
- Key themes to consider in developing and maintaining your privacy program
Ocean lotus Threat actors project by John Sitima 2024 (1).pptx
Ocean Lotus cyber threat actors represent a sophisticated, persistent, and politically motivated group that poses a significant risk to organizations and individuals in the Southeast Asian region. Their continuous evolution and adaptability underscore the need for robust cybersecurity measures and international cooperation to identify and mitigate the threats posed by such advanced persistent threat groups.
“Building and Scaling AI Applications with the Nx AI Manager,” a Presentation...
“Building and Scaling AI Applications with the Nx AI Manager,” a Presentation...Edge AI and Vision Alliance
For the full video of this presentation, please visit: https://www.edge-ai-vision.com/2024/06/building-and-scaling-ai-applications-with-the-nx-ai-manager-a-presentation-from-network-optix/
Robin van Emden, Senior Director of Data Science at Network Optix, presents the “Building and Scaling AI Applications with the Nx AI Manager,” tutorial at the May 2024 Embedded Vision Summit.
In this presentation, van Emden covers the basics of scaling edge AI solutions using the Nx tool kit. He emphasizes the process of developing AI models and deploying them globally. He also showcases the conversion of AI models and the creation of effective edge AI pipelines, with a focus on pre-processing, model conversion, selecting the appropriate inference engine for the target hardware and post-processing.
van Emden shows how Nx can simplify the developer’s life and facilitate a rapid transition from concept to production-ready applications.He provides valuable insights into developing scalable and efficient edge AI solutions, with a strong focus on practical implementation.Unlock the Future of Search with MongoDB Atlas_ Vector Search Unleashed.pdf
Discover how MongoDB Atlas and vector search technology can revolutionize your application's search capabilities. This comprehensive presentation covers:
* What is Vector Search?
* Importance and benefits of vector search
* Practical use cases across various industries
* Step-by-step implementation guide
* Live demos with code snippets
* Enhancing LLM capabilities with vector search
* Best practices and optimization strategies
Perfect for developers, AI enthusiasts, and tech leaders. Learn how to leverage MongoDB Atlas to deliver highly relevant, context-aware search results, transforming your data retrieval process. Stay ahead in tech innovation and maximize the potential of your applications.
#MongoDB #VectorSearch #AI #SemanticSearch #TechInnovation #DataScience #LLM #MachineLearning #SearchTechnology
National Security Agency - NSA mobile device best practices
Threats to mobile devices are more prevalent and increasing in scope and complexity. Users of mobile devices desire to take full advantage of the features
available on those devices, but many of the features provide convenience and capability but sacrifice security. This best practices guide outlines steps the users can take to better protect personal devices and information.
HCL Notes und Domino Lizenzkostenreduzierung in der Welt von DLAU
Webinar Recording: https://www.panagenda.com/webinars/hcl-notes-und-domino-lizenzkostenreduzierung-in-der-welt-von-dlau/
DLAU und die Lizenzen nach dem CCB- und CCX-Modell sind für viele in der HCL-Community seit letztem Jahr ein heißes Thema. Als Notes- oder Domino-Kunde haben Sie vielleicht mit unerwartet hohen Benutzerzahlen und Lizenzgebühren zu kämpfen. Sie fragen sich vielleicht, wie diese neue Art der Lizenzierung funktioniert und welchen Nutzen sie Ihnen bringt. Vor allem wollen Sie sicherlich Ihr Budget einhalten und Kosten sparen, wo immer möglich. Das verstehen wir und wir möchten Ihnen dabei helfen!
Wir erklären Ihnen, wie Sie häufige Konfigurationsprobleme lösen können, die dazu führen können, dass mehr Benutzer gezählt werden als nötig, und wie Sie überflüssige oder ungenutzte Konten identifizieren und entfernen können, um Geld zu sparen. Es gibt auch einige Ansätze, die zu unnötigen Ausgaben führen können, z. B. wenn ein Personendokument anstelle eines Mail-Ins für geteilte Mailboxen verwendet wird. Wir zeigen Ihnen solche Fälle und deren Lösungen. Und natürlich erklären wir Ihnen das neue Lizenzmodell.
Nehmen Sie an diesem Webinar teil, bei dem HCL-Ambassador Marc Thomas und Gastredner Franz Walder Ihnen diese neue Welt näherbringen. Es vermittelt Ihnen die Tools und das Know-how, um den Überblick zu bewahren. Sie werden in der Lage sein, Ihre Kosten durch eine optimierte Domino-Konfiguration zu reduzieren und auch in Zukunft gering zu halten.
Diese Themen werden behandelt
- Reduzierung der Lizenzkosten durch Auffinden und Beheben von Fehlkonfigurationen und überflüssigen Konten
- Wie funktionieren CCB- und CCX-Lizenzen wirklich?
- Verstehen des DLAU-Tools und wie man es am besten nutzt
- Tipps für häufige Problembereiche, wie z. B. Team-Postfächer, Funktions-/Testbenutzer usw.
- Praxisbeispiele und Best Practices zum sofortigen Umsetzen
Monitoring and Managing Anomaly Detection on OpenShift.pdf
Monitoring and Managing Anomaly Detection on OpenShift
Overview
Dive into the world of anomaly detection on edge devices with our comprehensive hands-on tutorial. This SlideShare presentation will guide you through the entire process, from data collection and model training to edge deployment and real-time monitoring. Perfect for those looking to implement robust anomaly detection systems on resource-constrained IoT/edge devices.
Key Topics Covered
1. Introduction to Anomaly Detection
- Understand the fundamentals of anomaly detection and its importance in identifying unusual behavior or failures in systems.
2. Understanding Edge (IoT)
- Learn about edge computing and IoT, and how they enable real-time data processing and decision-making at the source.
3. What is ArgoCD?
- Discover ArgoCD, a declarative, GitOps continuous delivery tool for Kubernetes, and its role in deploying applications on edge devices.
4. Deployment Using ArgoCD for Edge Devices
- Step-by-step guide on deploying anomaly detection models on edge devices using ArgoCD.
5. Introduction to Apache Kafka and S3
- Explore Apache Kafka for real-time data streaming and Amazon S3 for scalable storage solutions.
6. Viewing Kafka Messages in the Data Lake
- Learn how to view and analyze Kafka messages stored in a data lake for better insights.
7. What is Prometheus?
- Get to know Prometheus, an open-source monitoring and alerting toolkit, and its application in monitoring edge devices.
8. Monitoring Application Metrics with Prometheus
- Detailed instructions on setting up Prometheus to monitor the performance and health of your anomaly detection system.
9. What is Camel K?
- Introduction to Camel K, a lightweight integration framework built on Apache Camel, designed for Kubernetes.
10. Configuring Camel K Integrations for Data Pipelines
- Learn how to configure Camel K for seamless data pipeline integrations in your anomaly detection workflow.
11. What is a Jupyter Notebook?
- Overview of Jupyter Notebooks, an open-source web application for creating and sharing documents with live code, equations, visualizations, and narrative text.
12. Jupyter Notebooks with Code Examples
- Hands-on examples and code snippets in Jupyter Notebooks to help you implement and test anomaly detection models.
Your One-Stop Shop for Python Success: Top 10 US Python Development Providers
Simplify your search for a reliable Python development partner! This list presents the top 10 trusted US providers offering comprehensive Python development services, ensuring your project's success from conception to completion.
OpenID AuthZEN Interop Read Out - Authorization
During Identiverse 2024 and EIC 2024, members of the OpenID AuthZEN WG got together and demoed their authorization endpoints conforming to the AuthZEN API
Skybuffer SAM4U tool for SAP license adoption
Manage and optimize your license adoption and consumption with SAM4U, an SAP free customer software asset management tool.
SAM4U, an SAP complimentary software asset management tool for customers, delivers a detailed and well-structured overview of license inventory and usage with a user-friendly interface. We offer a hosted, cost-effective, and performance-optimized SAM4U setup in the Skybuffer Cloud environment. You retain ownership of the system and data, while we manage the ABAP 7.58 infrastructure, ensuring fixed Total Cost of Ownership (TCO) and exceptional services through the SAP Fiori interface.
Recently uploaded (20)
Programming Foundation Models with DSPy - Meetup Slides
Programming Foundation Models with DSPy - Meetup Slides
AI 101: An Introduction to the Basics and Impact of Artificial Intelligence
AI 101: An Introduction to the Basics and Impact of Artificial Intelligence
Nordic Marketo Engage User Group_June 13_ 2024.pptx
Nordic Marketo Engage User Group_June 13_ 2024.pptx
Ocean lotus Threat actors project by John Sitima 2024 (1).pptx
Ocean lotus Threat actors project by John Sitima 2024 (1).pptx
Deep Dive: AI-Powered Marketing to Get More Leads and Customers with HyperGro...
Deep Dive: AI-Powered Marketing to Get More Leads and Customers with HyperGro...
“Building and Scaling AI Applications with the Nx AI Manager,” a Presentation...
“Building and Scaling AI Applications with the Nx AI Manager,” a Presentation...
Unlock the Future of Search with MongoDB Atlas_ Vector Search Unleashed.pdf
Unlock the Future of Search with MongoDB Atlas_ Vector Search Unleashed.pdf
National Security Agency - NSA mobile device best practices
National Security Agency - NSA mobile device best practices
HCL Notes und Domino Lizenzkostenreduzierung in der Welt von DLAU
HCL Notes und Domino Lizenzkostenreduzierung in der Welt von DLAU
Monitoring and Managing Anomaly Detection on OpenShift.pdf
Monitoring and Managing Anomaly Detection on OpenShift.pdf
Your One-Stop Shop for Python Success: Top 10 US Python Development Providers
Your One-Stop Shop for Python Success: Top 10 US Python Development Providers
Exercise3 2
- 1. Legend Male-to-Female 1 Dot = 50 MALES FEMALES 2000 Population Density Population / Sq Mile Low Medium High Major Roads Road Classification Limited Access Highways Secondary Roads Other Highway Ramp City_Limit 0.2 Miles ±