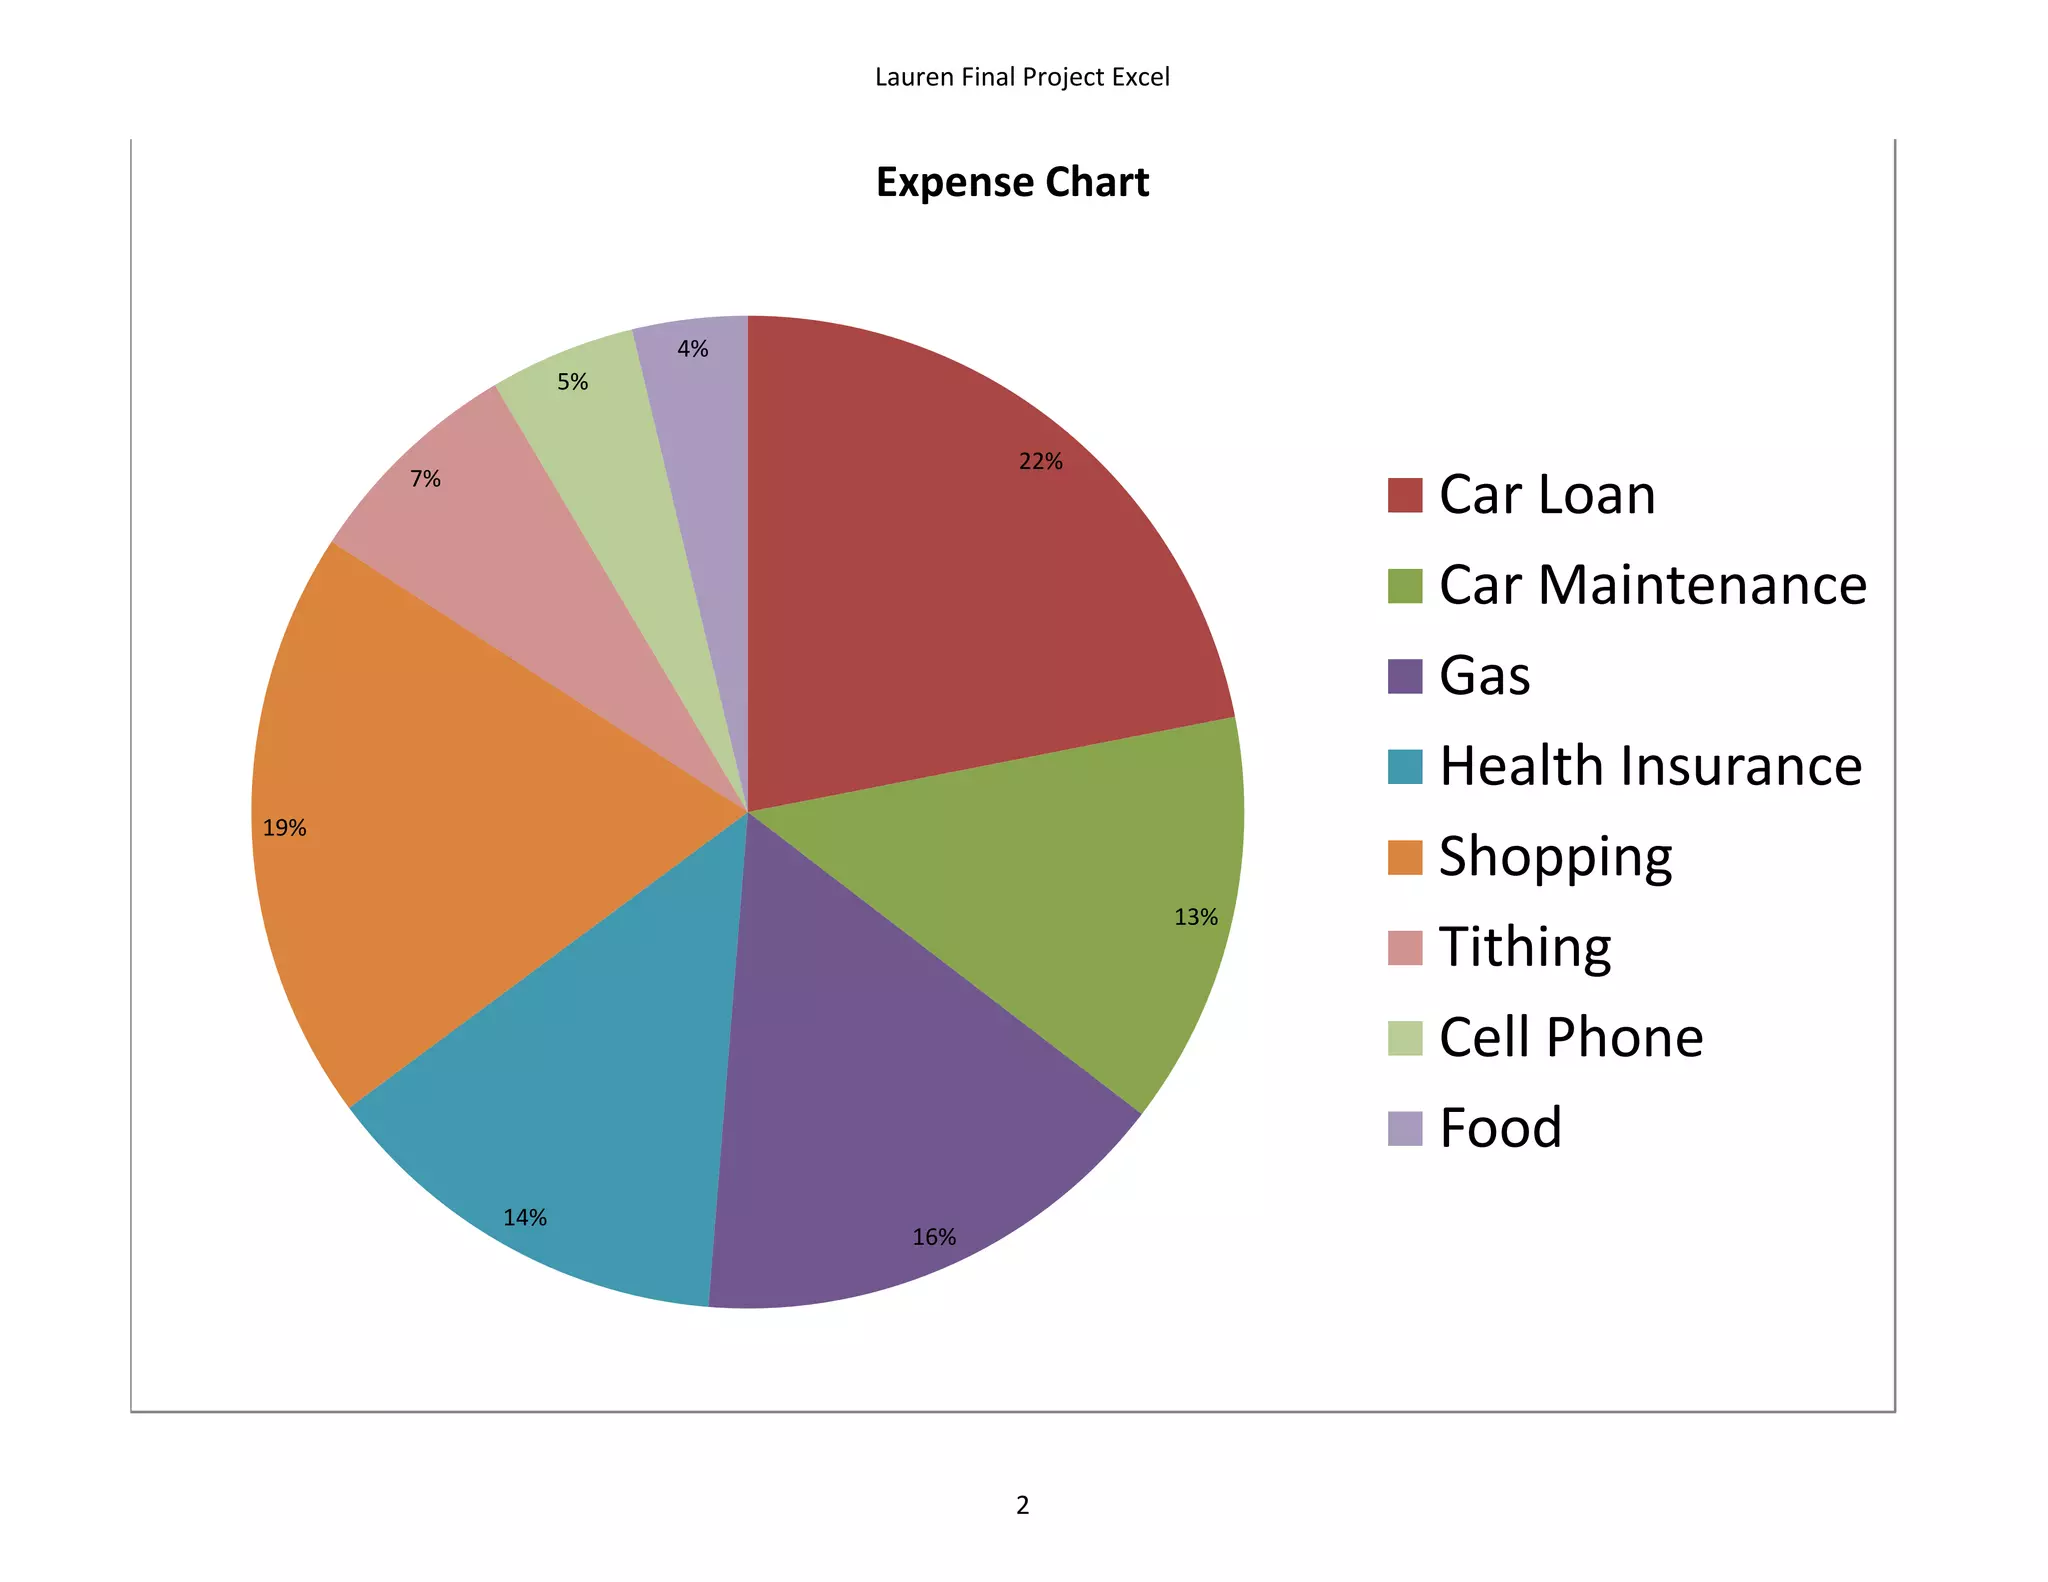
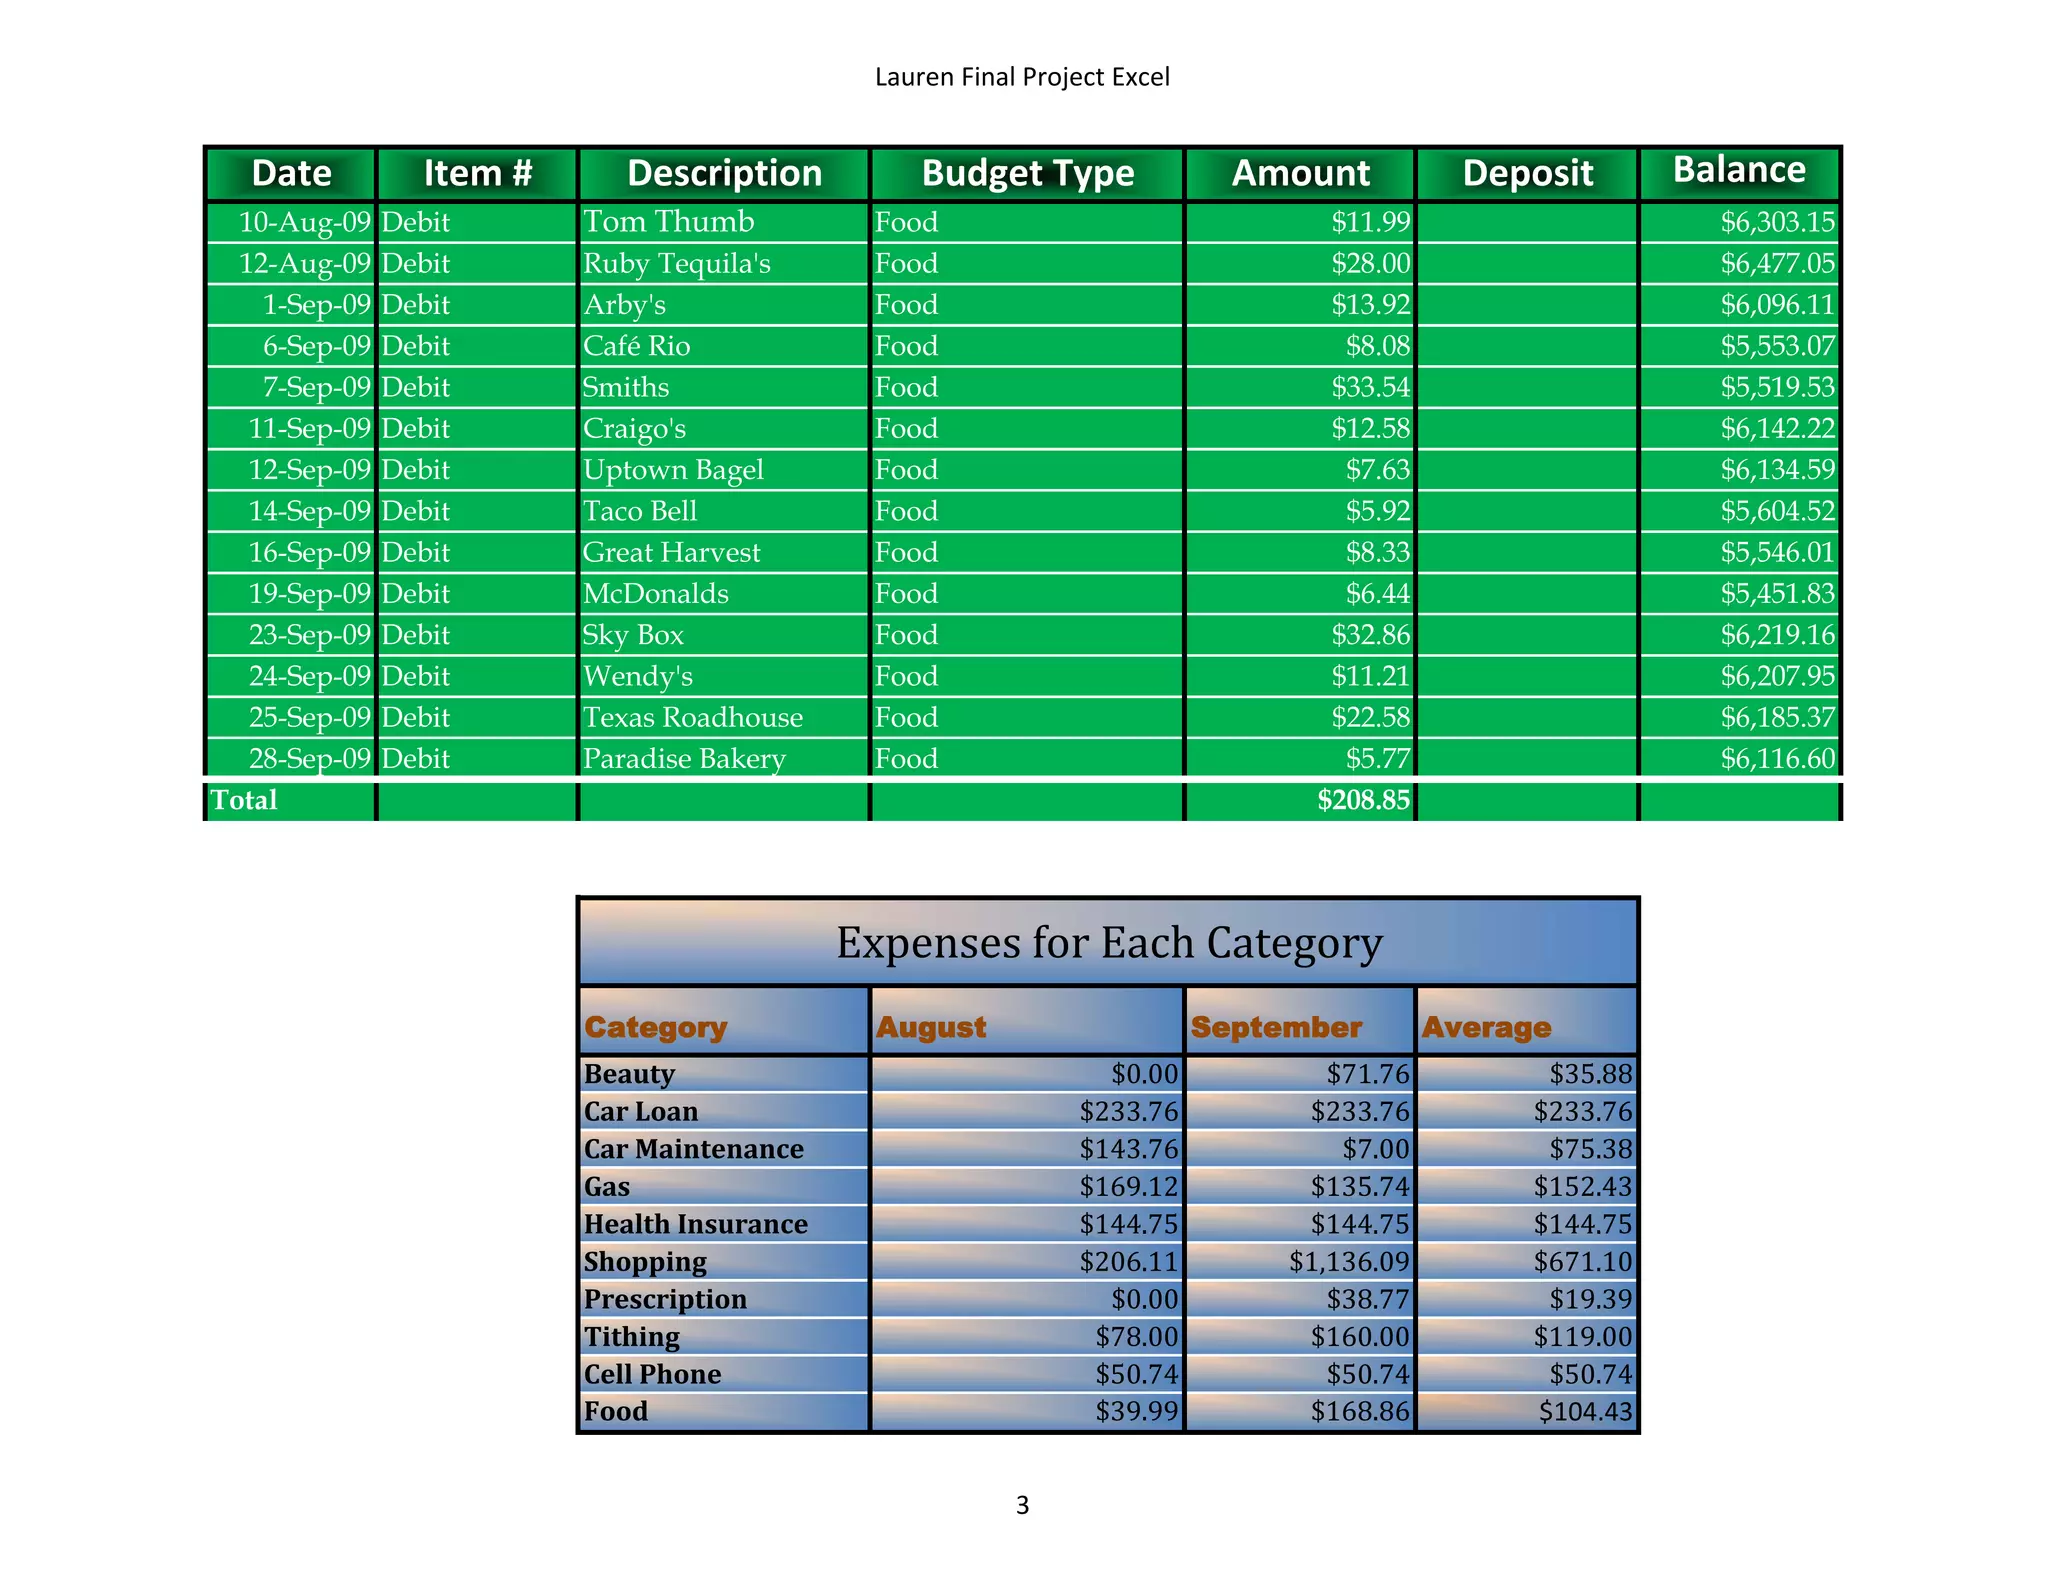
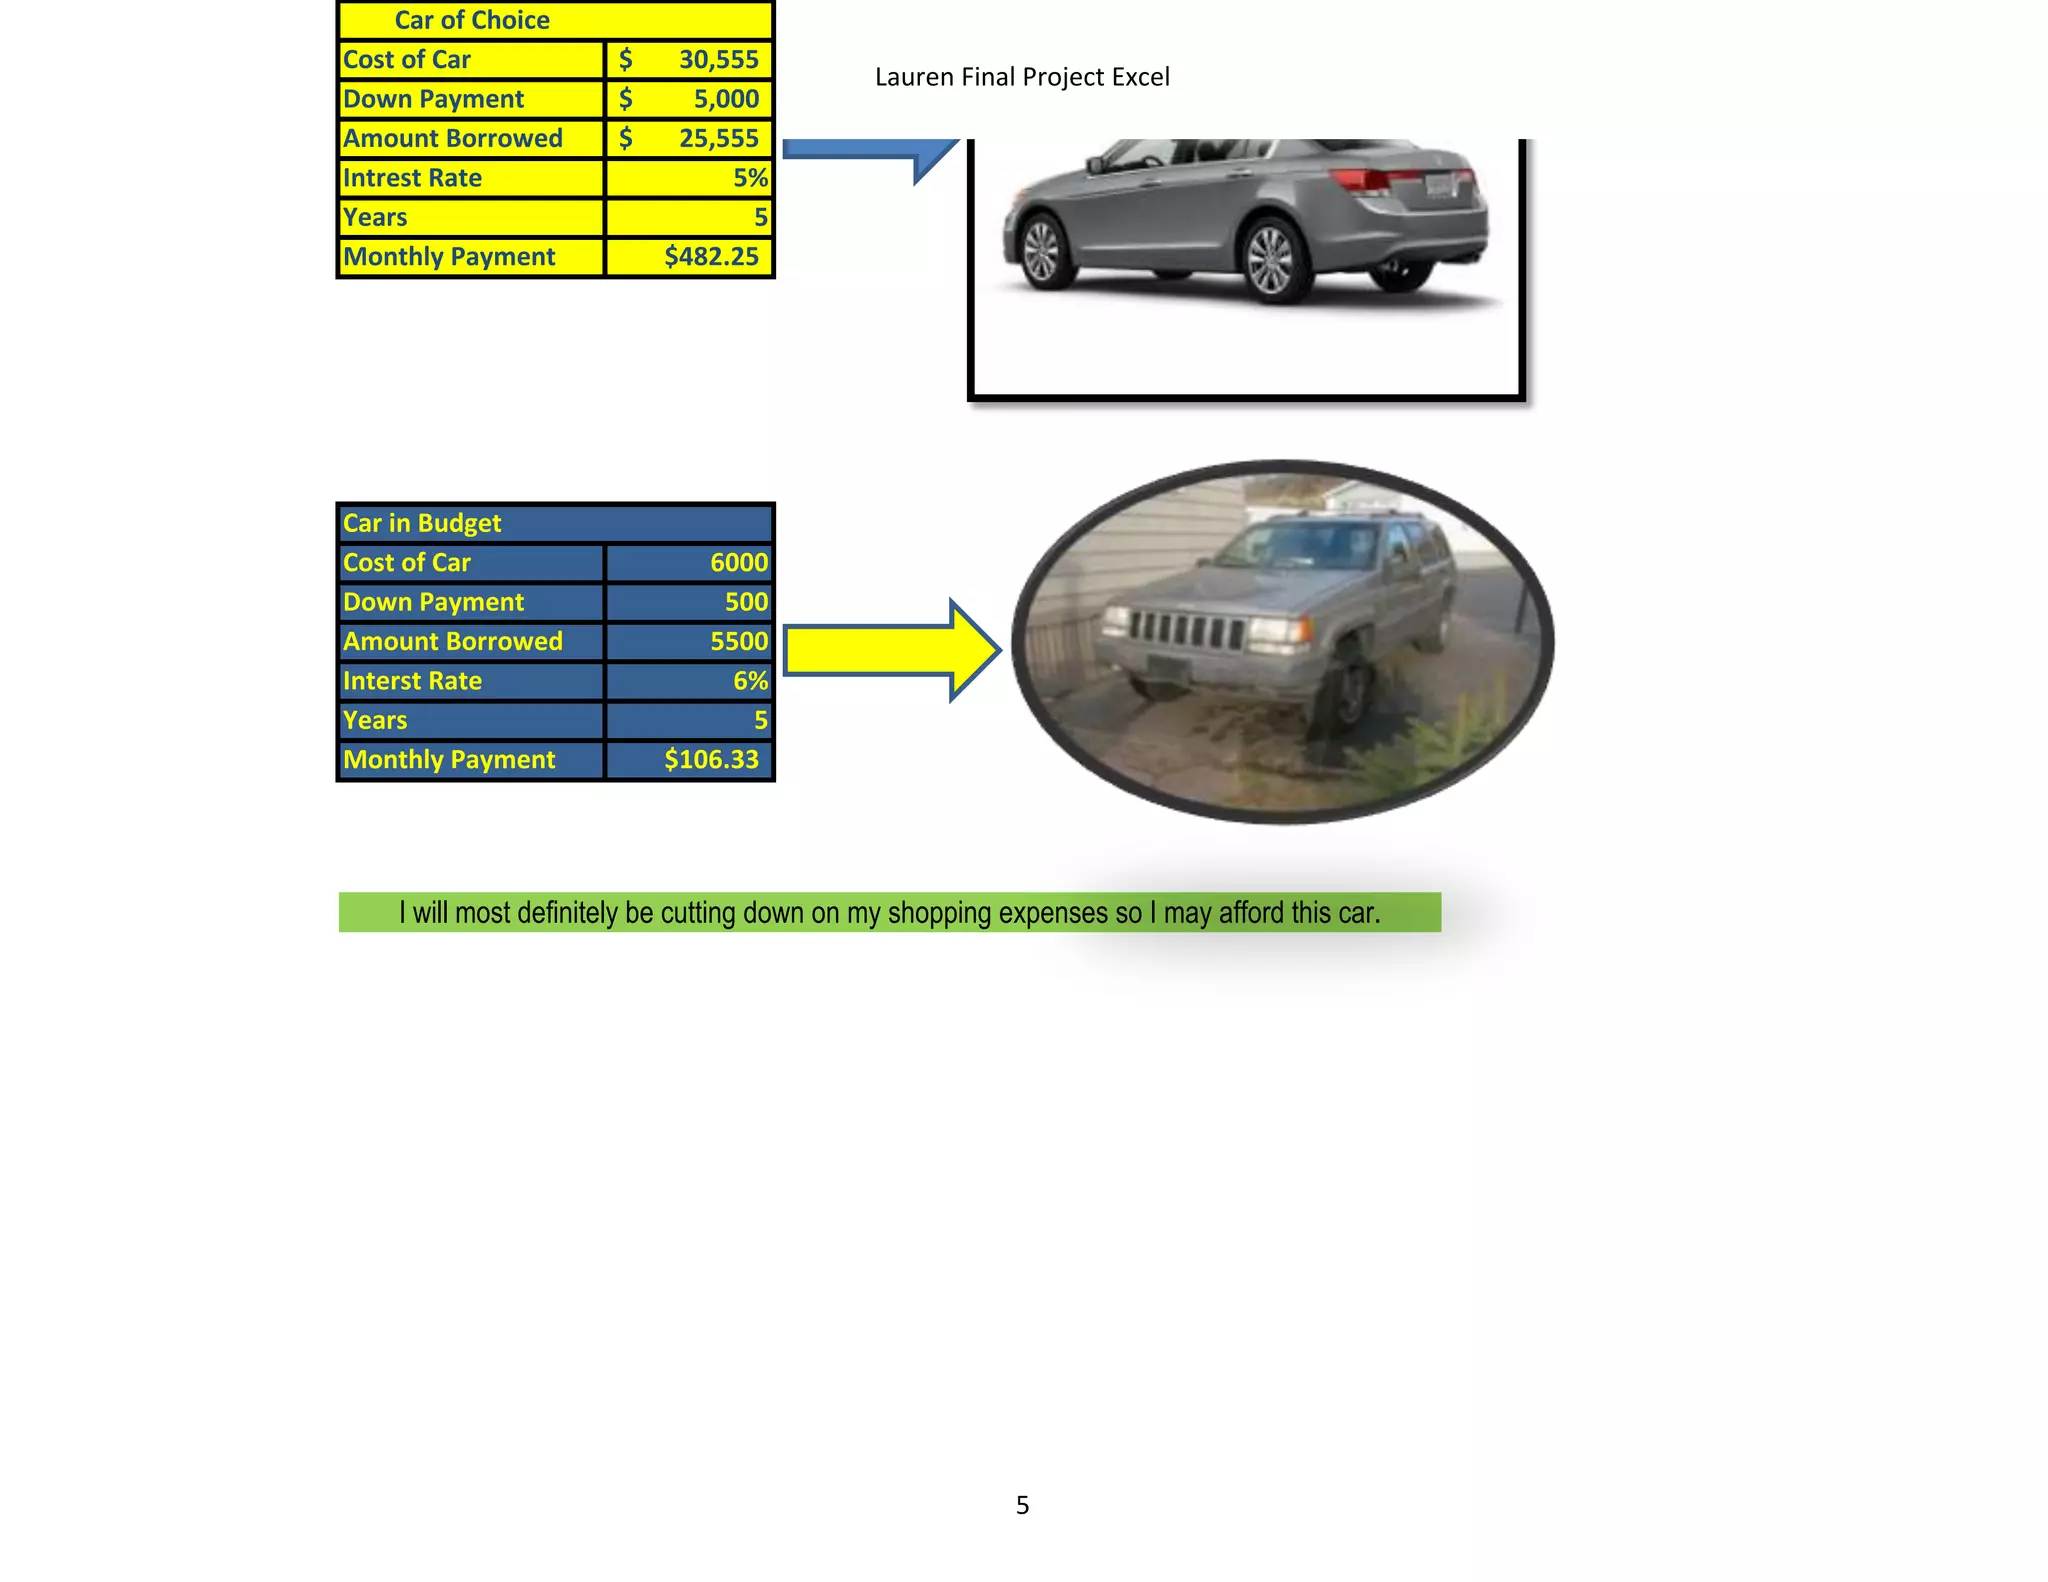
Lauren tracked her expenses over July and August using an Excel spreadsheet. The spreadsheet included details of deposits, withdrawals, balances and categorized expenses. Key findings from the analysis include: total expenses were higher in September than August; shopping and food were among the highest expense categories both months; and Lauren identified reducing shopping expenses as necessary to afford a $30,000 car she wants with a $5,000 down payment and 5-year loan at 5% interest.
![Lauren's Expense Tracker
July-August
Lauren Final Project Excel
=TODAY()
Date Item # Description Budget Type Amount Deposit Balance
6088.37 Minimums/Maximums/Average
=DATE(2009,8,5) Deposit Pay Check 246.56 =G5-E6+F6
40032 Debit Pak-A-Sak Gas 19.79 =G6-E7+F7
40035 Debit Tom Thumb Food 11.99 =G7-E8+F8
40035 Debit Exxon Gas 34.1 =G8-E9+F9
40036 Deposit Pay Check 236 =G9-E10+F10
40037 Debit Ruby Tequila's Food 28 =G10-E11+F11
40037 Debit Texaco Gas 29.01 =G11-E12+F12
40042 Debit Verizon Cell Phone 50.74 =G12-E13+F13
40042 Transfer Toyota Car Loan 233.76
40042 Debit Pak-A-Sak Gas 36.34 =G13-E15+F15
40046 Debit Target Shopping 77.6 =G15-E16+F16
40046 Debit Ross Shopping 14.07 =G16-E17+F17
40046 Deposit Pay Check 293.57 =G17-E18+F18
40047 Debit Church Tithing 78
40048 Debit Old Navy Shopping 57 =G18-E20+F20
40051 Debit Commanche Fuel Gas 34.8 =G20-E21+F21
40053 Debit Firestone Car Maintenance 143.76 =G21-E22+F22
40053 Debit Pak-A-Sak Gas 15.08 =G22-E23+F23
40054 Debit Humana Health Insurance 144.75 =G23-E24+F24
40055 Debit Best Buy Shopping 57.44 =G24-E25+F25
40057 Debit Arby's Food 13.92 =G25-E26+F26
40060 Debit Walgreen's Prescripion 38.77 =G26-E27+F27
40060 Debit Wal Mart Shopping 21.37 =G27-E28+F28
40061 Debit Fanzz Shopping 98.78 =G28-E29+F29
40061 Debit Fred Meyer Shopping 376.04 =G29-E30+F30
40062 Debit Café Rio Food 8.08 =G30-E31+F31
40063 Debit Smiths Food 33.54 =G31-E32+F32
40063 Debit Maverik Gas 29.87 =G32-E33+F33
40064 Debit Paul Mitchell Beauty 43.76 =G33-E34+F34
40067 Deposit Pay Check 708.9 =G34-E35+F35
40067 Debit Craigo's Food 12.58 =G35-E36+F36
40068 Debit Uptown Bagel Food 7.63 =G36-E37+F37
40068 Debit Wal Mart Shopping 331.94 =G37-E38+F38
40068 Debit Maverik Gas 33.87 =G38-E39+F39
40070 Debit Nordstrom Shopping 151.34 =G39-E40+F40
40070 Debit Clair & Dee's Car Maintenance 7 =G40-E41+F41
40070 Debit Taco Bell Food 5.92 =G41-E42+F42
40072 Debit Ross Shopping 50.18 =G42-E43+F43
40072 Debit Great Harvest Food 8.33 =G43-E44+F44
40073 Debit 7-Eleven Gas 37 =G44-E45+F45
40073 Transfer Toyota Car Loan 233.76
40073 Debit Verizon Cell Phone 50.74 =G45-E47+F47
40075 Debit McDonalds Food 6.44 =G47-E48+F48
40077 Deposit Pay Check 800.19 =G48-E49+F49 Totals, Differences, Averages, Minimums, & Maximums
40078 Debit Church Tithing 160 =DATE(2010,10,5)
40079 Debit Sky Box Food 32.86 =G49-E51+F51
40080 Debit Wendy's Food 11.21 =G51-E52+F52 Total Outgoing Aug Difference In Deposits Maximum Expense
40081 Debit Texas Roadhouse Food 22.58 =G52-E53+F53 =SUM(E7:E25) =(F49+F35)-(F18+F10+F6) =MAX(E7:E58)
40081 Debit Chevron Gas 35 =G53-E54+F54 Total Outgoing Sept Difference in Outgoing Minimum Expense
40082 Debit Royal Nails Beauty 28 =G54-E55+F55 =SUM(E26:E58) =SUM(E26:E58)-SUM(E7:E25) =MIN(E7:E58)
40084 Debit Paradise Bakery Food 5.77 =G55-E56+F56 August Deposits Average Expense
40085 Debit Humana Health Insurance 144.75 =G56-E57+F57 =SUM(F6:F18) =AVERAGE(E7:E58)
40085 Debit Wal Mart Shopping 106.44 =G57-E58+F58 Sept Deposits
Total =SUBTOTAL(109,[Amount]) =SUM(F35:F49)
1](https://image.slidesharecdn.com/excelproject-lo-101203133646-phpapp02/75/Excel-project-lo-1-2048.jpg)


![Reflection[1]](https://cdn.slidesharecdn.com/ss_thumbnails/reflection1-110427113517-phpapp02-thumbnail.jpg?width=640&height=640&fit=bounds)


